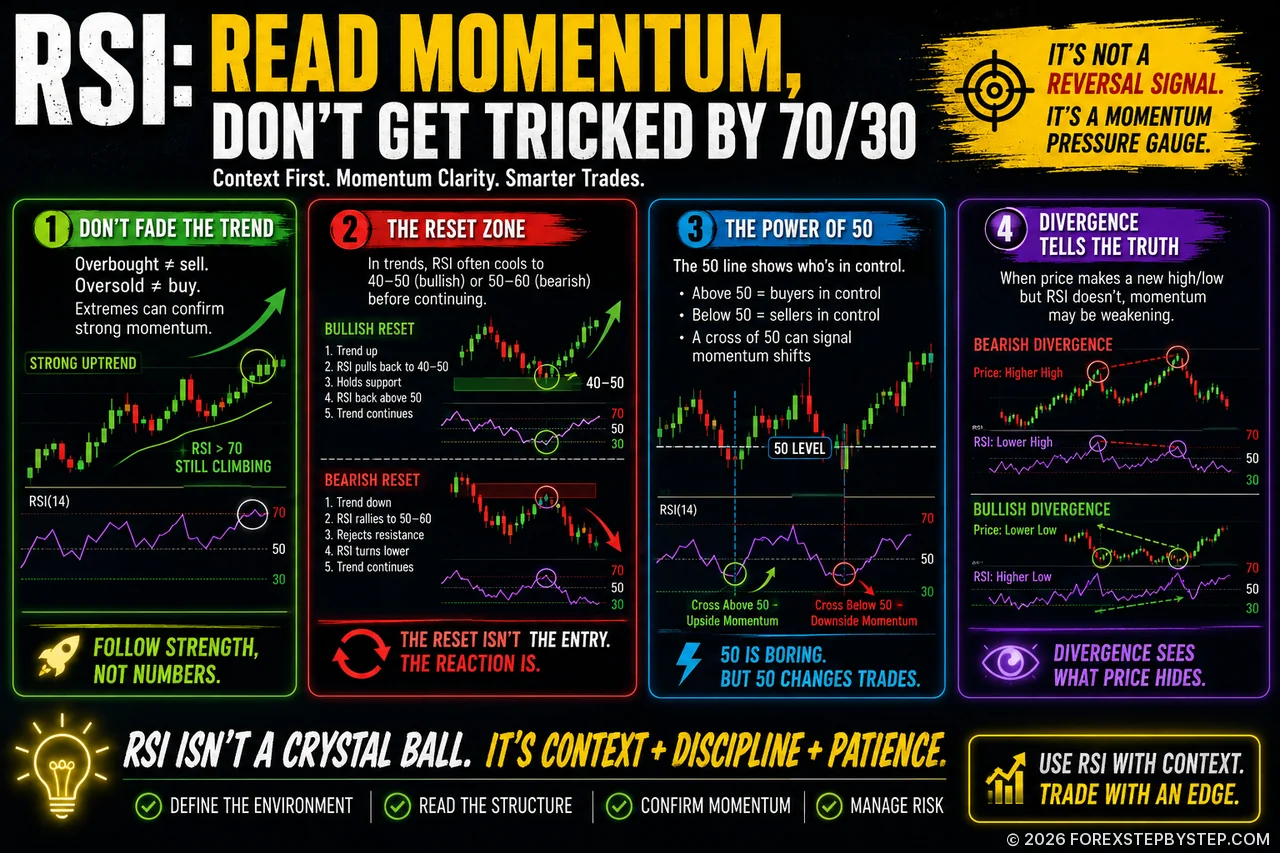
The RSI trap most traders fall into: why 70/30 readings can mislead — and how context, resets, the 50 line, and divergence reveal the real momentum story.
⚡ The RSI Mistake That Catches Many Forex Traders Off Guard
Most Forex traders learn the RSI in a very simple way: above 70 means overbought, below 30 means oversold. It sounds useful at first, but live markets rarely follow that rule so neatly.
A strong currency pair can stay overbought while buyers keep pushing price higher. A weak pair can remain oversold while sellers continue to dominate. In those moments, the RSI is not giving a simple buy or sell signal. It is showing pressure.
This article takes a closer look at how RSI behaves in real Forex conditions. It covers the overlooked 50 line, hidden divergence, liquidity sweeps, London open fakeouts, reset zones, and momentum compression before breakouts.
The real question is not whether RSI is high or low. It is whether momentum is confirming the move — or quietly warning that something is wrong.
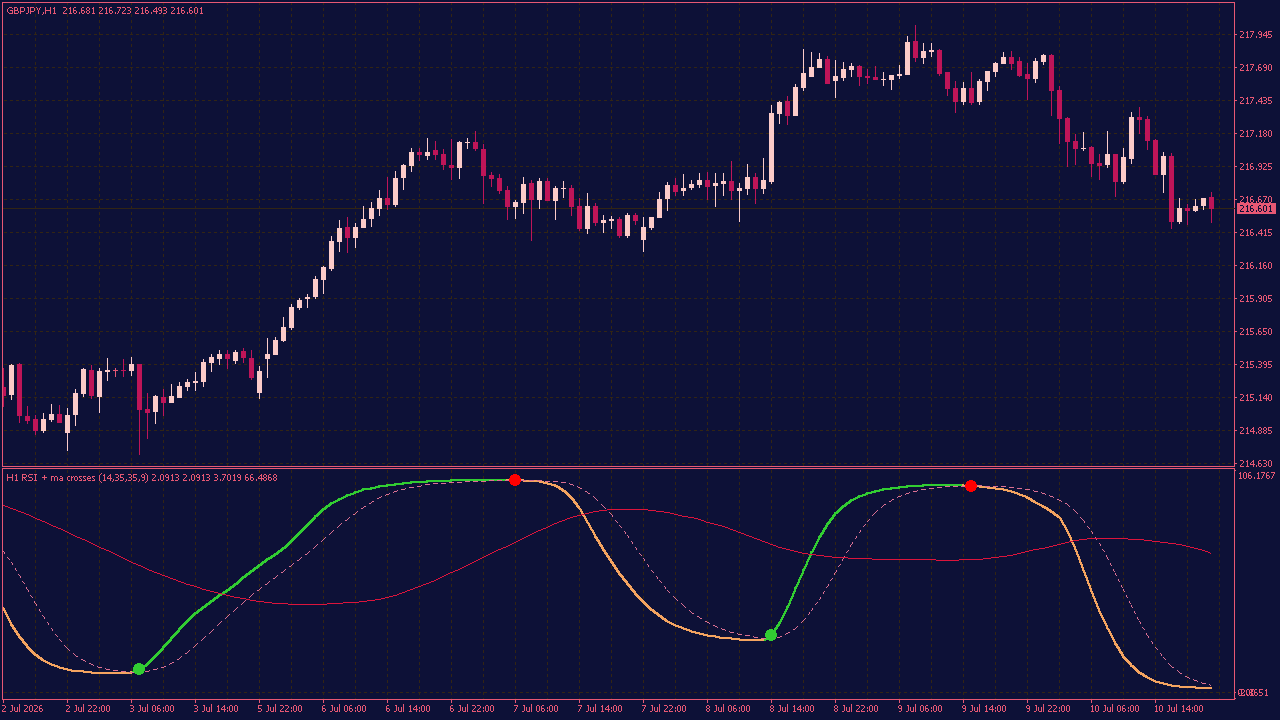
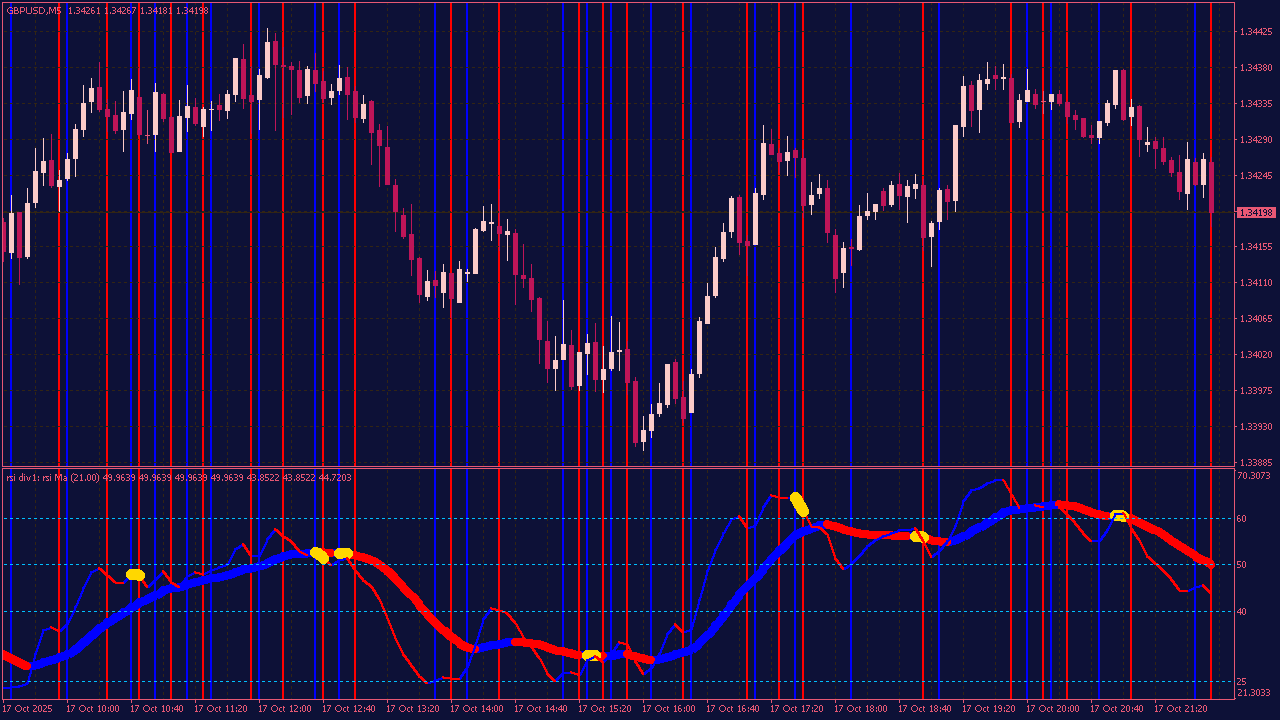
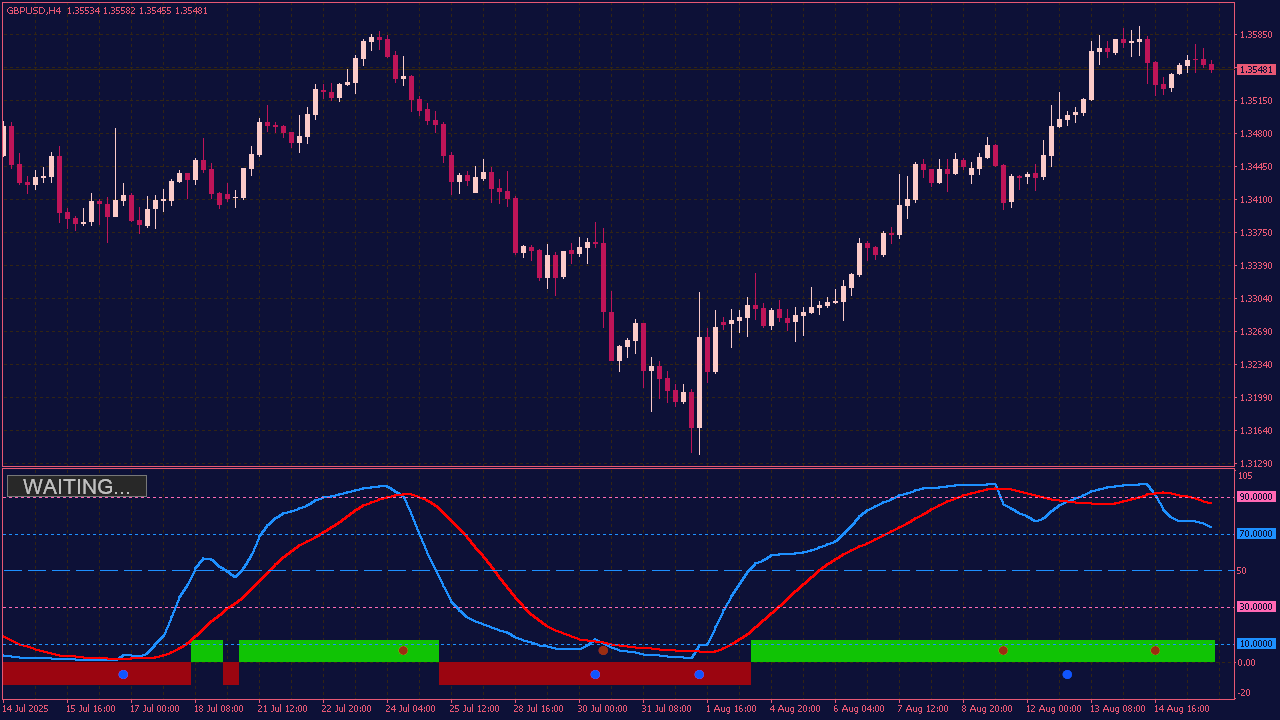
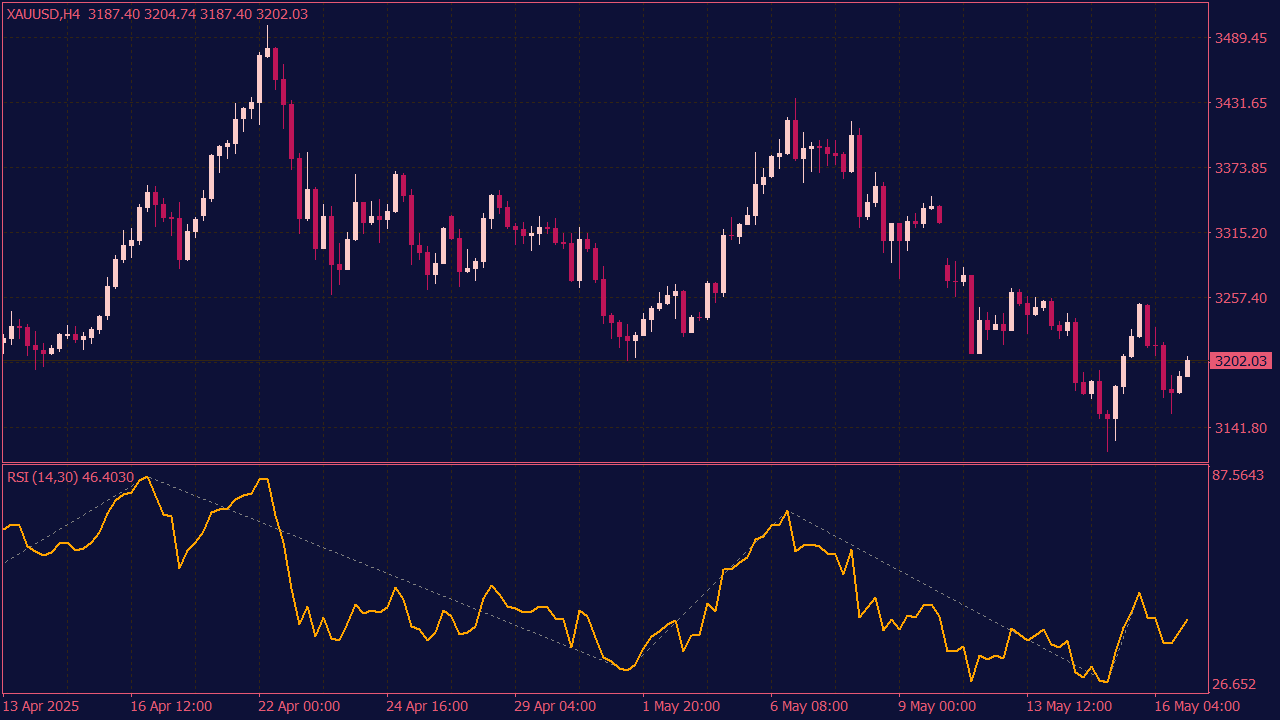
The RSI Plus 2 MA Crosses MTF Indicator gives traders a clearer way to follow changes in momentum without overloading the chart. It combines a smoothed RSI with two moving averages, making it easier to see when short-term pressure begins to shift against the broader direction. The settings can be adjusted to suit different trading styles and timeframes. Crossovers may appear as dots or arrows, and alerts can help draw attention to new signals without requiring constant chart monitoring. Higher-timeframe information can also be viewed directly from the current chart. What makes the indicator interesting is not simply the crossover itself. The real value may appear when momentum starts changing while price still looks calm. That small shift can sometimes raise an important question: is the market only pausing, or is something larger beginning to develop?
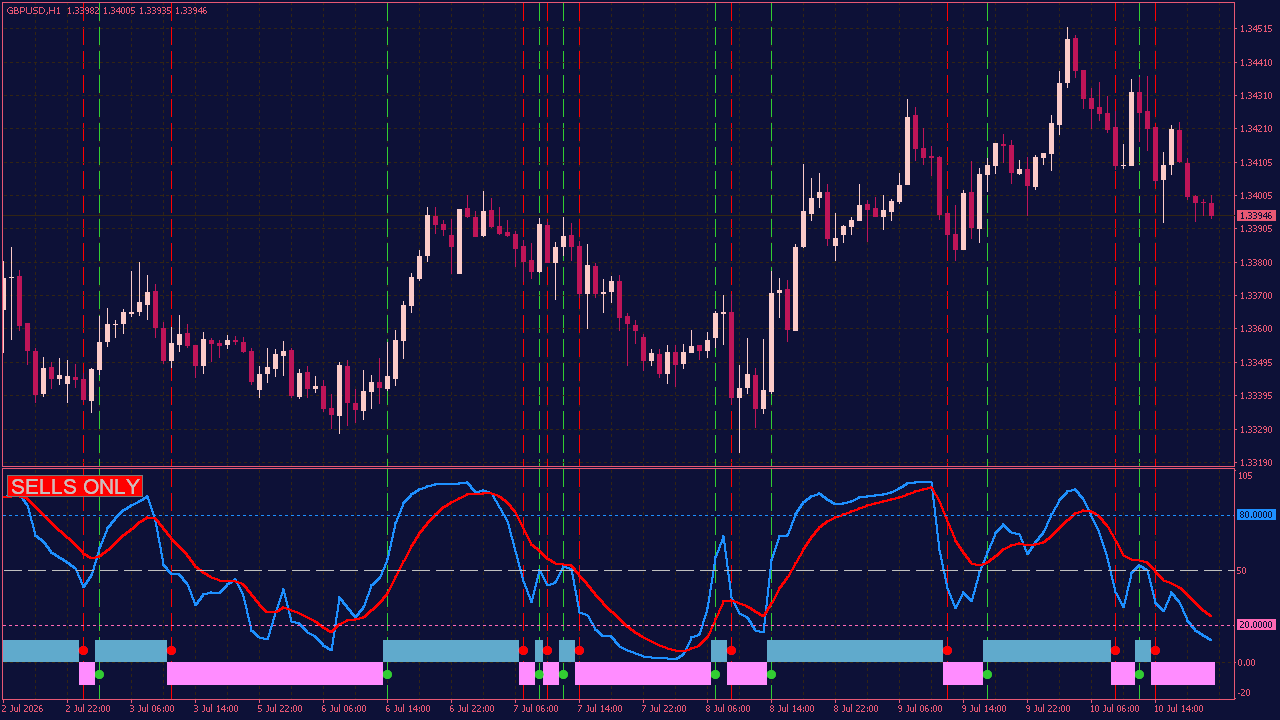
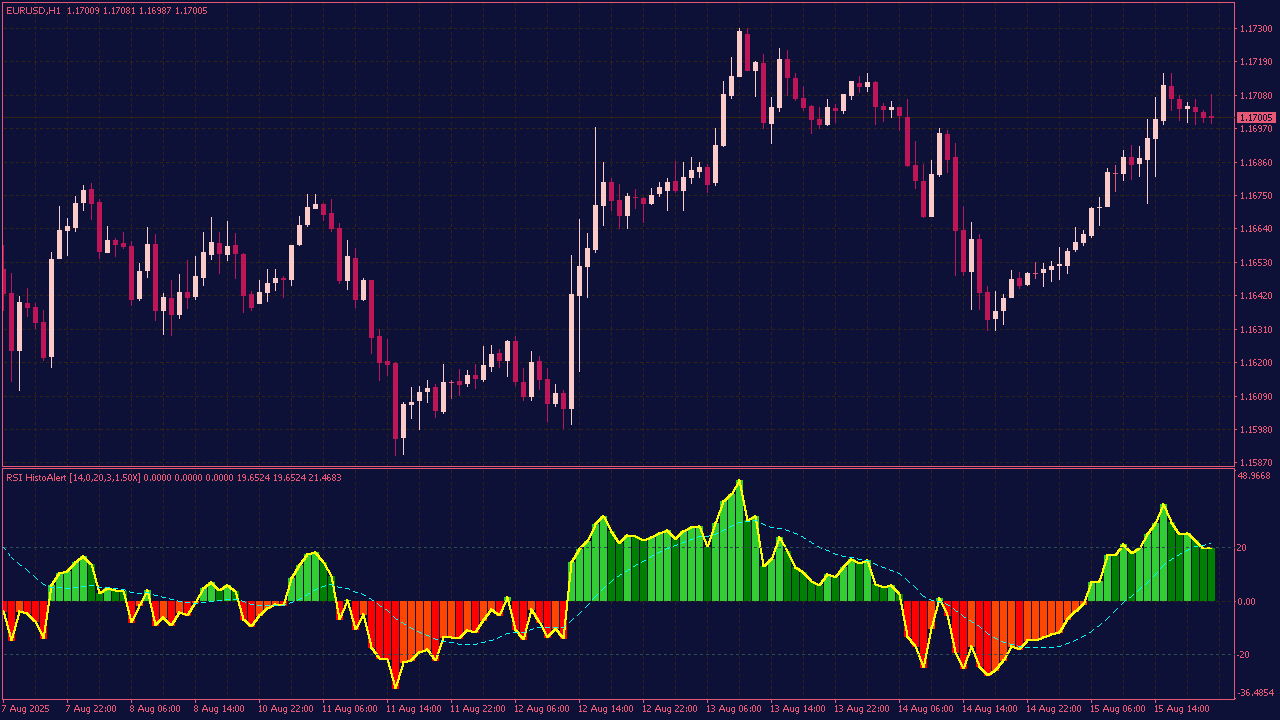
The XARDg RSIOMA Indicator helps you see how momentum is developing behind the price movement. Rather than focusing only on candles, it gives you another view of the balance between buyers and sellers. The indicator uses a smoothed RSI system, visual bars, arrows, and clear market messages to highlight bullish, bearish, and neutral conditions. It can be especially helpful when the chart looks unclear and you want a cleaner picture of the current pressure. Sometimes price still looks quiet while momentum has already started to turn. Watching those early changes can make you wonder: is the market simply pausing, or is a new move beginning to form?
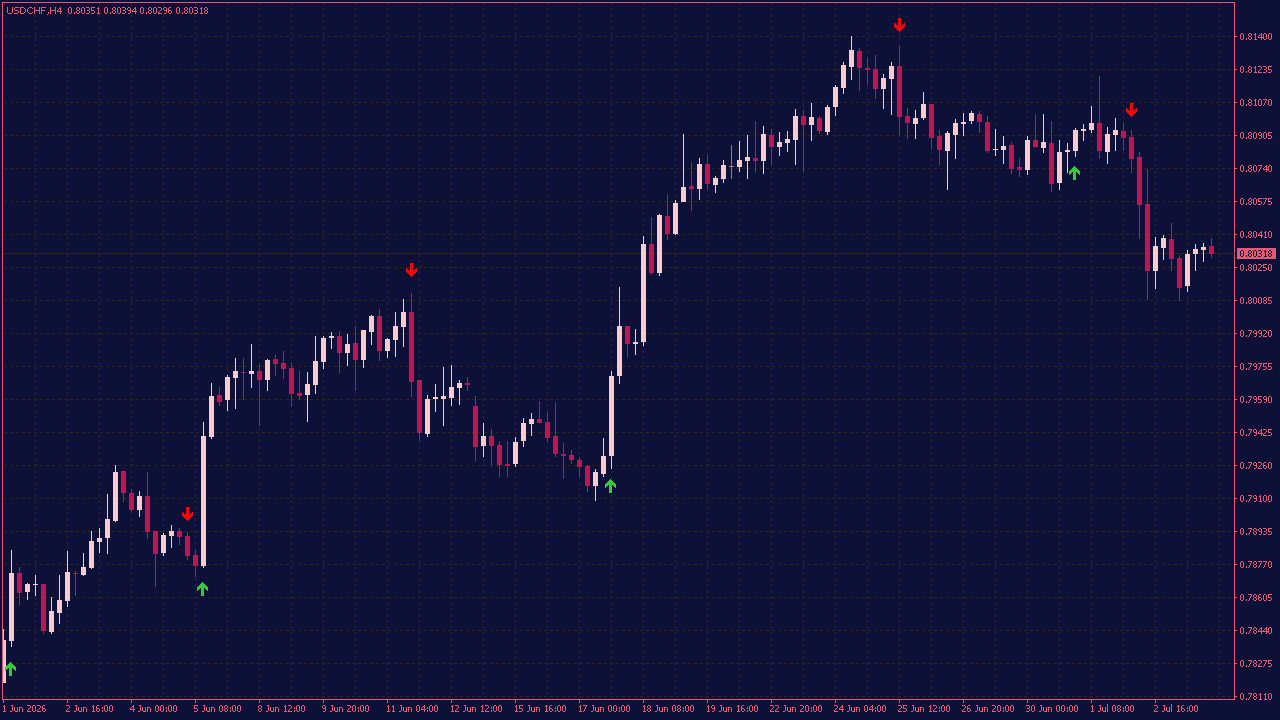
The RSI Cross MTF Indicator with Alerts and Arrows is made for traders who want a simple way to follow RSI momentum directly on the price chart. Instead of constantly checking the RSI window, the indicator marks possible buy and sell moments with clear arrows. A buy arrow appears when the RSI moves into stronger bullish momentum, while a sell arrow appears when the RSI shifts into weaker or bearish momentum. The multi-timeframe feature allows you to use signals from the current chart timeframe or from a higher timeframe.
This can be helpful when you want to reduce market noise and get a clearer view of the overall direction. The indicator also includes alert options, such as pop-up alerts, sound alerts, push notifications, and email alerts, so you do not have to watch the chart all the time. Most settings can be adjusted, including the RSI period, timeframe, arrow size, arrow distance, arrow symbols, and alert preferences. The indicator can be used for scalping, intraday trading, or higher-timeframe analysis. It is not a complete trading system by itself, so it works best together with price action, trend direction, support and resistance, or another confirmation method.
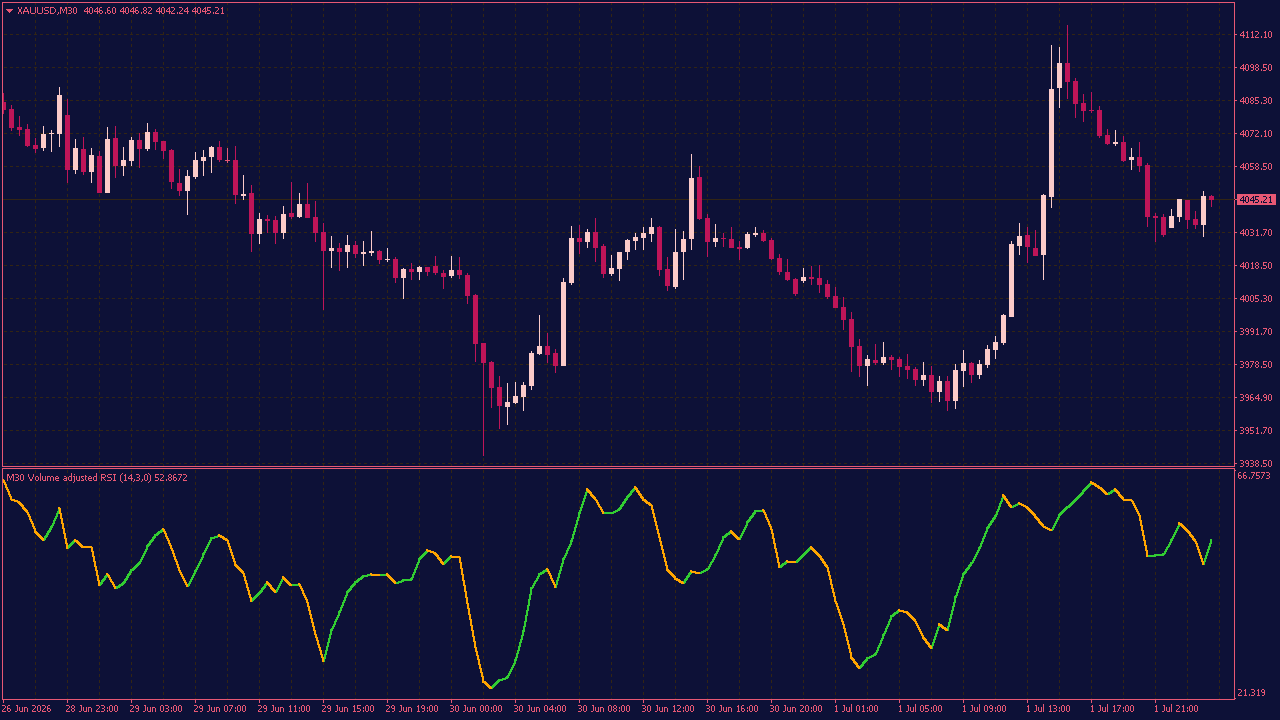
The Volume Adjusted RSI Indicator is designed to give traders a more balanced view of market momentum by combining RSI analysis with volume activity. While the standard RSI mainly focuses on price movement, this indicator also looks at how much volume is behind that movement. This can help traders better understand whether a trend is supported by real market participation or whether the momentum may be starting to fade. The indicator is shown in a simple oscillator-style window, making it easy to read and familiar for anyone who already uses RSI-based tools. Rising values may suggest stronger bullish momentum, while falling values can point to weaker buying pressure or increasing bearish strength. It can be used to confirm trends, identify possible momentum shifts, spot early signs of reversals, or filter trading signals as part of a broader strategy. With adjustable smoothing, volume options, and different price calculation methods, the Volume Adjusted RSI Indicator offers a practical way to add volume-based context to traditional RSI analysis.
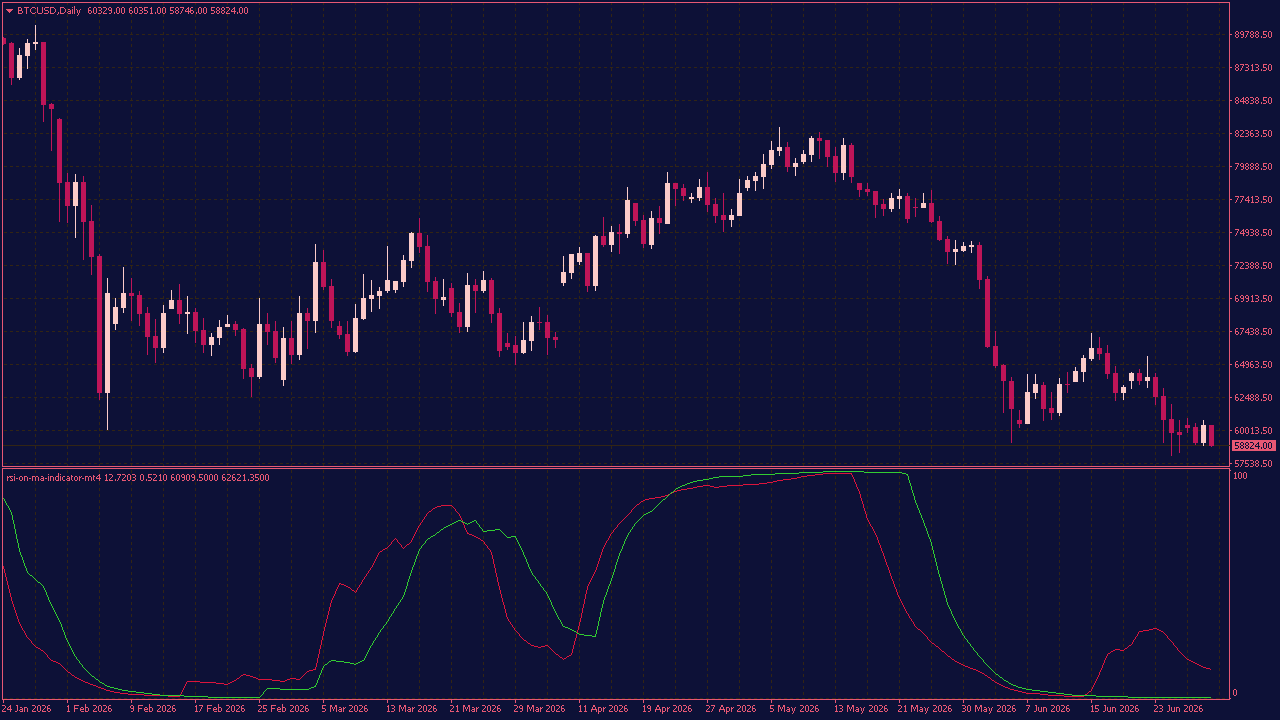
The RSI on MA indicator is a simple tool for reading market momentum in a smoother way. Instead of using only raw price movement, it calculates RSI values from moving averages, which can help reduce some of the noise on the chart. It shows two RSI lines, so traders can compare faster and slower momentum changes at a glance. This can be useful when checking whether a trend is still strong, losing strength, or moving into an overbought or oversold area. The indicator settings can be adjusted, including the RSI period, moving average periods, MA method, and applied price. It works best as an extra confirmation tool together with your own trading strategy, rather than as a signal to trade on its own.
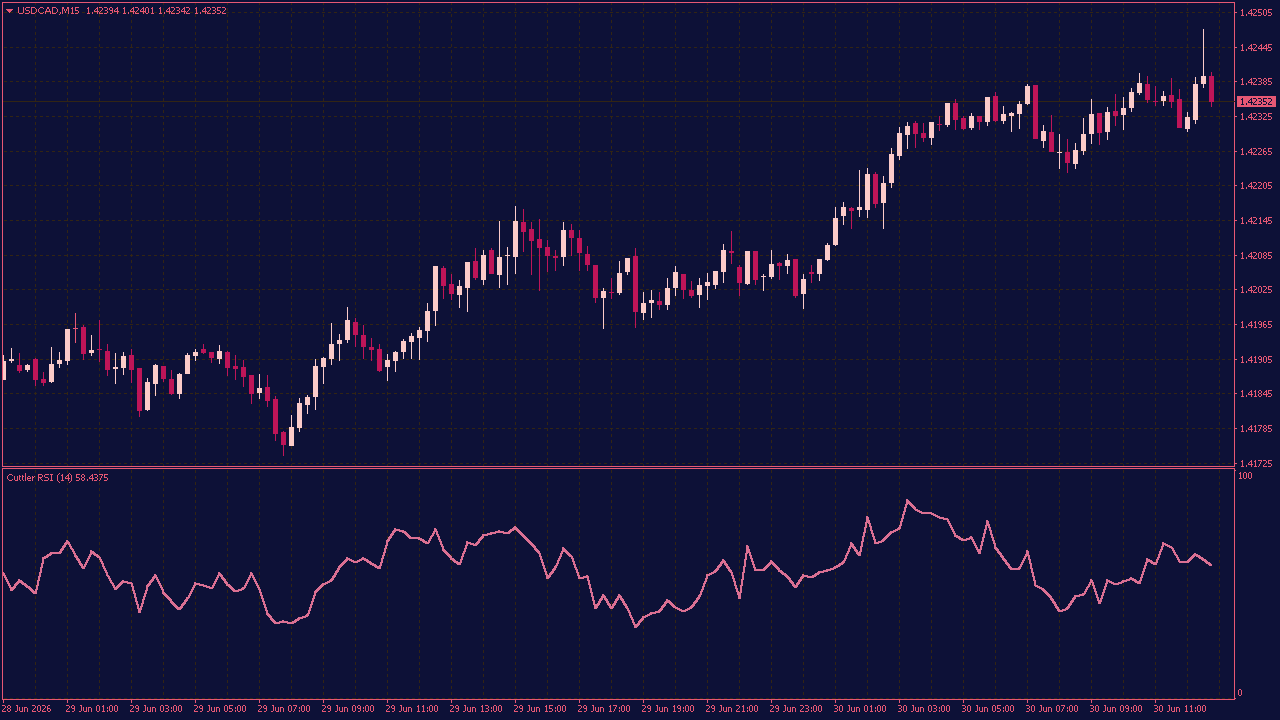
The Cuttler RSI Indicator is a practical tool for traders who want to get a clearer view of market momentum. It is based on the well-known RSI idea, but uses a different calculation method, which can make it useful when you want another perspective on price strength. In simple terms, the indicator helps show whether the market may be too stretched in one direction. High values can point to strong buying pressure, while low values may suggest stronger selling pressure or a possible oversold area.
Traders can use the Cuttler RSI to confirm the direction of a trend, look for possible reversal zones, or check whether a price move still has strength behind it. Like most indicators, it works best when it is used together with other analysis methods, such as price action, support and resistance, or trend structure. The settings can be adjusted to suit different timeframes, markets, and trading styles, making the indicator flexible for both short-term and longer-term analysis.
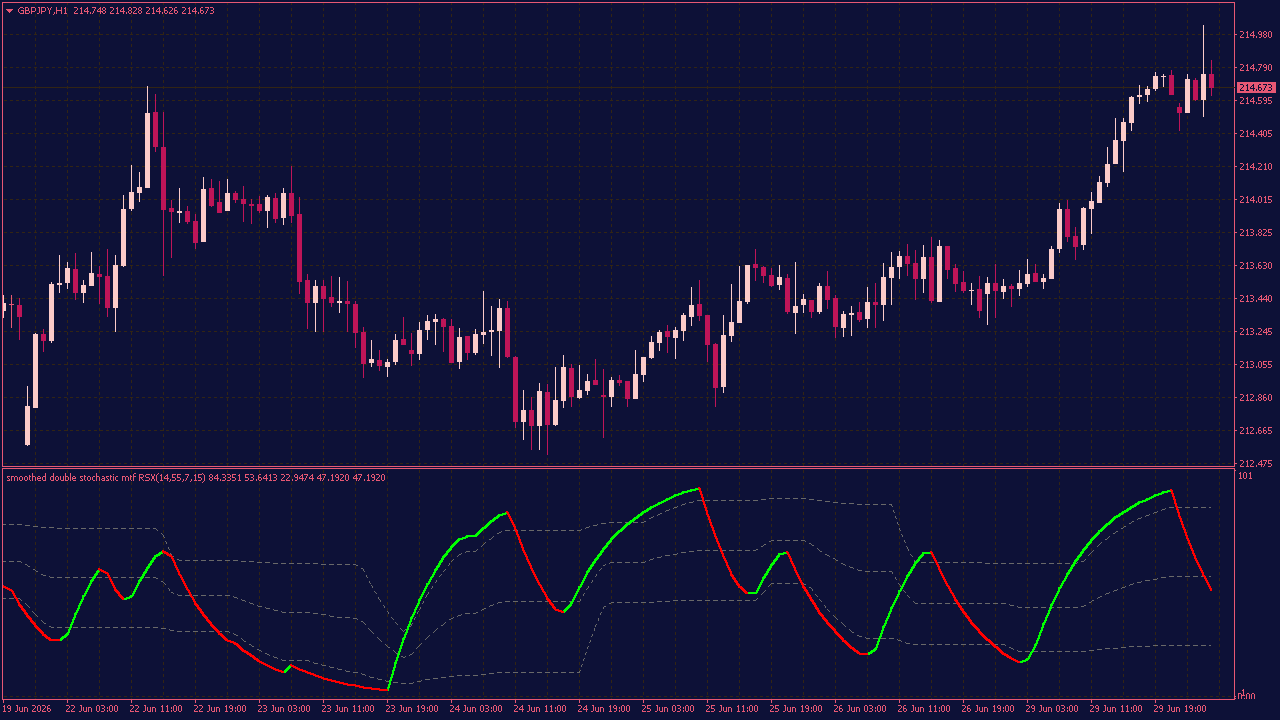
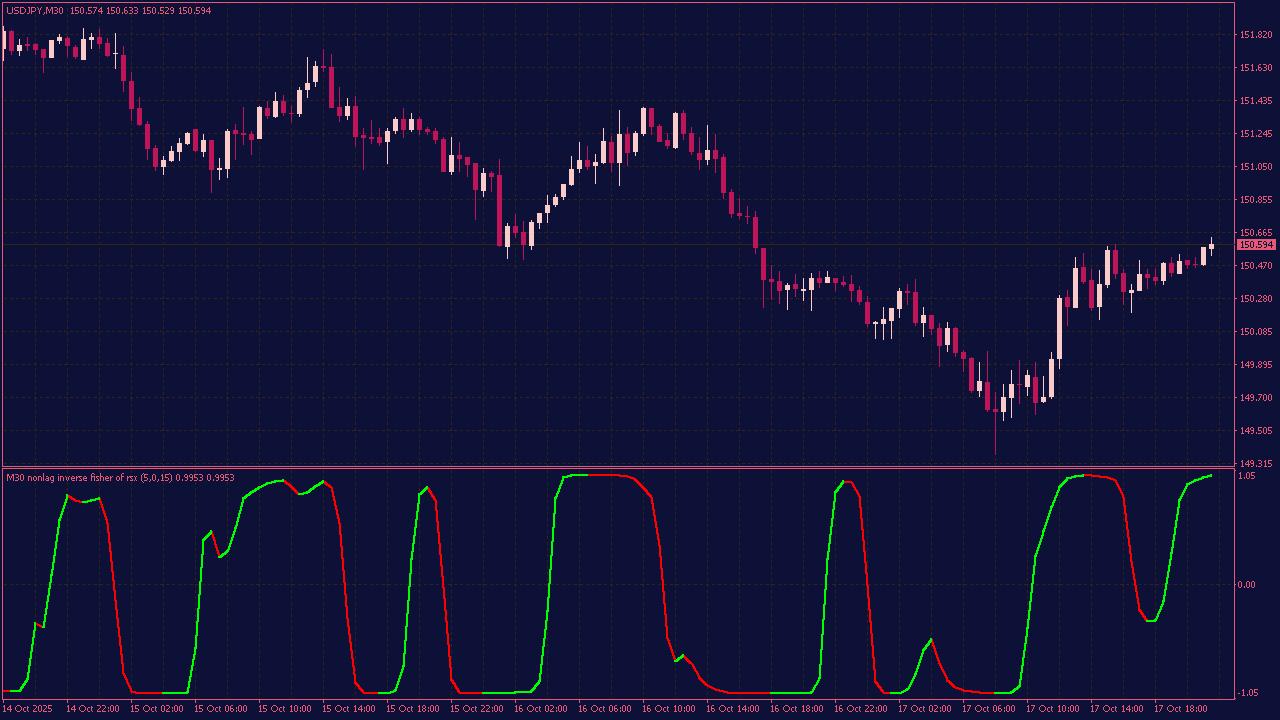
The Double Stochastic RSI MTF is a momentum indicator built for traders who want a smoother and clearer view of market direction. It combines RSI or RSX values with a double stochastic calculation, which can help filter out some of the noise that often appears in standard oscillator signals. The indicator can be used to spot changes in momentum, confirm the current trend, and identify possible overbought or oversold areas. It also includes floating levels, so the zones adjust to recent market behavior instead of staying fixed all the time.
A color-changing line makes it easier to see when momentum is turning bullish, bearish, or staying neutral. With multi-timeframe support, traders can compare signals from different timeframes and get a broader view before making a decision. This indicator is useful for trend confirmation, reversal analysis, and filtering trade setups, especially when used together with price action or other technical tools.
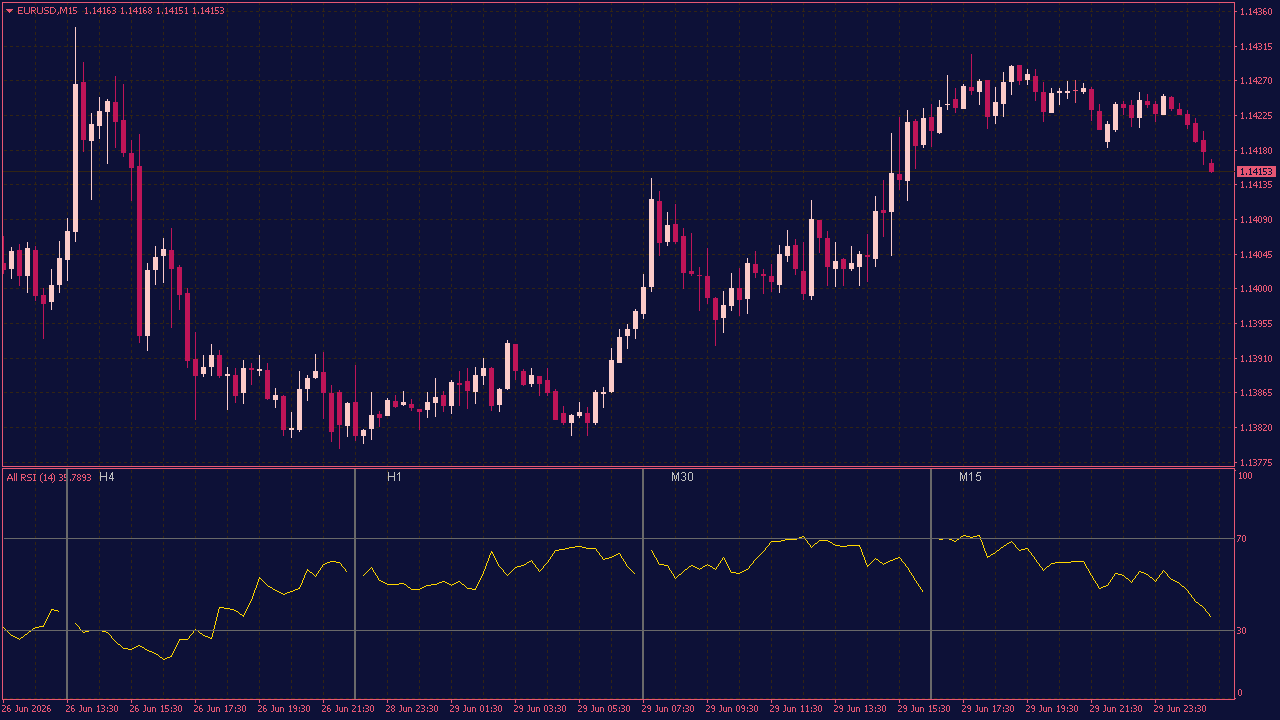
The All RSI Indicator is a practical tool for traders who want to keep an eye on RSI behavior across several time frames at the same time. Instead of switching back and forth between charts, you can view the RSI values in one separate window and quickly see how momentum is developing on both smaller and larger periods. This can be helpful when checking whether the market is gaining strength, losing momentum, or moving into areas that may be considered overbought or oversold. The indicator does not tell you when to buy or sell. It is simply designed to give you a clearer overview of current market conditions and support your own technical analysis.
The RSI (Relative Strength Index) is a popular momentum oscillator that identifies overbought or oversold conditions in a market. Combining RSI with colored candles in a chart can enhance trade setups by visually highlighting potential entry and exit points. For example, when the RSI crosses above 70, indicating overbought conditions, and the candle turns red, it may suggest a potential sell signal. Conversely, if the RSI dips below 30, signaling oversold conditions, and the candle turns green, it could indicate a potential buy opportunity. Utilizing these visual cues together can provide clearer trading signals and improve decision-making in various market conditions.
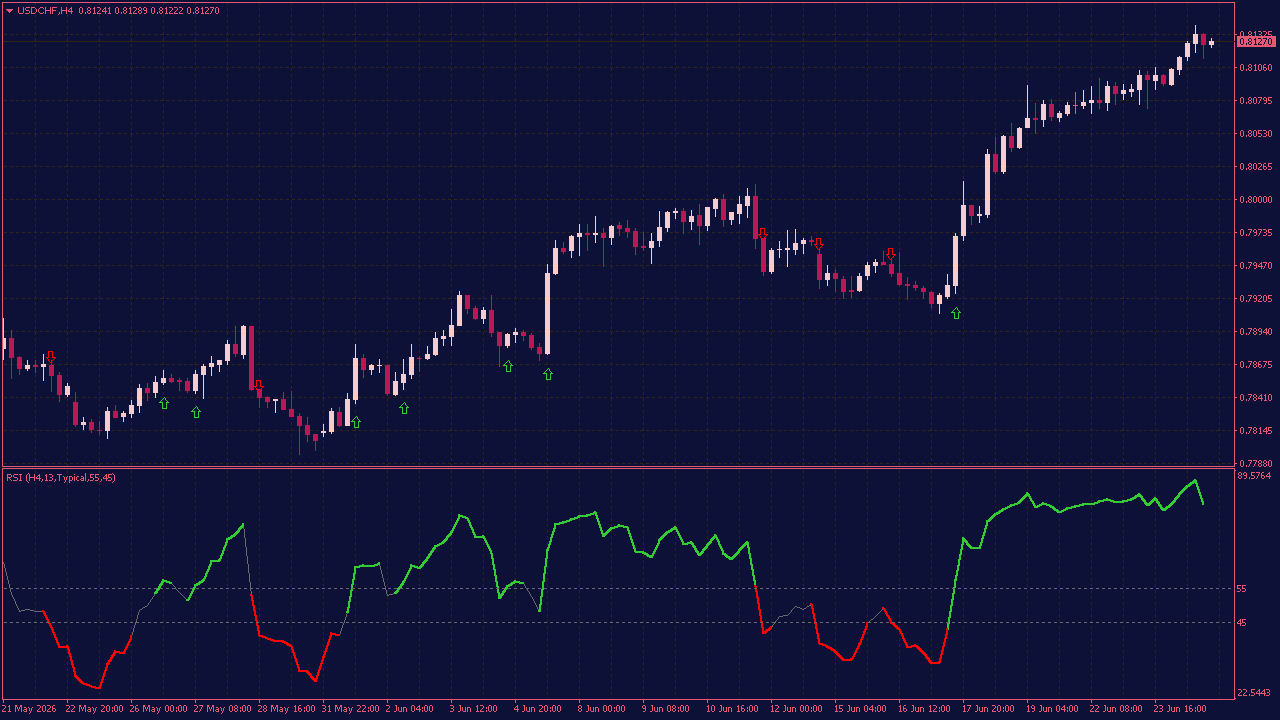
The RSI Trend Color Indicator with Alert and Arrows is a dynamic trading tool that visualizes RSI signals on your chart by changing the color of the trend based on RSI levels, providing clear visual cues for potential reversals or trend continuations. It also features alert notifications to notify traders when specific RSI conditions are met, such as overbought or oversold levels, and displays arrows to highlight buy or sell signals directly on the chart for quick decision-making. This indicator helps traders easily identify RSI-based trend shifts and act promptly with visual and auditory alerts.
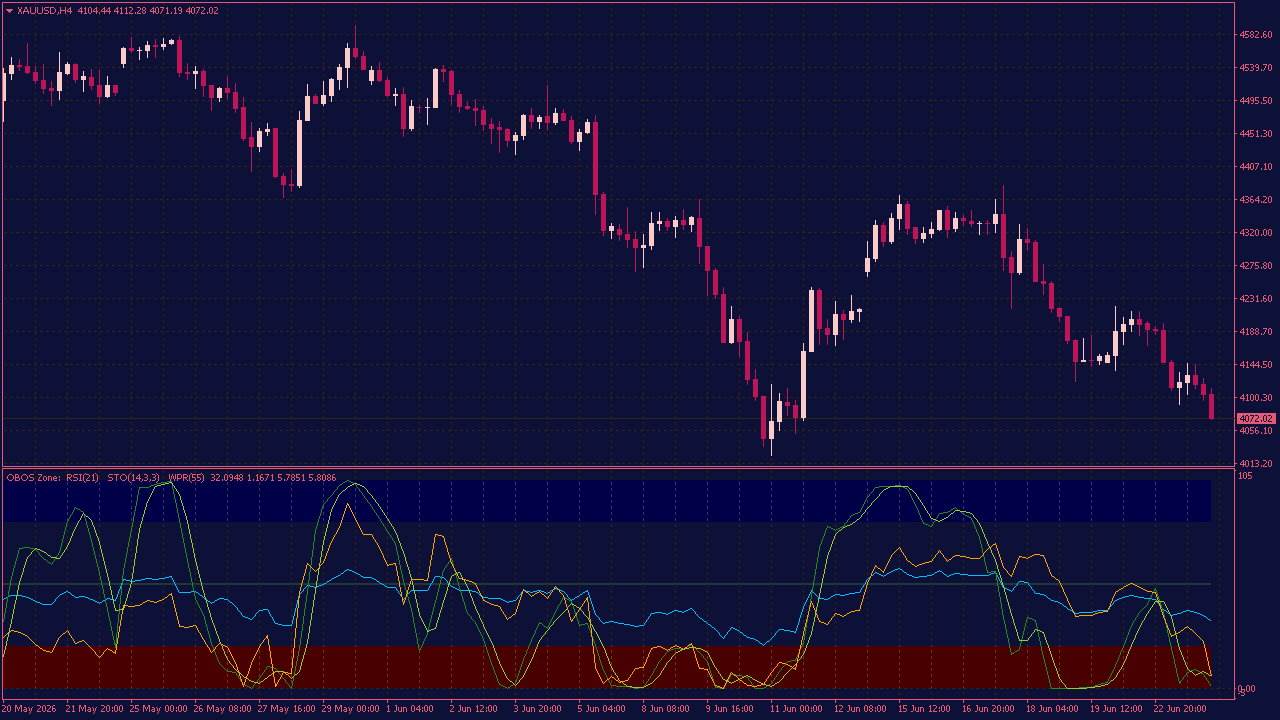
The RSI + Stochastic + WPR Indicator with OBOS Zone combines three powerful momentum and overbought/oversold indicators (Relative Strength Index, Stochastic Oscillator, and Williams Percent Range) to enhance trading accuracy. The OBOS Zone highlights critical levels where assets are considered overbought or oversold, typically signaling potential reversals or pullbacks. RSI measures the strength and speed of price movements, while Stochastic and WPR assess momentum and price positioning within recent ranges. Together, they provide a comprehensive view of market conditions, helping traders identify high-probability entry and exit points when multiple indicators signal overbought or oversold scenarios within the OBOS Zone.
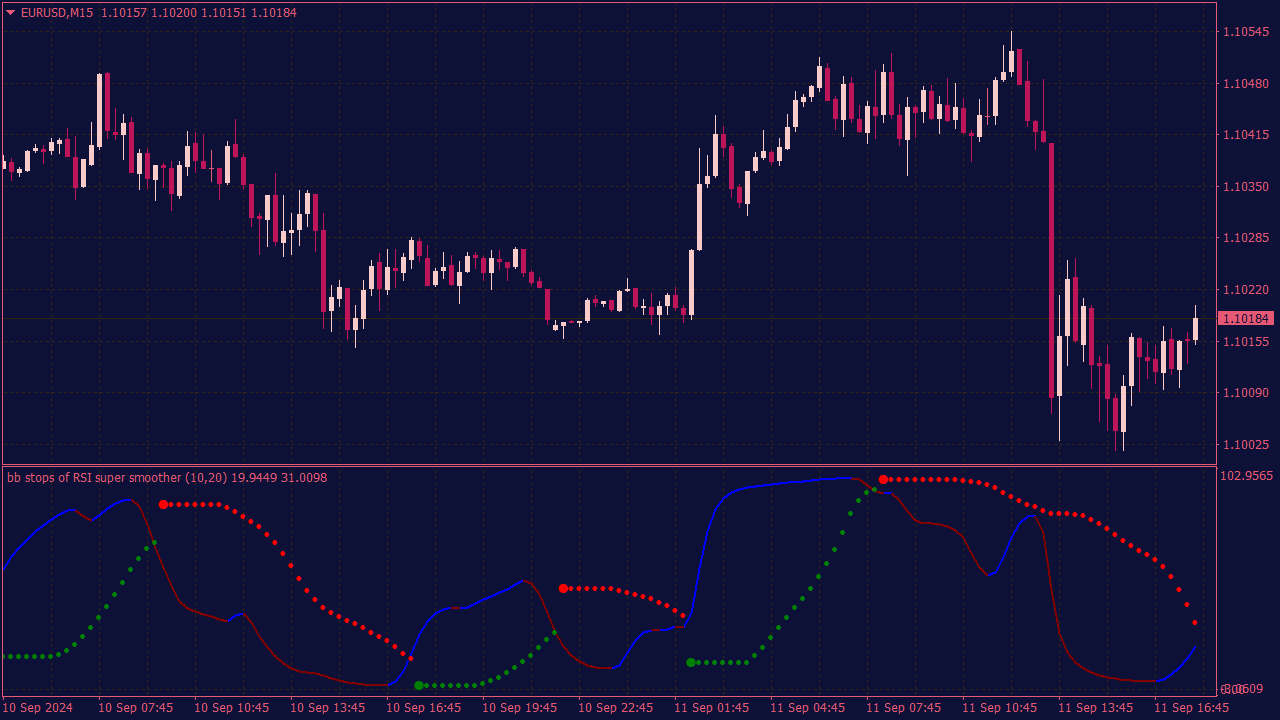
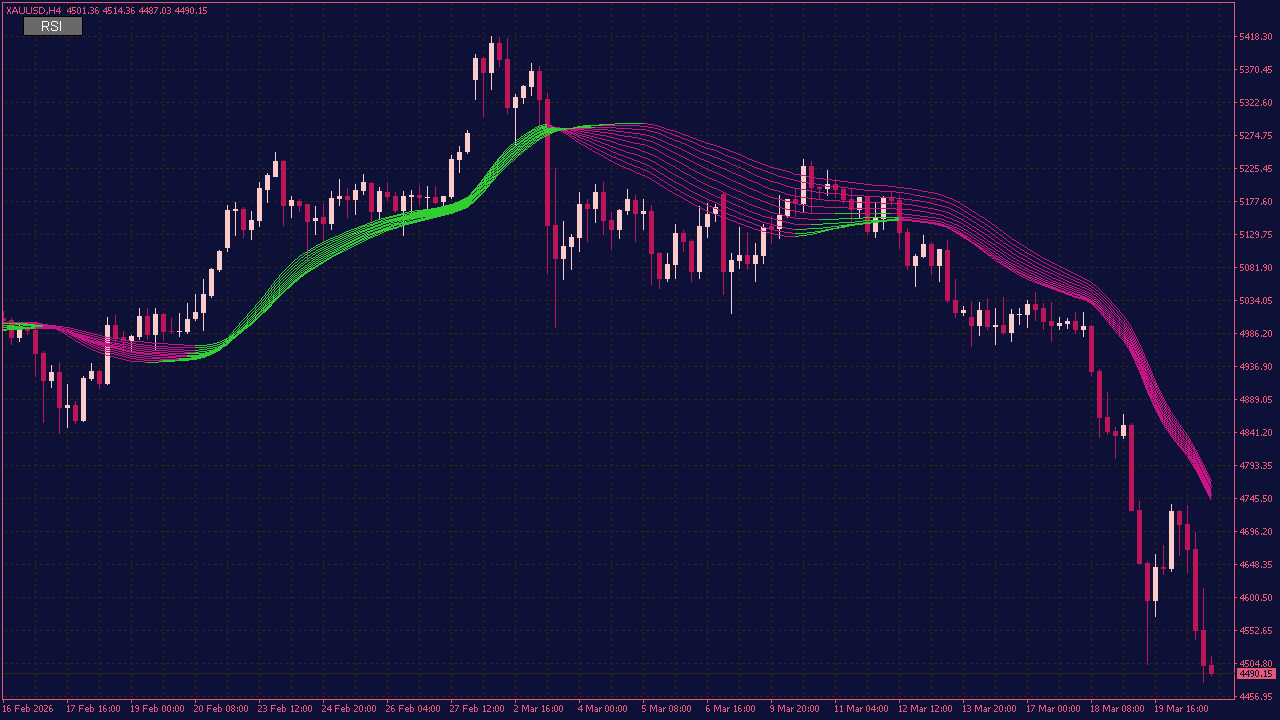
The BB Stops RSI Super Smooth Indicator is a custom trading tool that combines a smoothed RSI with Bollinger Band-style stop levels. It helps identify trend direction and potential buy/sell signals using line crossovers and colored dots. When the RSI crosses above the BB Stop line, it signals a potential buy; a cross below signals a sell. It's popular for scalping and intraday trading due to its noise-filtering and trend-following capabilities.
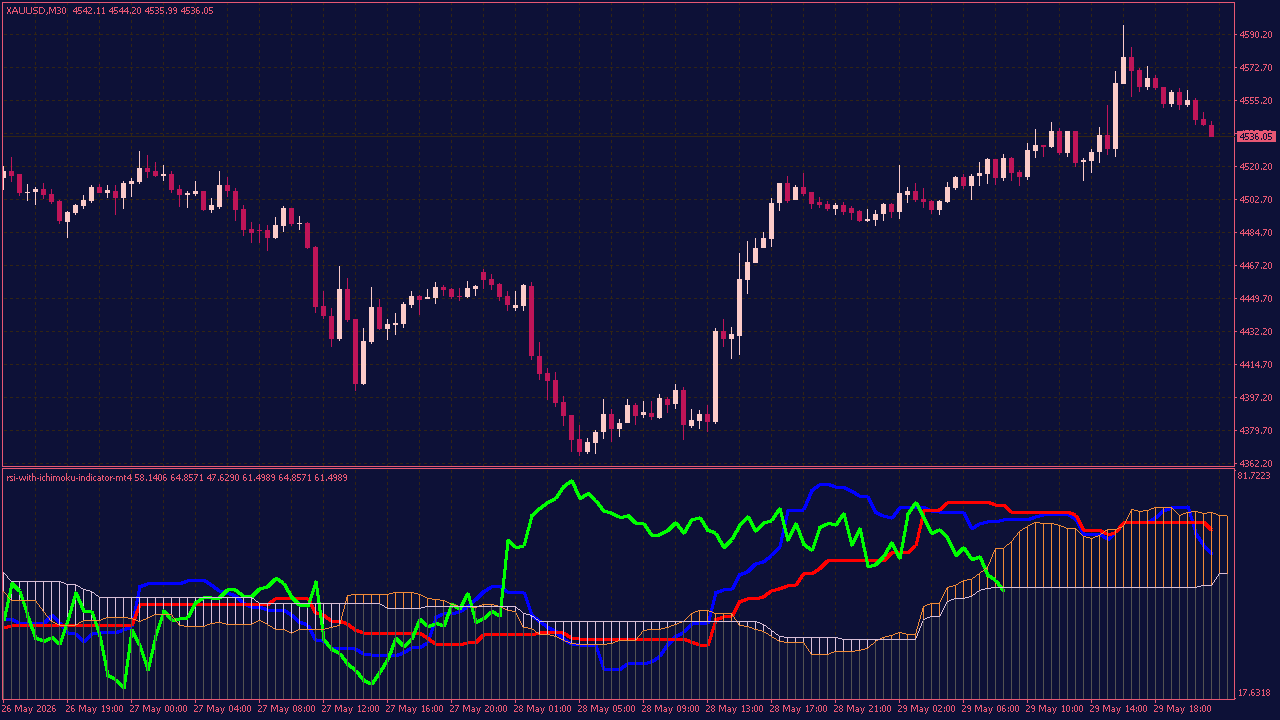
RSI with Ichimoku Indicator is an advanced technical analysis tool that combines the momentum insights of the Relative Strength Index with the trend-detection capabilities of the Ichimoku system in a dedicated lower chart panel. Designed to provide a complete market overview in a compact format, the indicator helps traders evaluate trend direction, momentum strength, and potential reversal zones without overcrowding the main price chart.
The integrated approach allows users to identify whether bullish or bearish momentum supports the current market trend, making it easier to filter weak signals and focus on high-probability trading opportunities. By bringing together two of the most popular technical indicators into a single window, traders can analyze market conditions more efficiently, improve timing for entries and exits, and maintain a clearer, more organized charting environment. Suitable for all experience levels and trading styles, the RSI with Ichimoku Indicator is a versatile tool for navigating dynamic market conditions with greater confidence.
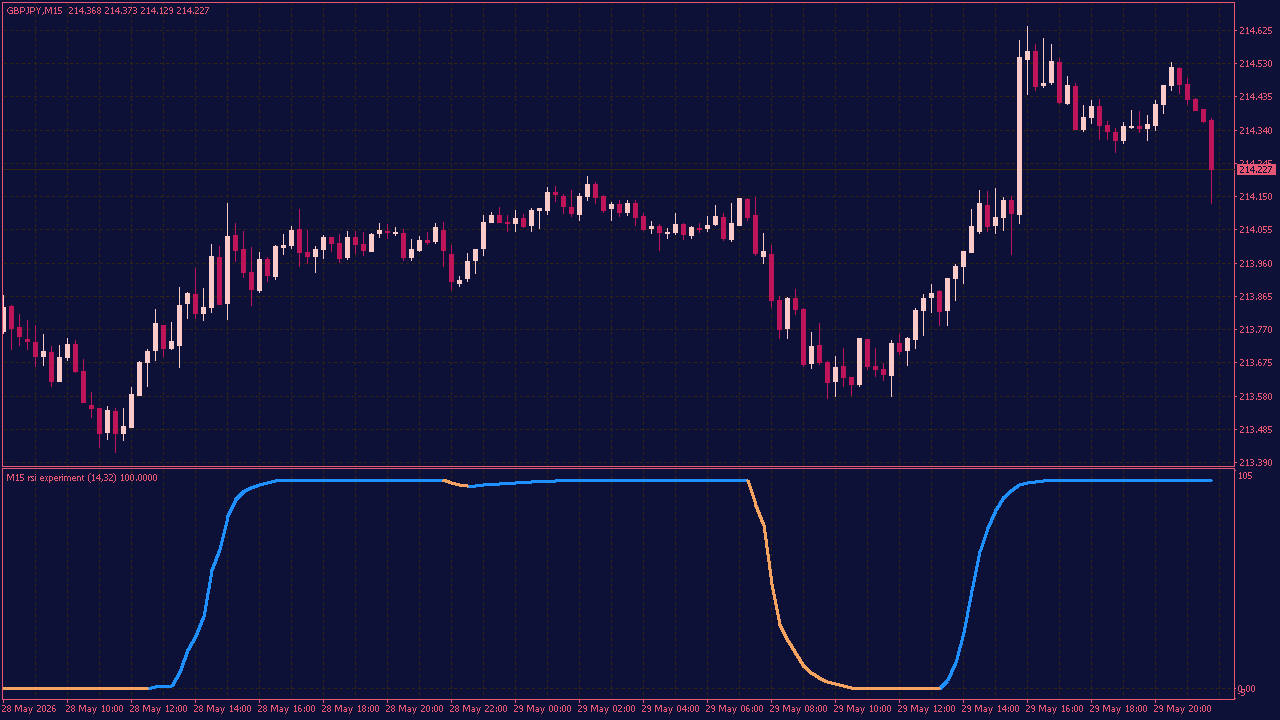
RSI Experiment Extended Indicator with Alerts is a customizable indicator designed to give traders more flexibility when working with RSI signals. It includes adjustable settings for timeframe, calculation period, price type, RSI calculation method, smoothing, and line width. The indicator also includes alert options, allowing traders to receive notifications when important RSI-based conditions appear. This makes it easier to monitor market momentum and potential signal changes without constantly watching the chart. It is suitable for traders who want a more advanced RSI tool with extra smoothing control, flexible inputs, and built-in alert functionality.
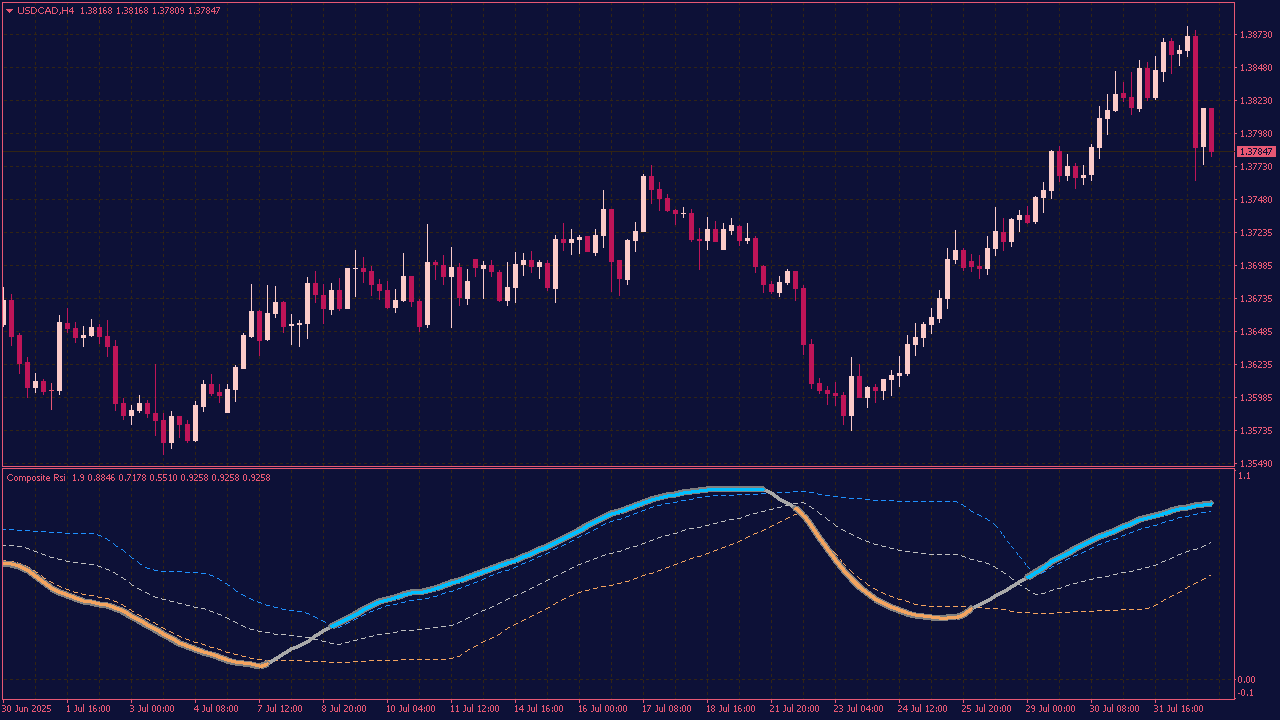
The Composite RSI with Floating Levels is a trend-focused RSI variant that filters out minor price fluctuations to better identify sustained market trends. Unlike traditional RSI, it features adaptive (floating) overbought/oversold levels that respond to market conditions, multiple price pre-filtering modes, built-in multi-timeframe support, and configurable alerts — all in a single-file indicator.
One More Average RSI Band MTF Indicator with Alerts
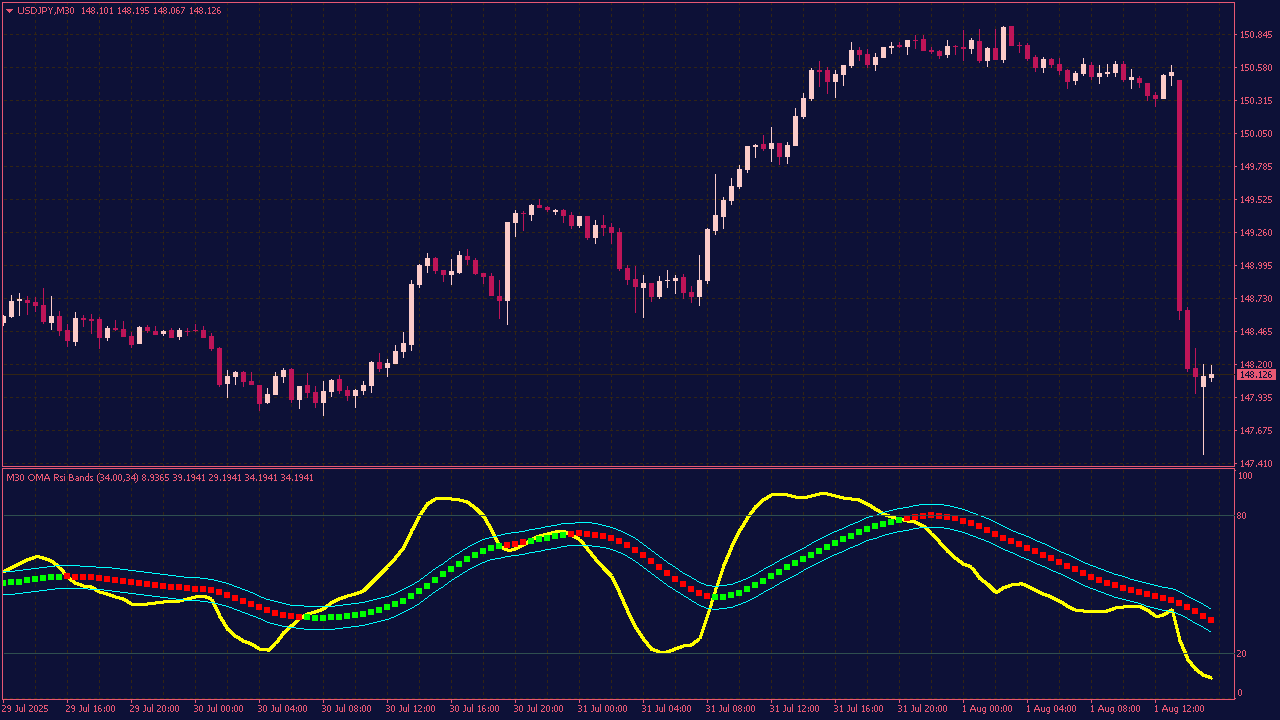
The One More Average RSI Band MTF Indicator with Alerts is a custom indicator that smooths RSI using One More Average (OMA) and displays dynamic upper and lower bands. It supports multi-timeframe (MTF) analysis and includes built-in alerts for RSI band crossovers or trend changes. This tool helps traders identify overbought/oversold conditions and momentum shifts with reduced noise and better signal timing across different timeframes.
The combination of RSI, DeMarker, and Fisher Indicator creates a robust technical analysis toolkit for identifying market conditions and potential reversals. The RSI measures momentum and overbought/oversold levels, the DeMarker assesses recent price extremes to spot potential trend changes, and the Fisher Indicator transforms price data into a normalized oscillator that highlights trend direction and strength. Using these three indicators together provides a comprehensive view of market dynamics: RSI indicates momentum, DeMarker signals potential exhaustion points, and Fisher offers a clear visualization of trend shifts. Traders often look for aligning signals (such as an RSI overbought condition combined with a Fisher reversal and a DeMarker divergence) to make more confident trading decisions, whether entering or exiting trades.
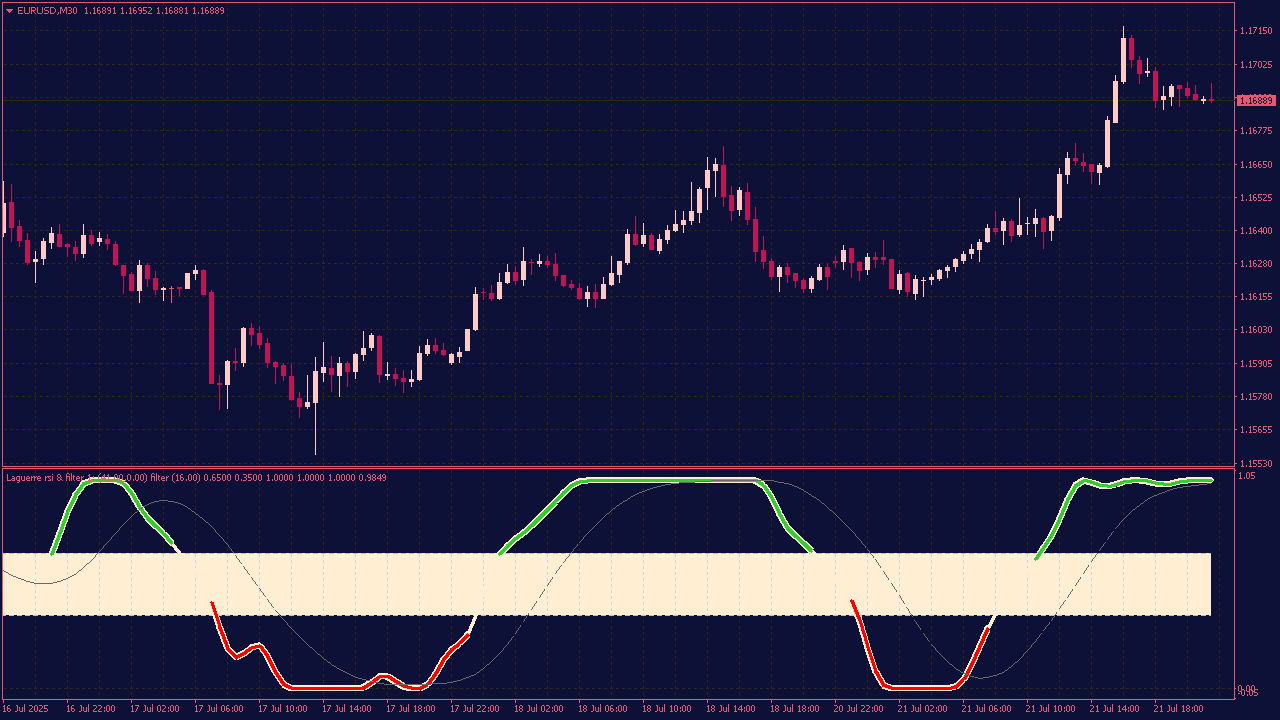
The Laguerre RSI with Laguerre Filter is a technical indicator that combines the Laguerre RSI (a smoothed version of the Relative Strength Index) with a Laguerre Filter, which helps reduce noise and improve signal clarity. This combination is often used in algorithmic trading strategies or by traders who prefer smoother, more responsive signals.
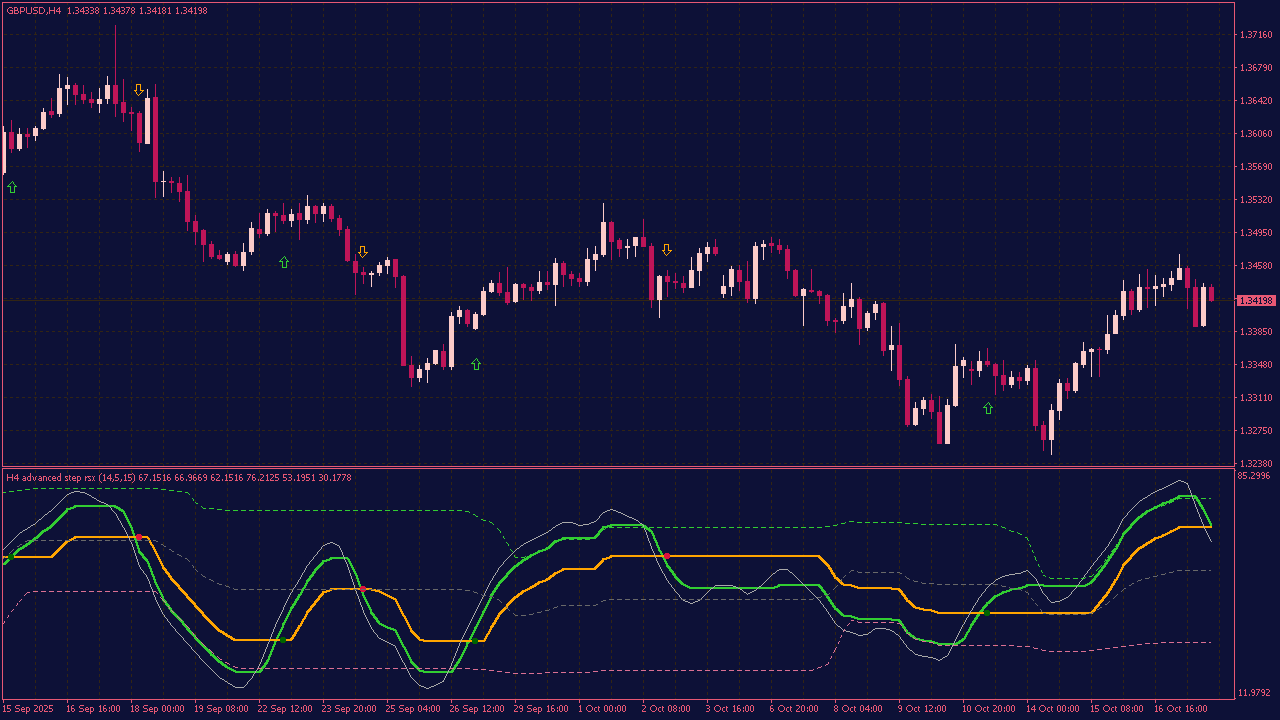
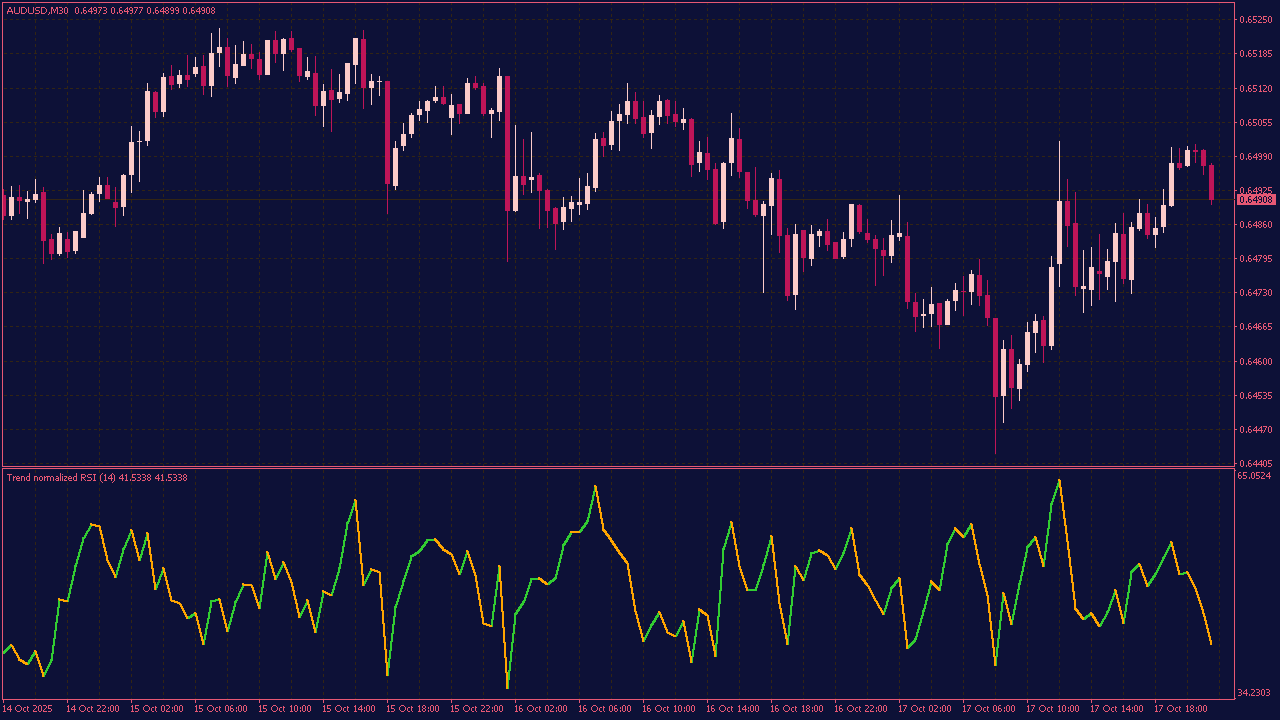
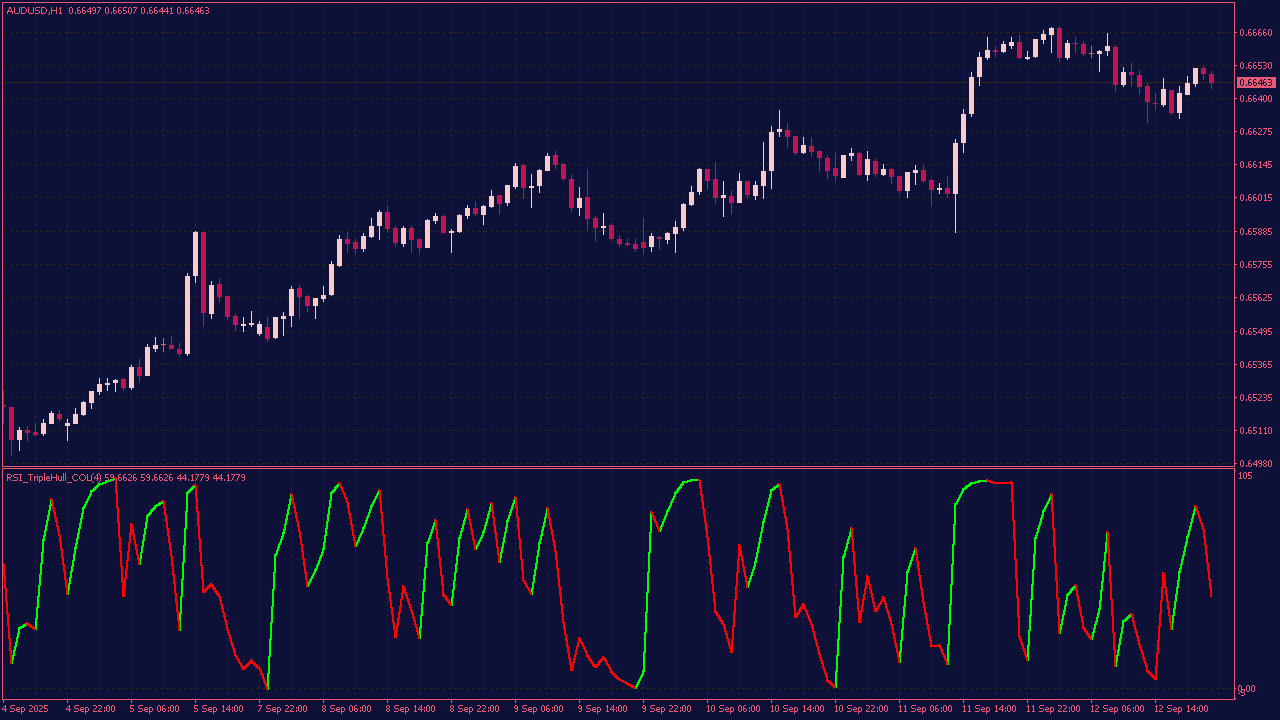
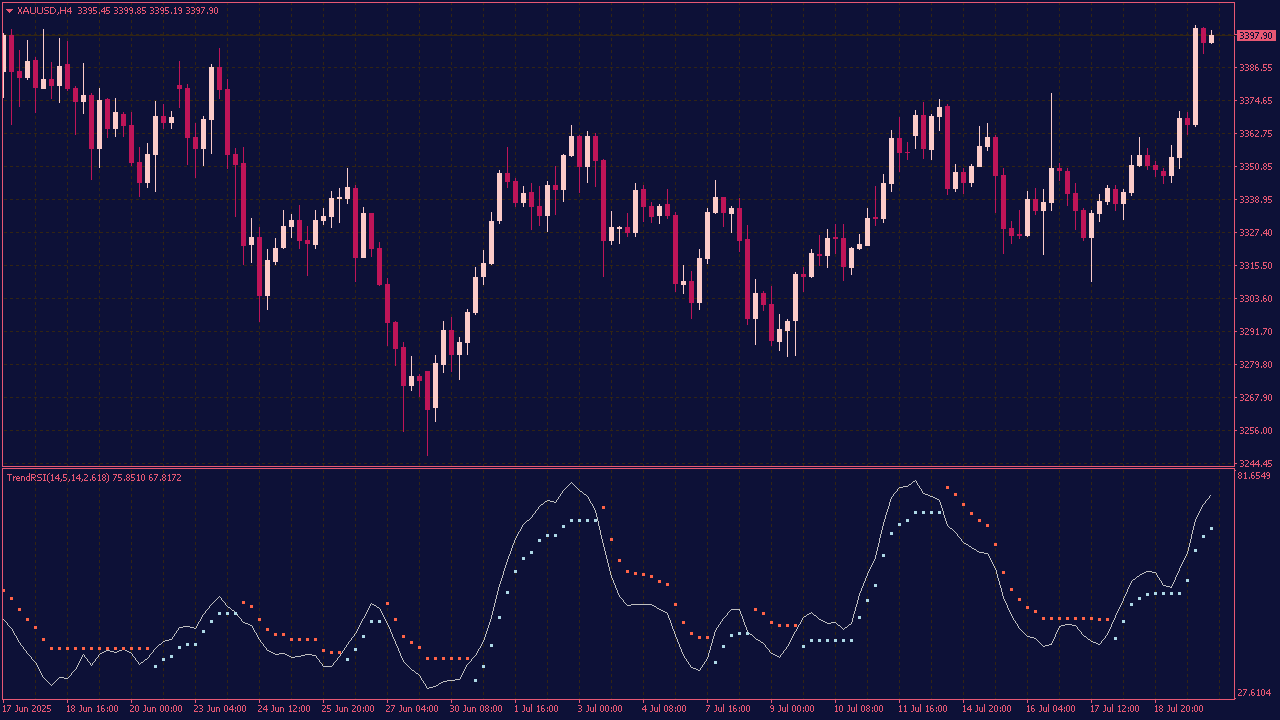
The Trend RSI Indicator is an enhanced version of the traditional RSI that combines momentum analysis with trend filtering. It smooths RSI values using moving averages (like EMA) to reduce noise and highlight the prevailing market trend, making it easier to identify sustained bullish or bearish conditions. This indicator helps traders avoid false signals and improve timing in trend-based strategies.
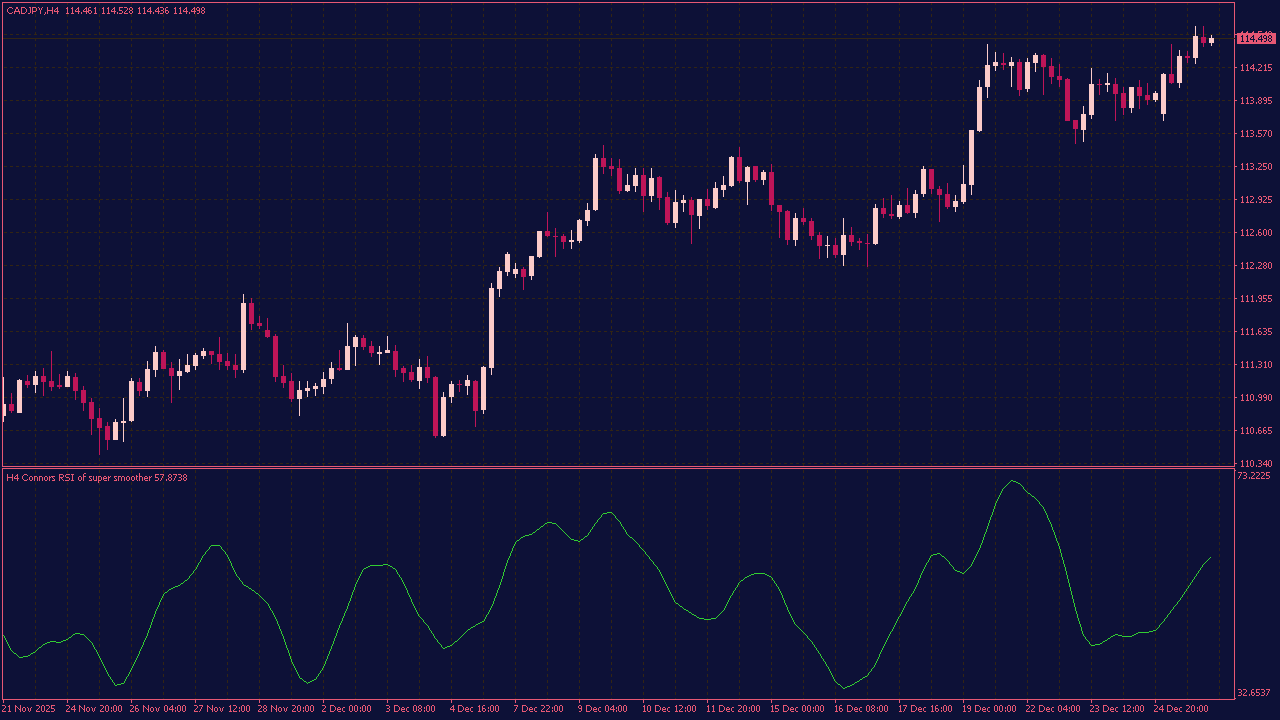
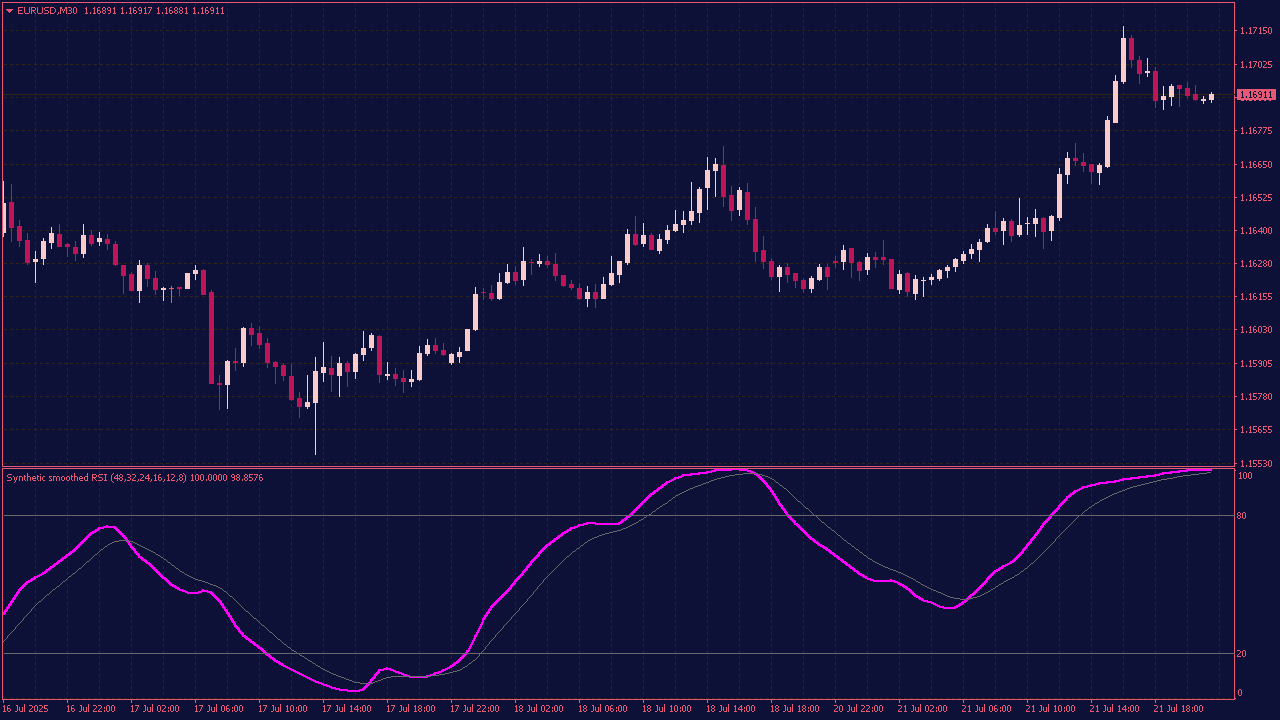
The Synthetic Smoothed RSI Indicator is a technical analysis tool that combines the traditional Relative Strength Index with smoothing techniques to reduce noise and provide clearer signals for traders. By applying methods such as moving averages or other smoothing algorithms to the RSI values, it helps identify overbought or oversold conditions more reliably and can signal potential trend reversals with reduced false positives. This enhanced indicator is particularly useful for traders seeking a more stable and accurate measure of momentum in various financial markets, including stocks, forex, and cryptocurrencies.
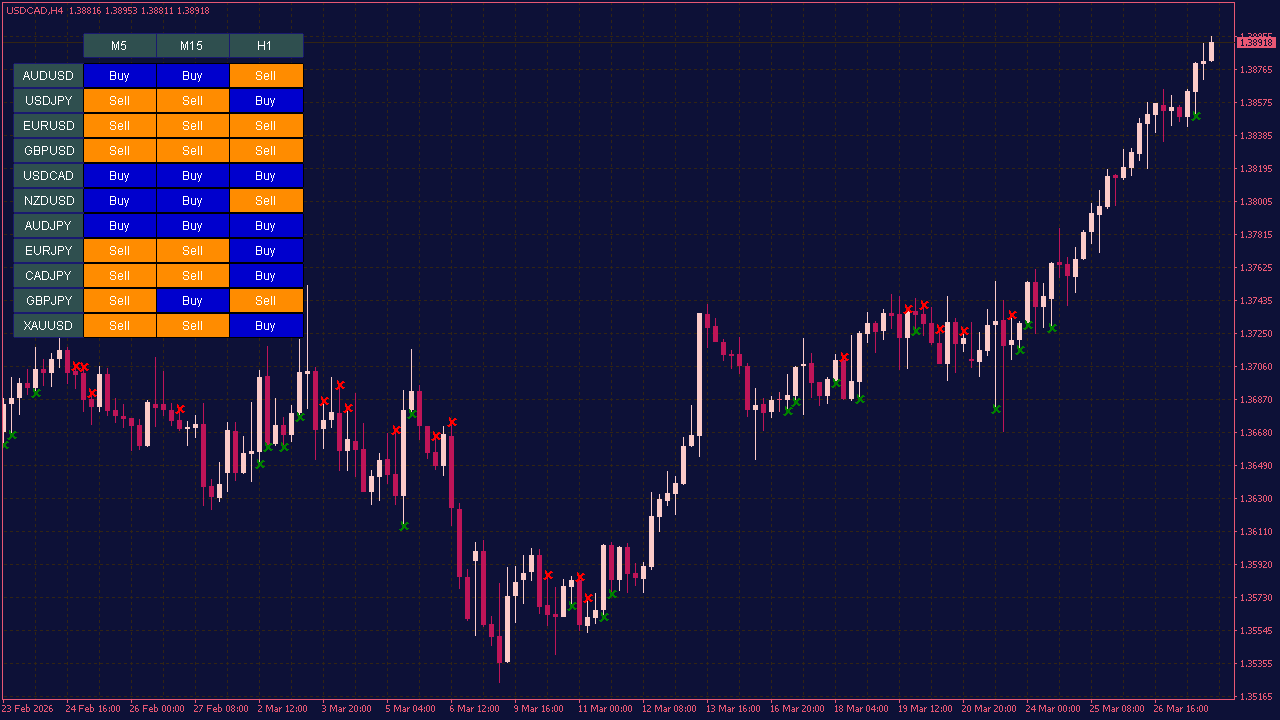
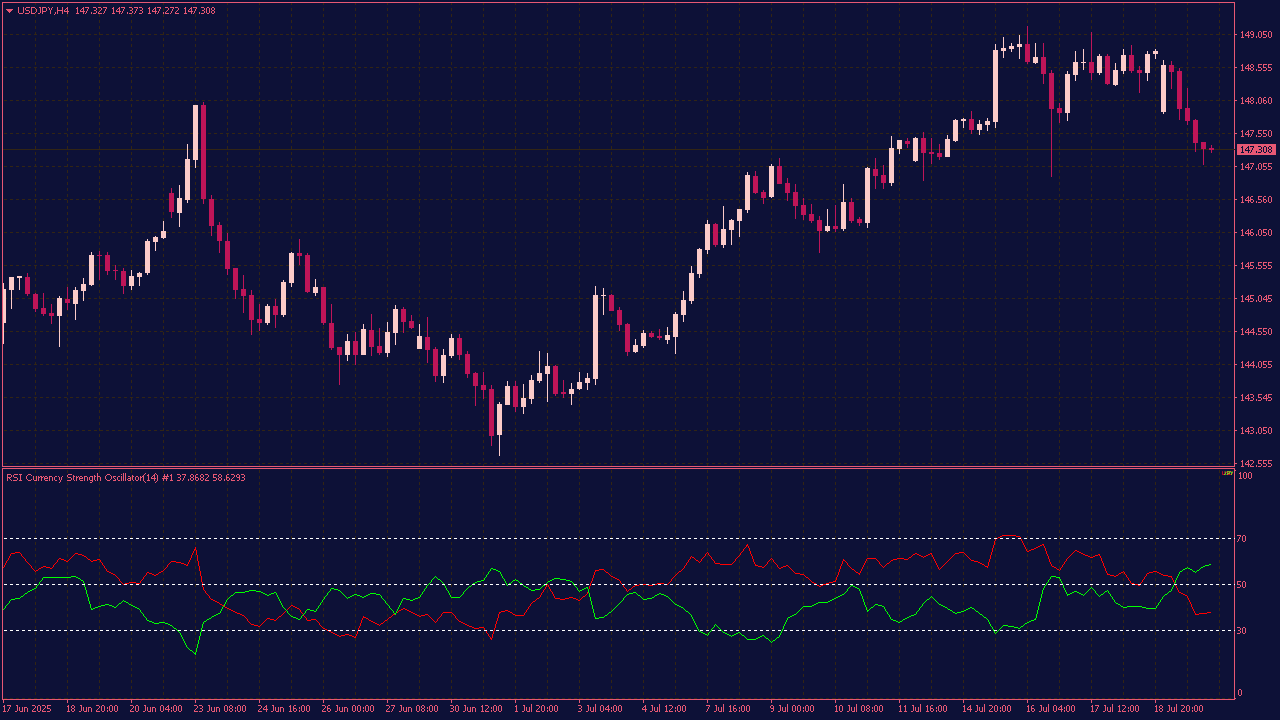
The RSI Currency Strength Oscillator is a technical tool that combines the Relative Strength Index with currency strength analysis to assess the momentum and relative performance of multiple currencies simultaneously. By evaluating individual currency pairs and calculating a strength or weakness metric, the oscillator helps traders identify which currencies are overbought or oversold, and how they are performing relative to each other. This combined approach enables more informed trading decisions, especially in forex markets, by highlighting potential trend reversals or continuations based on both momentum and relative strength dynamics.
The RSI Crossover Indicator with Alert is a trading tool that notifies traders when the RSI crosses predefined threshold levels, typically indicating overbought or oversold conditions, or when it crosses a key moving average or signal line. This setup helps traders identify potential entry or exit points more efficiently by providing real-time alerts, reducing the need for constant monitoring. The crossover signals often suggest possible trend reversals or continuations, making this indicator particularly useful for timing trades and improving decision-making in various markets.
The RSI with High-Low ZigZag indicator combines the Relative Strength Index with a ZigZag overlay to identify significant price reversals and trend changes more clearly. The RSI measures momentum and overbought/oversold conditions, while the ZigZag plots points at significant price swings, filtering out minor fluctuations. When integrated, this setup helps traders visualize potential reversal points and trend shifts by highlighting RSI divergences or overbought/oversold levels alongside the ZigZag’s swing points, improving the accuracy of entry and exit signals in technical analysis.
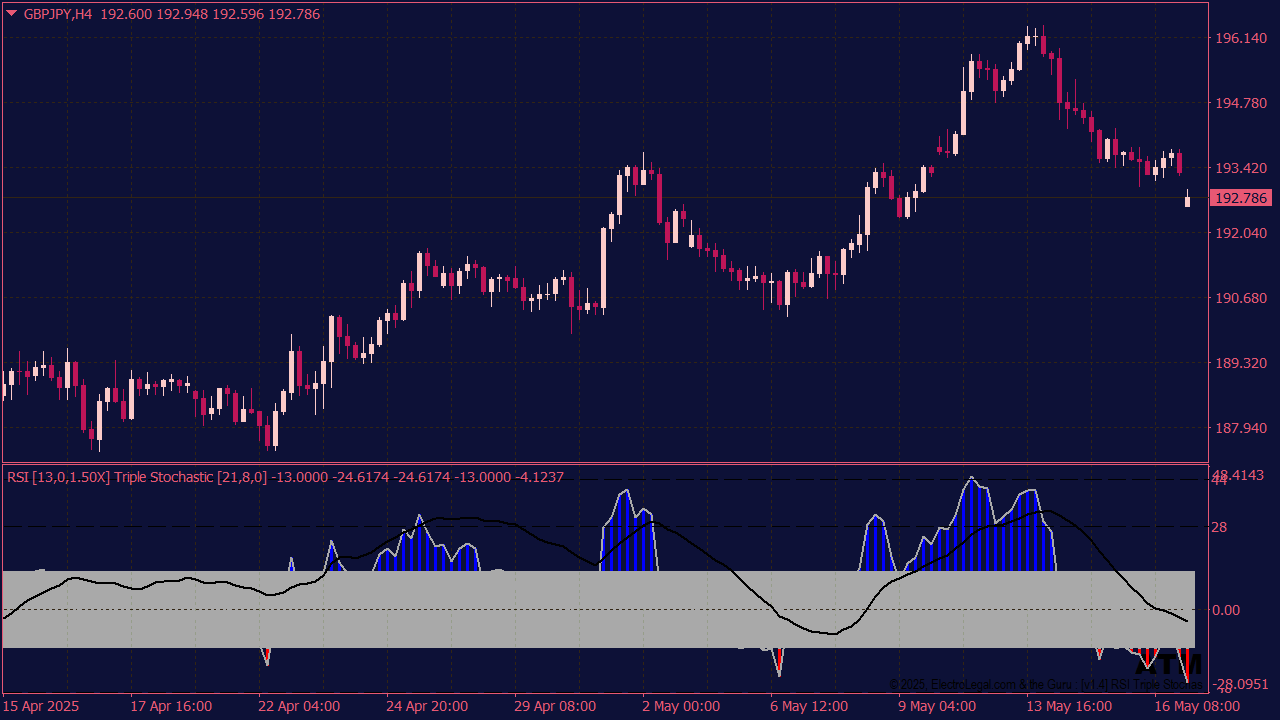
The RSI Triple Stochastic Divergence Indicator is a powerful momentum-based tool that combines the Relative Strength Index with three layers of Stochastic oscillators to detect hidden and regular divergences. By analyzing multiple Stochastic settings alongside RSI, the indicator offers more reliable divergence signals, helping traders spot potential trend reversals or continuations. It highlights divergence patterns directly on the chart and can provide alerts for timely trade decisions. Ideal for use in ranging or trending markets, across multiple timeframes.
The Waddah Attar Def RSI Indicator is a hybrid technical tool that combines the Relative Strength Index with the Waddah Attar Explosion indicator to identify potential trend reversals and price momentum. It helps traders spot overbought or oversold conditions (via RSI) while factoring in market volatility (via Waddah Attar), providing more reliable signals for buy and sell decisions based on both trend strength and price momentum.
The RSI Indicator with Bollinger Bands enhances the classic Relative Strength Index by adding Bollinger Bands around the RSI line. This combination helps traders identify volatility, overbought/oversold zones, and potential reversal points with greater precision. The Bollinger Bands dynamically expand and contract based on RSI volatility, offering better insight into momentum extremes and trend strength. Suitable for all timeframes and trading styles, this indicator can also include alerts for RSI band touches or breakouts.
The Adaptable Stoch RSI Indicator is a versatile technical analysis tool that combines the Relative Strength Index and the Stochastic Oscillator to provide more sensitive and customizable signals for overbought or oversold conditions in a market. It dynamically adjusts its parameters based on market conditions, allowing traders to fine-tune the sensitivity and responsiveness to better identify potential entry and exit points. This adaptability helps traders to better align their strategies with different asset classes and timeframes, enhancing the accuracy of trend identification and momentum analysis.
The Discontinued Signal Lines (DSL) RSI Indicator is an enhanced version of the traditional RSI that uses dynamic, adaptive signal lines instead of static overbought (70) and oversold (30) levels. This modification aims to reduce false signals and improve trading accuracy by adjusting thresholds based on market conditions, such as volatility and trend strength. The DSL RSI helps traders identify more reliable entry and exit points by providing more responsive and context-aware signals.
The Vertex RSI Indicator is a technical analysis tool that combines the principles of the Relative Strength Index with custom smoothing or enhancements to better identify overbought or oversold conditions in the market. It helps traders spot potential reversal points by measuring the speed and change of price movements, often offering clearer signals than a standard RSI by reducing noise and improving trend detection.
The RSI with TMA Channel Indicator is a technical analysis tool that overlays the Relative Strength Index with a Triangular Moving Average (TMA) channel, enhancing traditional RSI signals. The TMA channel provides dynamic upper and lower bounds, helping traders better identify overbought, oversold, and reversal zones based on market volatility. This combination offers smoother RSI readings and clearer visual cues for potential trend reversals, entries, or exits. It can be used on any timeframe and across various markets.
The RSI MTF (Multi-Time Frame) Indicator on candles is a powerful technical tool that displays the Relative Strength Index across multiple timeframes directly on candlestick charts, providing traders with a comprehensive view of momentum across different periods. By overlaying RSI readings from various timeframes onto the current chart, it helps traders identify consistent trend strength or divergence signals, improving decision-making for entries, exits, and trend confirmations. This multi-timeframe perspective allows for more nuanced analysis by highlighting whether short-term momentum aligns with longer-term trends, making it particularly useful for swing traders and those seeking confirmation across multiple time horizons.
The RSI NRP MTF Divergence with Alerts is a multi-timeframe indicator that identifies bullish and bearish divergences between price and the Relative Strength Index. It is NRP (Non-Repainting), ensuring that divergence signals remain after the candle closes. The indicator provides visual divergence lines on the chart and can trigger alerts when a divergence is detected, helping traders anticipate potential trend reversals.
The NonLag RSI NRP Indicator with Alerts is a technical analysis tool designed to provide a smoothed, less lagging version of the RSI, making it more responsive to recent price changes. The NonLag Relative Strength Index uses advanced smoothing techniques to reduce the delay typically associated with traditional RSI, offering clearer signals for potential trend reversals and momentum shifts. This version further enhances this by integrating customizable alerts that notify traders when the NonLag RSI crosses predefined levels (such as overbought or oversold zones), enabling timely trading decisions. This combination helps traders identify early signals of trend strength or weakness more accurately, reducing false signals and improving overall trading precision.
The RSI Averages with Bollinger Bands and Alerts is a technical indicator that smooths the RSI using a moving average, then applies Bollinger Bands to that smoothed RSI. It helps identify overbought and oversold conditions with added volatility context. Alerts are triggered when the smoothed RSI crosses above the upper band or below the lower band, signaling potential trend reversals or breakouts.
The Color RSI with Arrows and Alerts Indicator enhances traditional RSI analysis by visually displaying RSI levels with color coding (such as green for oversold and red for overbought conditions) making it easier to identify potential buy or sell signals at a glance. It also incorporates arrows that appear when RSI crosses predefined thresholds, signaling possible trend reversals, and includes alert features to notify traders instantly via sound or pop-up notifications when these critical levels are reached or crossed, thereby improving timely decision-making in trading strategies.
The Composite RSI is a modified version of the traditional Relative Strength Index, designed to focus more on identifying trends rather than just momentum. It filters out minor price fluctuations, smoothing the data to highlight the underlying market trend. This makes it especially useful for trend-following strategies, helping traders to capture longer-term moves while avoiding noise from short-term price action. The Composite RSI is generally less volatile and more reliable for confirming the strength and direction of a trend.
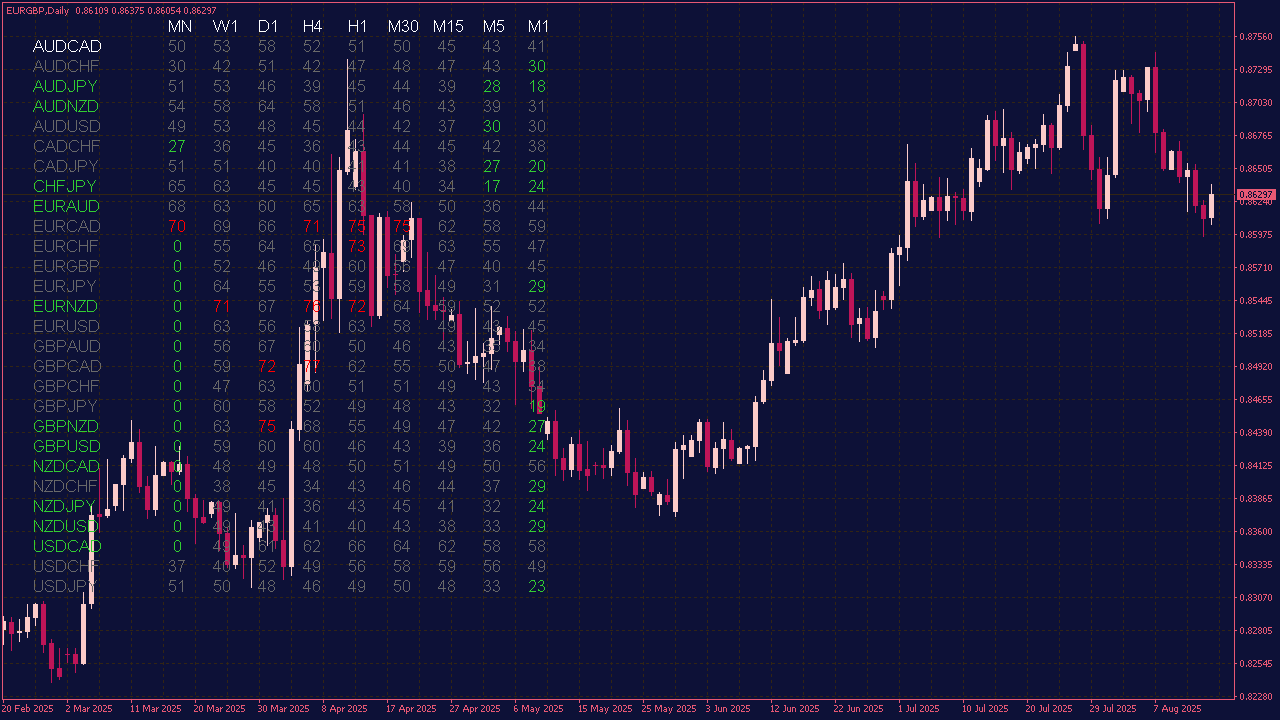
The RSI Heatmap Indicator visualizes the Relative Strength Index values of multiple assets or timeframes, allowing traders to quickly identify overbought or oversold conditions across a range of instruments. To use it, look for assets that are colored in the extreme zones (often red for overbought and green for oversold). This can signal potential reversal points or confirm trends. Additionally, combining the heatmap with other indicators can enhance trading decisions by providing a more comprehensive market analysis. Always remember to consider other factors and perform your own research before making trades.
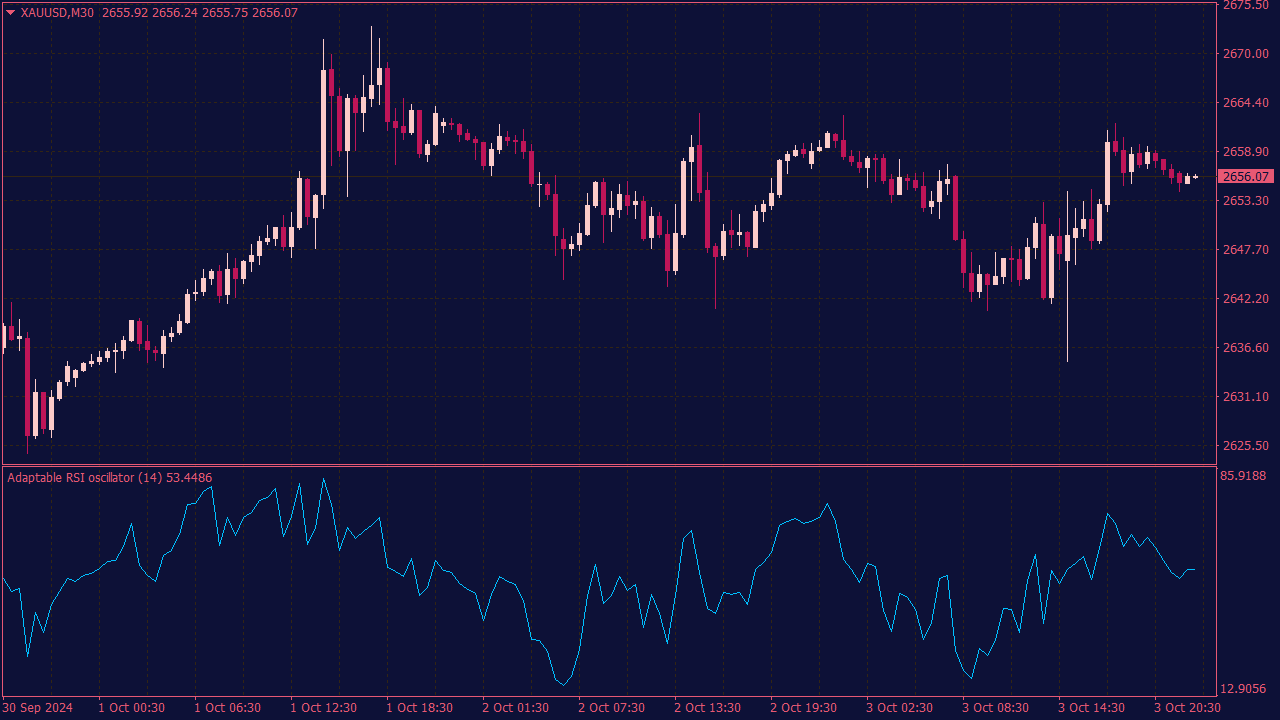
The Adaptable RSI is a variation of the traditional Relative Strength Index that adjusts its sensitivity based on market conditions. Unlike the standard RSI, which uses a fixed period (typically 14), the Adaptable RSI dynamically changes its period or smoothing factor depending on the volatility and price movement of the asset. This flexibility allows it to better capture trends and reduce false signals, making it more responsive in volatile markets while remaining reliable in stable conditions. It's ideal for traders looking for a more customized approach to momentum analysis.
📊 RSI: How to Read Momentum Without Falling for the Obvious
Most charts do not become dangerous because of the indicator. They become dangerous when traders trust the indicator more than price.
The Relative Strength Index, better known as RSI, is a perfect example. It looks simple, it is easy to add to a chart, and almost every trading platform includes it by default. That simplicity is exactly why so many traders misuse it.
The basic rule is familiar: RSI above 70 is overbought, RSI below 30 is oversold. For beginners, that sounds like a complete trading plan. Buy when the market looks oversold. Sell when it looks overbought. Wait for the line to do the work.
Live Forex markets are rarely that generous.
A currency pair can stay overbought while it keeps climbing. It can stay oversold while it continues to fall. In strong market conditions, RSI is not a reversal signal. It is closer to a pressure gauge. It shows whether momentum is expanding, fading, resetting, or starting to disagree with price.
That is where the real value begins.
Used without context, RSI often leads to early entries, emotional exits, and unnecessary losses. Used with context, it can help traders read momentum shifts, false breakouts, trend continuation, and exhaustion before they become obvious on price alone.
The indicator is not the edge.
The interpretation is.
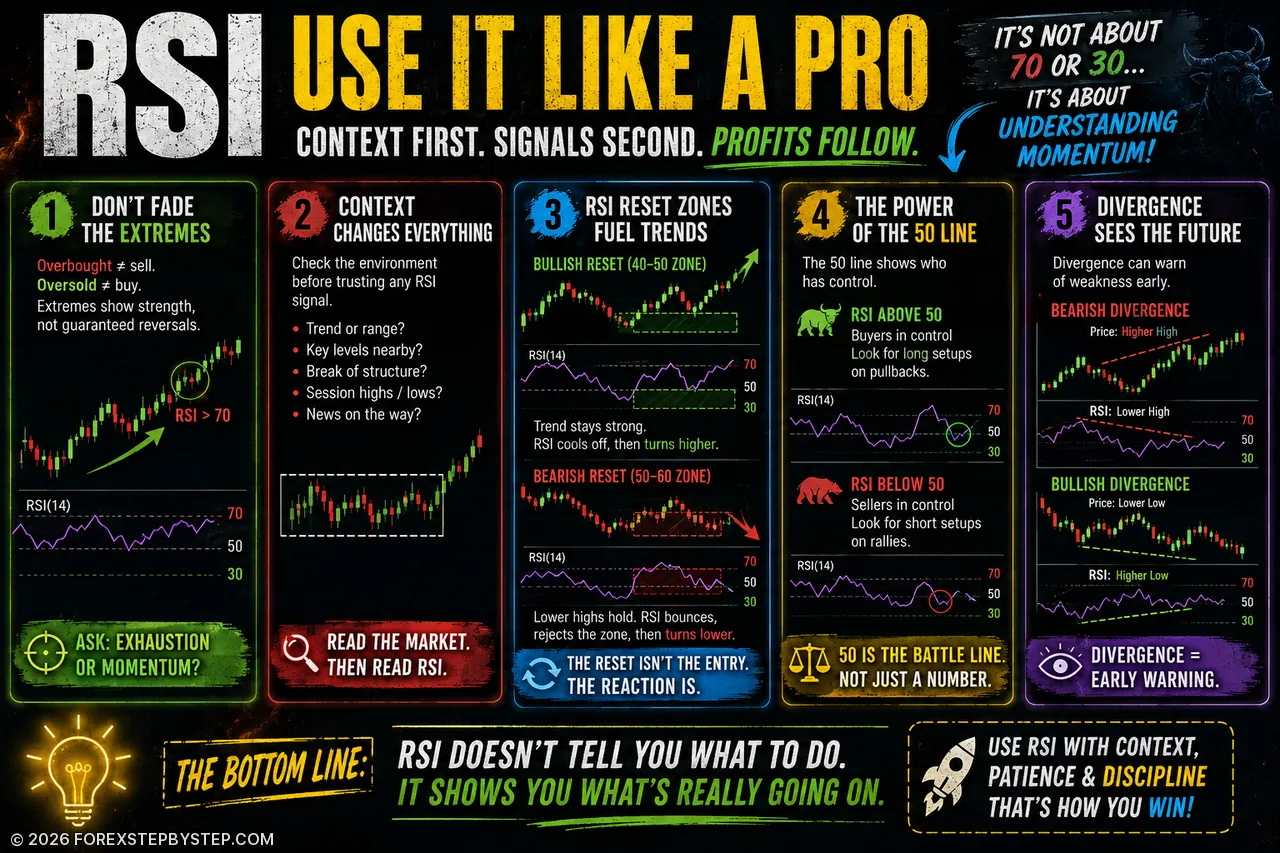
⚠️ The 70/30 Mistake Most Traders Make
The most common RSI mistake is also the most tempting one.
A trader sees RSI above 70 and immediately wants to sell. Another sees RSI below 30 and immediately wants to buy. The logic feels clean, but the market often punishes it.
Overbought does not mean price must fall. Oversold does not mean price must rise.
It only means the market has moved strongly in one direction.
That distinction matters.
In a slow, range-bound market, a move above 70 may warn that price is stretched. In a fresh bullish trend, however, the first RSI push above 70 can mean buyers have finally taken control. The same applies to a move below 30 in a bearish market. It may not be a discount. It may be the start of real downside pressure.
This is why traders often get caught fading strong moves too early. They treat RSI extremes as automatic reversal signals instead of asking what kind of market they are actually trading.
A better question is:
Is this RSI extreme showing exhaustion, or is it confirming momentum?
That question changes the entire reading of the indicator.
🧭 Context Comes Before the Signal
An RSI number means very little on its own.
A reading of 72 can be dangerous to sell in a strong uptrend. A reading of 28 can be dangerous to buy in a strong downtrend. A reading near 50 can be meaningless in a choppy market, but important during a momentum shift.
Before using any RSI signal, traders should define the environment:
Is the pair trending or ranging?
Is price near a major support or resistance level?
Has the market recently broken structure?
Is the signal forming near a session high, daily low, or weekly level?
Is there a major economic release ahead?
Without that context, RSI becomes just another line moving below the chart.
With context, it becomes a useful way to judge whether price movement is healthy or vulnerable.
The goal is not to react to RSI. The goal is to understand what RSI is saying about price.
🚀 When Overbought Means Strength, Not Weakness
One of the least intuitive RSI lessons is this: the first overbought reading in a new bullish move is often not bearish.
Imagine EUR/USD has been moving sideways for two sessions. The Asian range is tight, volatility is low, and most traders are waiting. London opens, price breaks above the previous day’s high, and RSI pushes through 70 for the first time in days.
A beginner sees overbought conditions.
A stronger read is that momentum has expanded.
That does not mean traders should chase the breakout blindly. It simply means that selling only because RSI is above 70 may be the wrong reaction. The first strong RSI push often confirms that the market has changed character.
The better opportunity may come later.
After the initial impulse, watch the pullback. If price holds above the breakout area and RSI cools toward the 40–50 zone without collapsing, the market may be preparing for continuation.
This is where RSI becomes useful: not at the emotional high of the move, but during the pause that follows it.
🔄 The RSI Reset Zone
In trending markets, RSI often resets without reaching traditional overbought or oversold levels. Many traders miss this because they are waiting for a perfect 70 or 30 reading that never arrives.
In a strong uptrend, RSI may not fall back to 30. It may only pull into the 40–50 area before turning higher again. In a strong downtrend, RSI may not climb back to 70. It may only recover toward 50–60 before sellers return.
These areas can act as reset zones.
📈 Bullish Reset
A bullish reset happens when price remains structurally strong while RSI cools off. The market takes a breath, but the trend does not break.
Price is making higher highs and higher lows.
RSI pulls back toward the 40–50 zone.
Price holds above a previous swing low or key support area.
RSI turns back above 50.
Price confirms with a break of minor resistance or a strong continuation candle.
The setup becomes more meaningful when the RSI reset happens at a logical price level, not randomly in the middle of the chart.
📉 Bearish Reset
A bearish reset works the other way. Price remains below key resistance, RSI recovers toward the middle zone, and then fails.
1. Price is making lower highs and lower lows. 2. RSI recovers toward the 50–60 zone. 3. Price rejects a previous resistance area or lower high. 4. RSI turns lower again. 5. Price confirms with a break of minor support or renewed bearish pressure.
The reset itself is not the trade. The reaction after the reset is what matters.
⚔️ Why the RSI 50 Line Deserves More Attention
Most traders watch 70 and 30. Experienced traders also pay close attention to 50.
The 50 level is not dramatic, but it often shows where momentum changes hands. Above 50, buyers usually have more control. Below 50, sellers usually have the advantage.
A clean bullish shift often starts with RSI reclaiming 50 after a pullback. If price is also breaking a minor resistance level or forming a higher low, the signal becomes more meaningful.
A bearish shift often appears when RSI tries to recover above 50 but fails. If price is rejecting resistance at the same time, the rally may be corrective rather than impulsive.
This is especially useful on the 1-hour, 4-hour, and daily charts, where the 50 line can help filter noise.
The 50 level will not catch every move. But it can help traders avoid fighting the side that currently has momentum.
🕵️ Hidden Divergence: The Continuation Signal Many Traders Overlook
Most traders know regular divergence.
Price makes a higher high while RSI makes a lower high. Or price makes a lower low while RSI makes a higher low. These signals can warn that momentum is weakening.
But in Forex, hidden divergence is often more practical.
Regular divergence looks for reversal. Hidden divergence looks for continuation.
📈 Bullish Hidden Divergence
A bullish hidden divergence forms when price makes a higher low, but RSI makes a lower low.
At first, this looks contradictory. RSI is weaker, but price structure remains bullish. In many cases, this means momentum has reset more deeply than price, while the trend itself remains intact.
This setup becomes more interesting when it appears after a pullback into support and price begins to turn higher again.
📉 Bearish Hidden Divergence
A bearish hidden divergence forms when price makes a lower high, but RSI makes a higher high.
Price is still structurally bearish, but RSI has reset upward. If sellers return at resistance, the next move may continue lower.
Hidden divergence is useful because it does not try to pick the exact top or bottom. It waits for the market to pull back, reset, and continue.
For many Forex traders, that is cleaner than constantly trying to call reversals.
💧 Liquidity Sweeps and RSI Disagreement
Forex markets often move beyond obvious highs and lows before reversing. These levels attract stop-losses, breakout orders, and emotional decisions.
That is why RSI becomes especially interesting around liquidity areas.
A bullish version usually follows this sequence:
Price breaks below a previous low.
Sellers enter the breakdown.
Stop-losses below the low are triggered.
RSI fails to make a new low.
Price quickly moves back above the broken level.
That is not a clean breakdown. It may be a failed move below liquidity.
The bearish version is the opposite:
Price breaks above a previous high.
Buyers chase the breakout.
Buy-stop orders and breakout entries are triggered.
RSI fails to confirm the new high.
Price drops back below the breakout level.
This type of setup is more meaningful around obvious levels:
Asian session highs and lows
Previous day highs and lows
Weekly highs and lows
Equal highs and equal lows
Major support and resistance zones
Random divergence in the middle of the chart is easy to ignore. Divergence after liquidity has been swept deserves more attention.
🌍 The London Open Fakeout
Forex has a rhythm, and the London session often brings that rhythm to life.
During the Asian session, many major pairs create a relatively narrow range. Liquidity is thinner, volatility is often lower, and obvious highs and lows begin to form. When London opens, price frequently attacks one side of that range.
Sometimes the breakout is real. Sometimes it is bait.
RSI can help traders read the difference.
📈 Bullish London Fakeout
The Asian session forms a clear low.
London opens and price breaks below that low.
Sellers enter the breakdown.
RSI does not confirm the weakness.
Price quickly reclaims the Asian low.
At this point, sellers who entered the breakdown may be trapped. The trade is not automatic, but the failed move becomes worth watching.
📉 Bearish London Fakeout
The Asian session forms a clear high.
London pushes above that high.
Buyers chase the breakout.
RSI fails to confirm the new high.
Price drops back inside the Asian range.
This is not a mechanical strategy. It needs structure, timing, and confirmation. But the idea is powerful because it combines three things Forex traders care about: session timing, liquidity, and momentum.
When those three align, the RSI signal becomes much more valuable.
🌋 RSI Compression Before a Bigger Move
Not every useful RSI signal looks exciting. Sometimes the best clue is compression.
When RSI moves sideways around 45–55, momentum is balanced. Buyers are not in full control, but sellers are not either. Many traders lose interest during this phase because the chart looks dull.
Quiet markets often prepare expansion.
If price is compressing below resistance and RSI starts pushing above 55–60, momentum may be building for a bullish breakout. If price is holding above support and RSI drops below 45–40, downside pressure may be increasing.
The mistake is entering too early while the market is still compressed.
Better traders wait for expansion.
RSI compression does not predict the direction by itself. It simply shows that the market is coiling. The breakout, if confirmed by price, tells the rest of the story.
🎯 Why the Second RSI Signal Is Often Cleaner
The first RSI signal often attracts impatient traders.
RSI becomes oversold. They buy immediately. Price bounces slightly, then makes one more low. Their stop-loss is hit. Only after that does the real reversal begin.
This pattern is common in Forex because the market often makes one final push to clear liquidity before turning.
That is why the second signal can be more useful:
RSI becomes oversold.
Price reacts but does not fully reverse.
Price makes one more low.
RSI makes a higher low.
Price breaks a minor resistance level.
The first signal only showed that selling pressure might be stretched. The second signal shows that sellers failed to create stronger momentum.
That extra information matters.
The same applies to bearish setups. Price may make one more high, RSI fails to confirm, and only after a break back below structure does the short idea become cleaner.
Do not treat the first RSI extreme as the trade. Treat it as the first clue.
📉 Drawing Trendlines on RSI
Most traders draw trendlines on price only.
RSI can also form trendlines, and sometimes those lines break before price structure does.
In a rising market, RSI may start making lower highs while price still pushes upward. That can show that bullish momentum is fading beneath the surface.
In a falling market, RSI may start making higher lows while price continues downward. That can suggest that sellers are losing pressure.
This does not mean RSI predicts the next move. It simply means momentum may be changing before price confirms it.
The safest approach is to use RSI trendline breaks as early warnings, not entry signals.
Let RSI alert you. Let price trigger you.
That small distinction prevents many premature trades.
🧩 The Three-Part RSI Framework
The strongest RSI setups usually include three elements: location, momentum, and trigger.
1. Location
Price should be near an important level, not floating in the middle of nowhere.
Support
Resistance
Previous high or previous low
Session extreme
Weekly level
Supply or demand area
2. Momentum
RSI should add useful information. It should not simply repeat what price already shows.
Divergence
Hidden divergence
50-line reclaim
50-line rejection
RSI compression
Trend reset
3. Trigger
Price needs to confirm the idea before the setup becomes actionable.
Break of structure
Failed breakout
Strong rejection candle
Retest of a key level
Close back inside a range
When all three are present, RSI becomes more than an indicator. It becomes part of a trading decision.
Without location, RSI signals are weak. Without momentum, price action is incomplete. Without a trigger, the trade is usually too early.
🚫 When RSI Is Best Ignored
Good RSI trading is not only about finding entries. It is also about knowing when the indicator does not deserve attention.
RSI is less useful when price is stuck in the middle of a messy range. It is less useful when the line is flat around 50 and there is no clear structure. It is also less useful just before major news, when price can move violently and ignore technical conditions.
RSI signals are usually weaker when:
Price is in the middle of a range
RSI is flat around 50
There is no clear support or resistance nearby
The higher timeframe has no clear direction
A major economic release is approaching
The setup offers poor risk-to-reward
Many traders lose money not because their setup is terrible, but because they force it in poor conditions.
No clear level. No clean momentum. No real trigger.
That is not a trading opportunity. That is noise.
The discipline to ignore weak RSI signals is part of the edge.
🛡️ Risk Comes Before the Indicator
No RSI setup is strong enough to ignore risk.
A perfect-looking divergence can fail. A clean 50-line reclaim can reverse. A London fakeout can become a real breakout. A reset zone can break.
That is normal.
Indicators do not remove uncertainty. They only help organize it.
Before entering any trade, traders should define:
The invalidation level
The stop-loss area
The target zone
The position size
The risk-to-reward ratio
The reason for entering the trade
Forex is especially unforgiving because leverage can make small mistakes expensive.
The RSI can help with timing. It cannot protect a trader from poor risk management.
🏁 Final Thought
RSI is often taught as a simple overbought and oversold indicator. That is why so many traders use it badly.
In real Forex trading, RSI is more useful as a momentum reader. It helps traders judge whether a move is strong, weak, stretched, fading, resetting, or quietly preparing for continuation.
The number matters less than the behaviour around it.
RSI above 70 is not automatically bearish. RSI below 30 is not automatically bullish. Divergence is not automatically a reversal. A reset is not automatically an entry.
The real question is always this:
Is momentum confirming the market structure, or is it exposing a weakness behind the move?
When traders start reading RSI that way, the indicator becomes far more useful.
Not because it predicts the future.
But because it helps them stop reacting blindly to the present.
📝 Editor’s Note
The strategies and market concepts discussed in our content are designed to help readers better understand market behavior. They are not trading recommendations. Financial markets are volatile, and every trader should test ideas carefully, manage risk and make independent decisions.