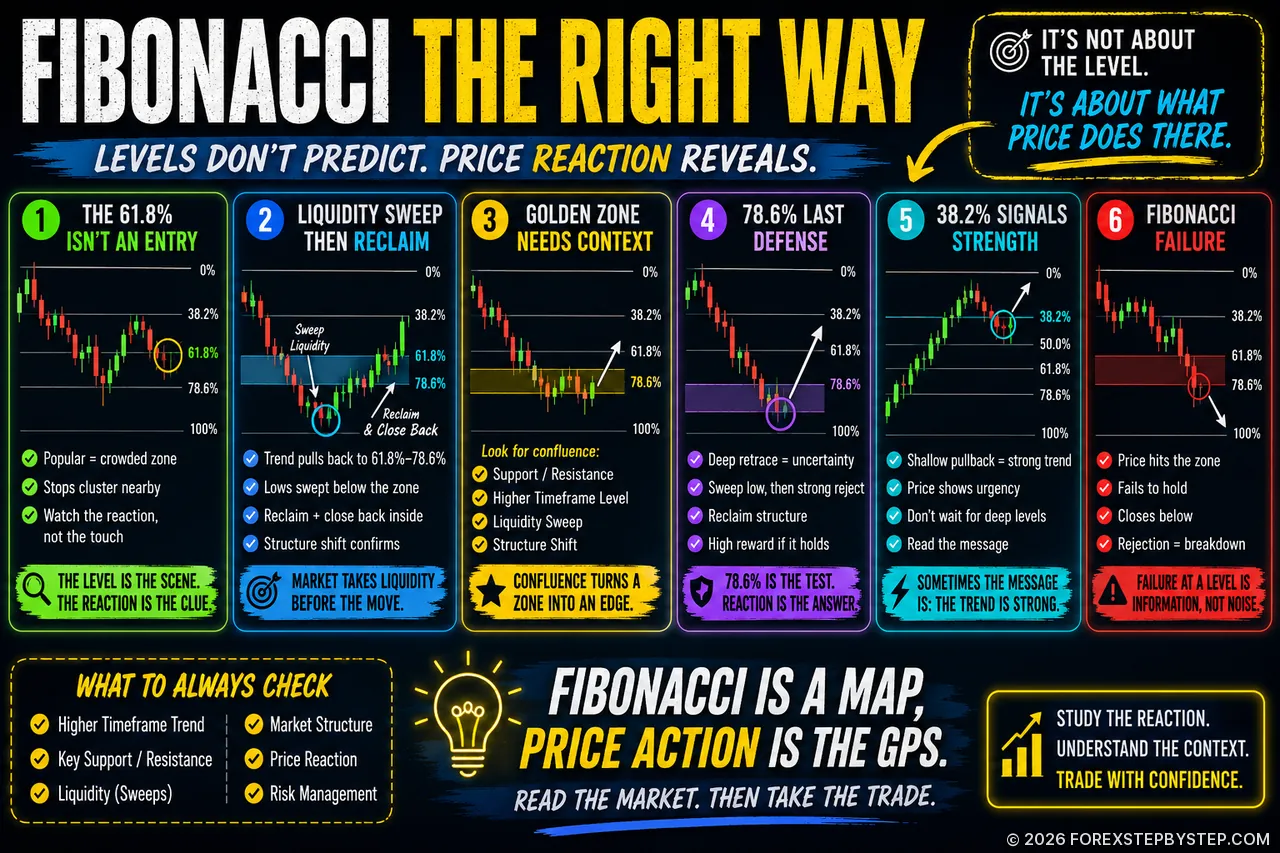
A Fibonacci level is only the starting point; the real question is what price reveals after it gets there.
🕵️♂️ The Fibonacci Trap Most Traders Never See
Most traders draw Fibonacci and immediately look for an entry. That is usually where the trouble starts.
The 61.8% level, the golden zone, and the perfect pullback can look convincing on a clean chart. But in live Forex markets, these areas are rarely simple. They are places where orders collect, stops become exposed, and price often tests who is early, late, or trapped.
This article looks at Fibonacci from a more practical trading angle. Not as a prediction tool, and not as a shortcut, but as a way to read what happens around pressure zones: the sweep, the rejection, the failed bounce, the reclaim, and the shift in structure.
Because the best setups often appear after the chart has already made most traders uncomfortable. The level tells you where to look. The reaction tells you whether there is a trade.
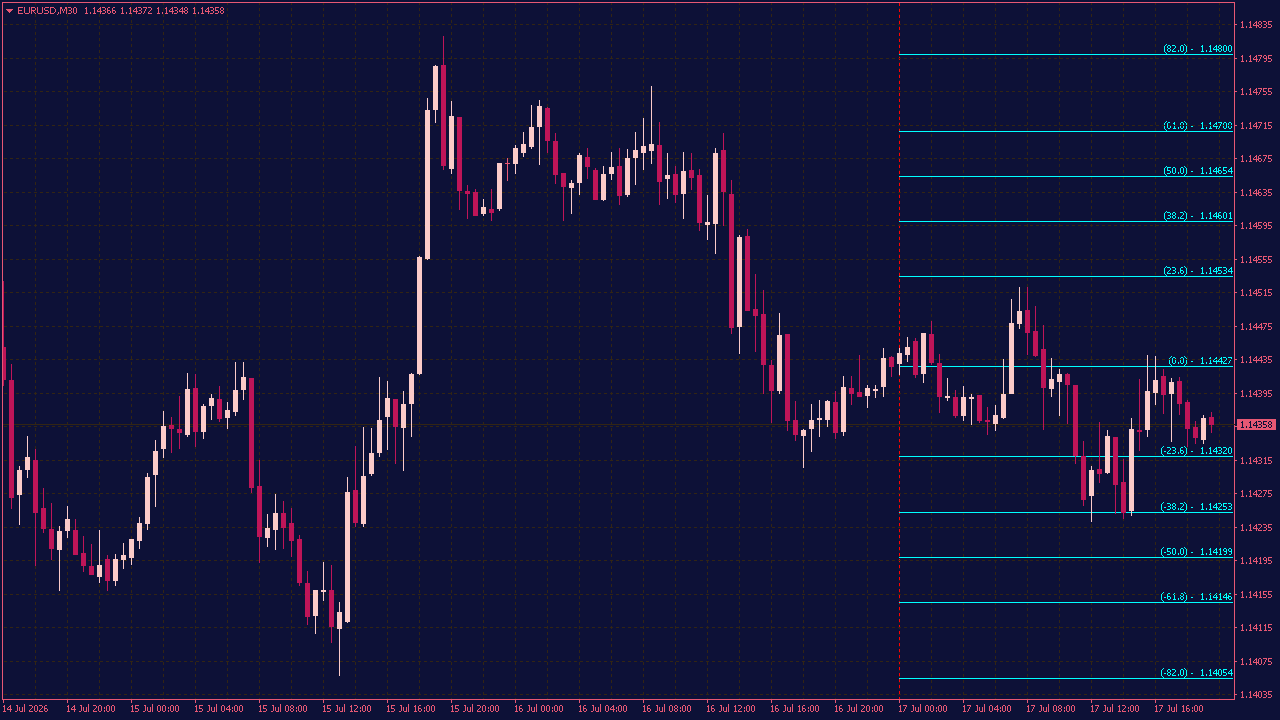
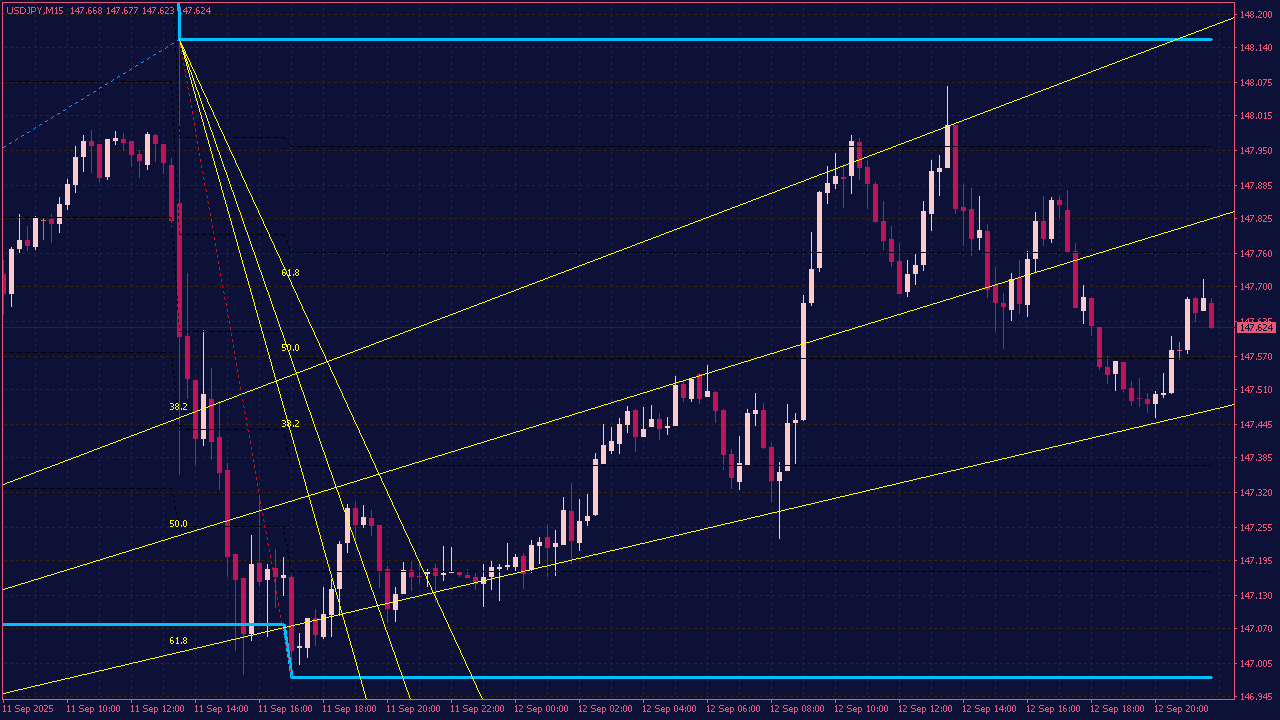
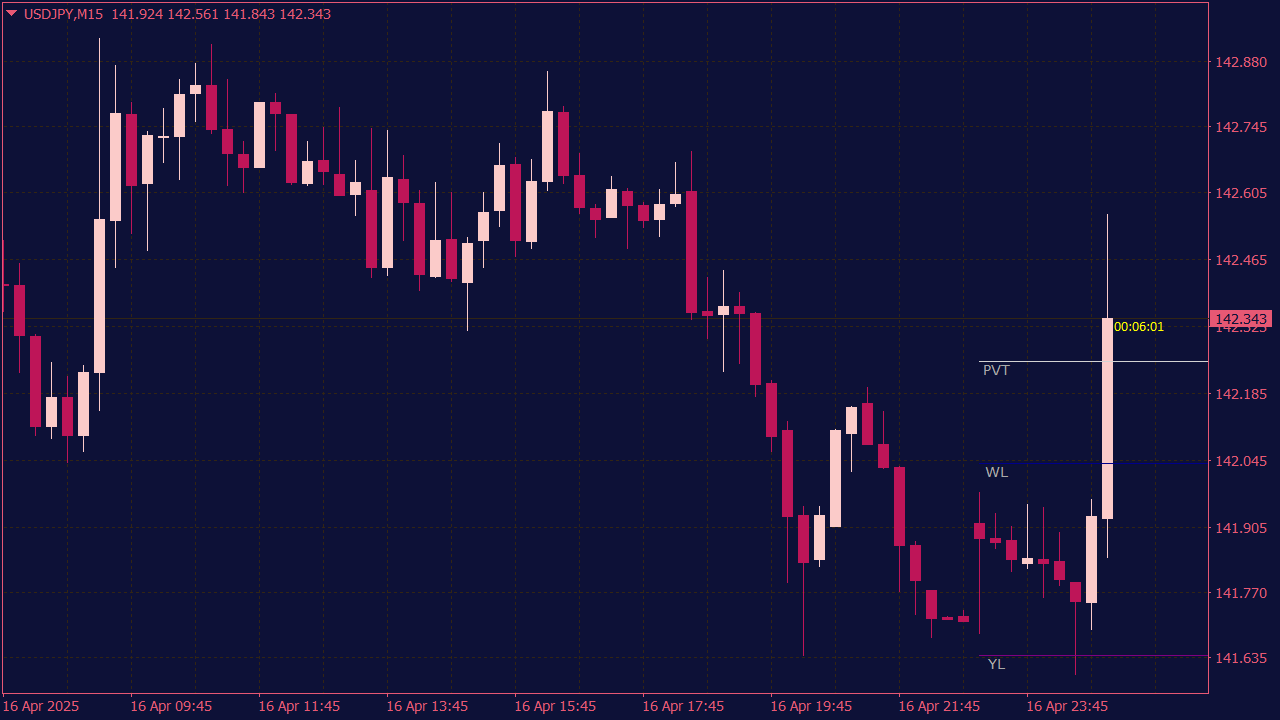
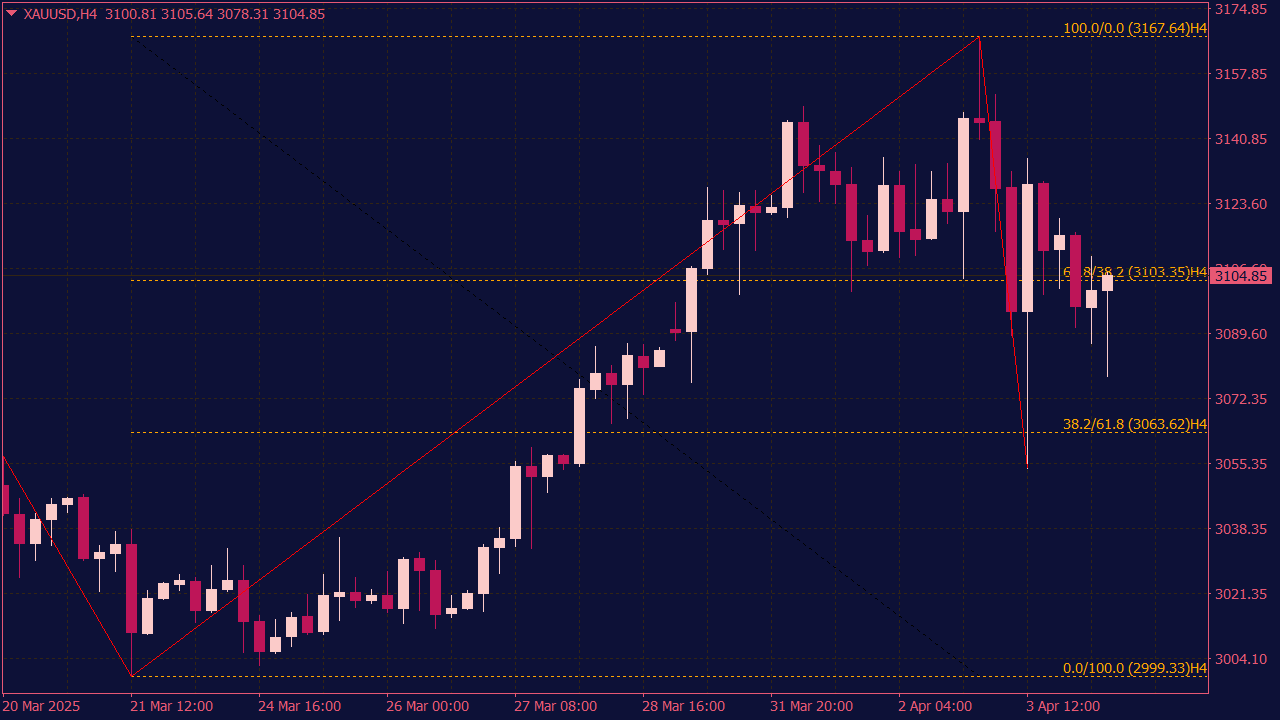
The Day Fibo Indicator takes yesterday’s high, low, and closing price and turns them into a practical set of Fibonacci levels. Everything is calculated automatically, so the chart is ready when the new trading day begins. The levels are not meant to predict every move. Instead, they give you reference points where price could slow down, bounce, break through, or build momentum toward the next zone. Sometimes price reacts exactly where you expect it to. Other times, it ignores the first level completely—and that is usually when the chart starts to get interesting.
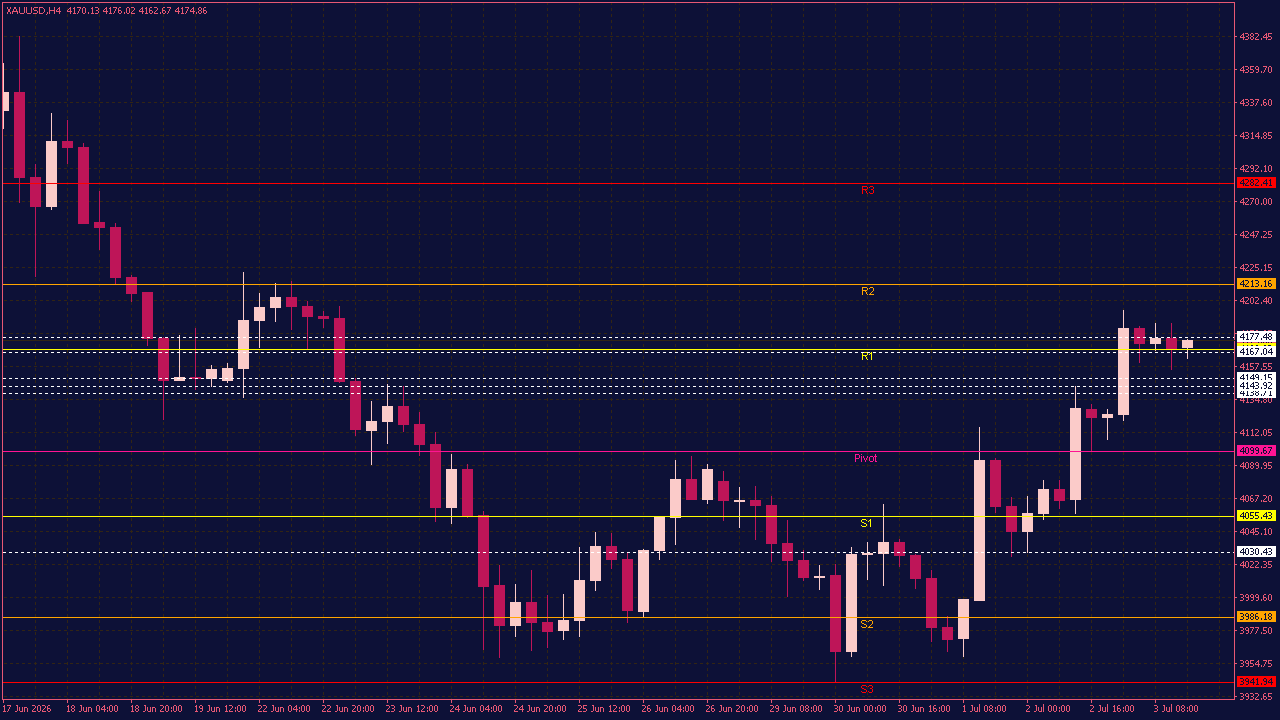
The Fibo Pivot and RSI indicator helps traders discover where the next market reaction could happen before it becomes obvious. By combining Fibonacci-based pivot levels with RSI signals, it highlights important areas where price may slow down, reverse, or continue its move. The tool displays key chart levels such as pivot points, support and resistance zones, Fibonacci levels, and previous highs and lows. These areas can help traders better understand where the market may react and where potential opportunities could appear. What makes it especially useful is the combination of price levels and momentum confirmation. When price reaches an important zone while RSI shows overbought or oversold conditions, traders get a clearer signal for possible buy or sell setups.
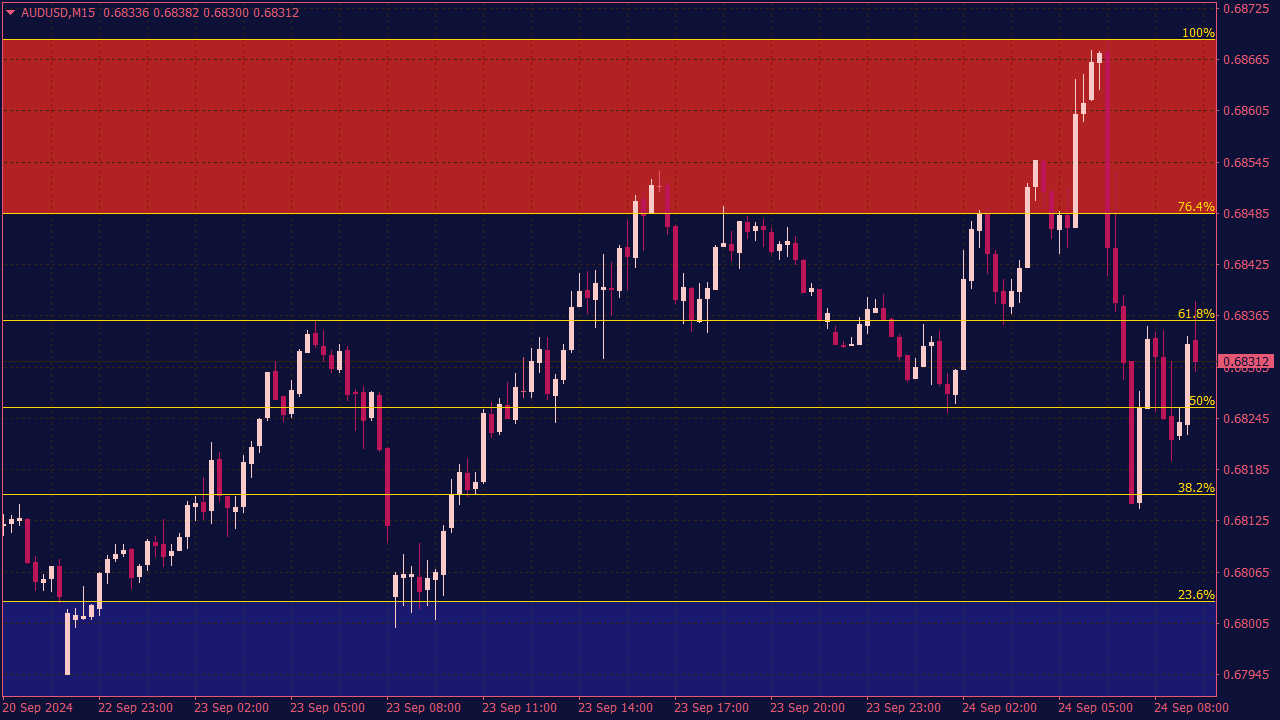
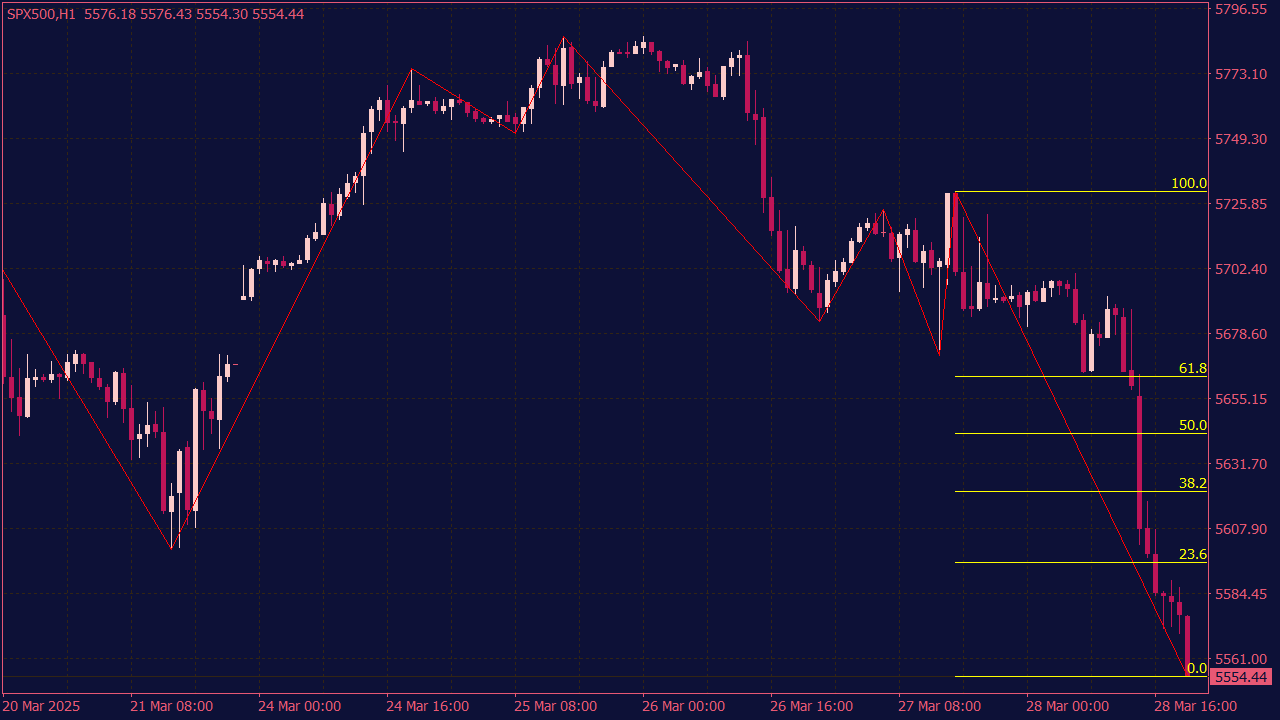
The Auto Fibo Trade Zones Indicator helps traders identify potential support and resistance levels based on Fibonacci retracement levels automatically plotted on the chart. To trade using this indicator, first select the desired timeframe and apply the indicator to your chart. Look for price action near the Fibonacci levels, specifically at key retracement levels (like 38.2%, 50%, and 61.8%) to identify potential reversal points. Traders often wait for confirmation through candlestick patterns or additional indicators before entering trades. Set stop-loss orders just outside the Fibonacci zone and target your risk-reward ratios based on the next Fibonacci level or established price action zones.
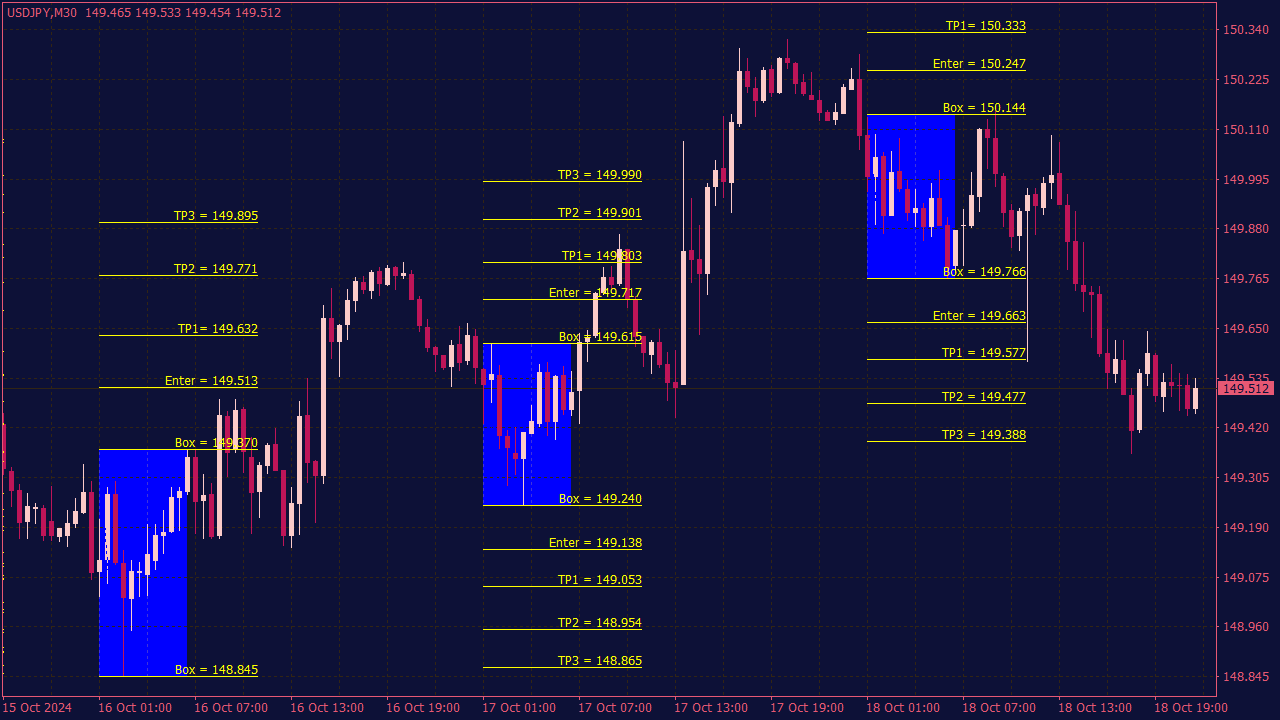
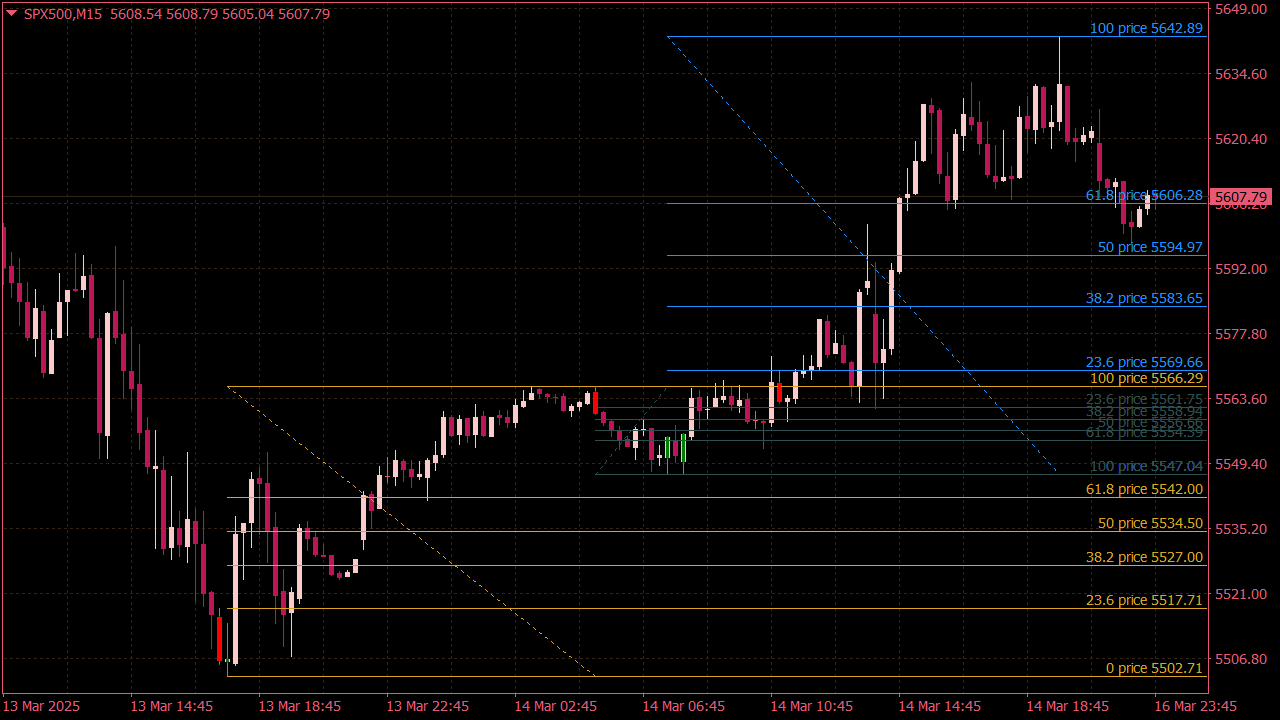
The Fibonacci Box Indicator is often used to identify potential breakout levels, stop loss, and take profit targets in trading. Traders typically draw Fibonacci retracement levels on price charts to establish critical support and resistance zones. A breakout above the Fibonacci box can signal a buying opportunity, with potential take profit levels set at key Fibonacci extensions (e.g., 1.618 or 2.618). Stop loss levels are generally placed below significant Fibonacci retracement levels to manage risk, ensuring that positions are protected in case of false breakouts. Always confirm breakouts with additional technical indicators or volume analysis for more reliable trading decisions.
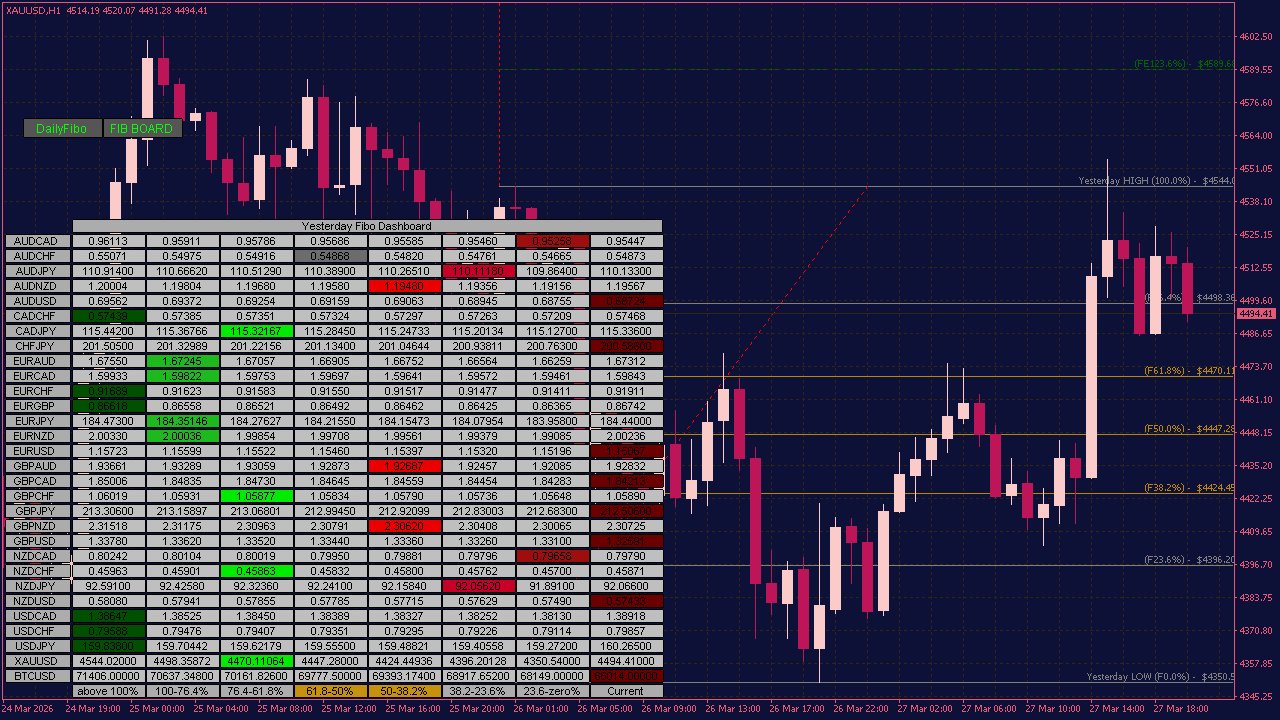
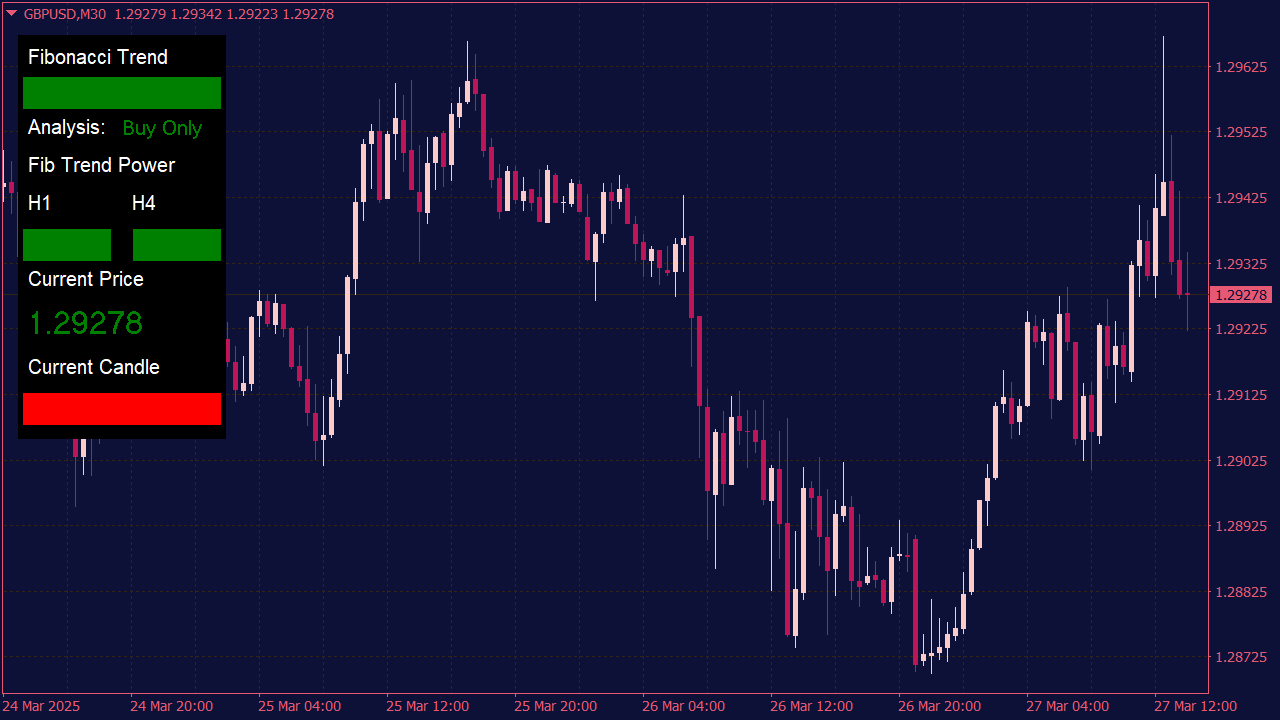
The Yesterday Fibonacci Dashboard is designed to help traders quickly assess market behavior based on the previous day’s range. When enabled, the Yesterday Fibonacci Dashboard monitors price action relative to yesterday’s high and low levels:
If price breaks above yesterday’s high, the Yesterday Fibonacci Dashboard highlights it in dark green, signaling a bullish breakout.
If price drops below yesterday’s low, it is marked in maroon, indicating a bearish breakout.
When price remains within yesterday’s range, the Yesterday Fibonacci Dashboard identifies the condition as a consolidation phase, helping traders avoid false breakout signals and recognize ranging market conditions.
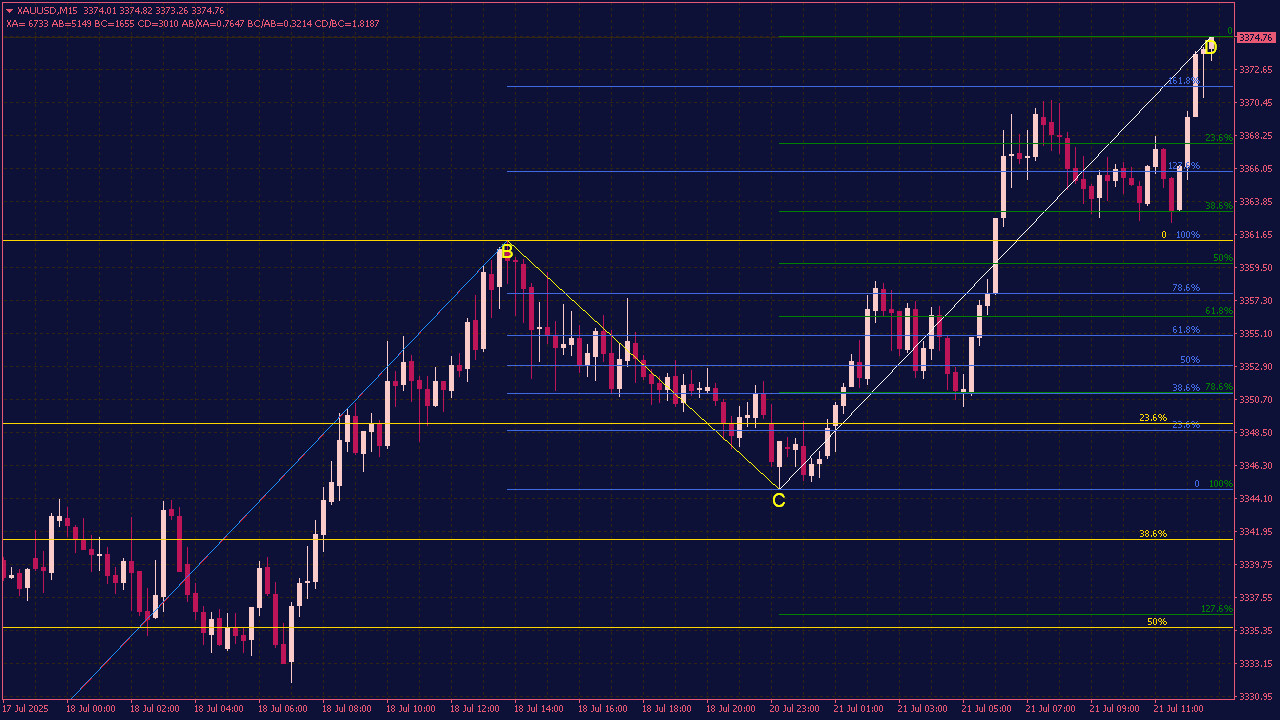
The Harmonic Patterns with Fibo Levels indicator detects advanced harmonic formations like Gartley, Bat, Butterfly, and Crab patterns, combining them with precise Fibonacci retracement and extension levels. It automatically plots patterns on the chart and highlights potential reversal zones, helping traders identify high-probability entry points based on price geometry and market symmetry.
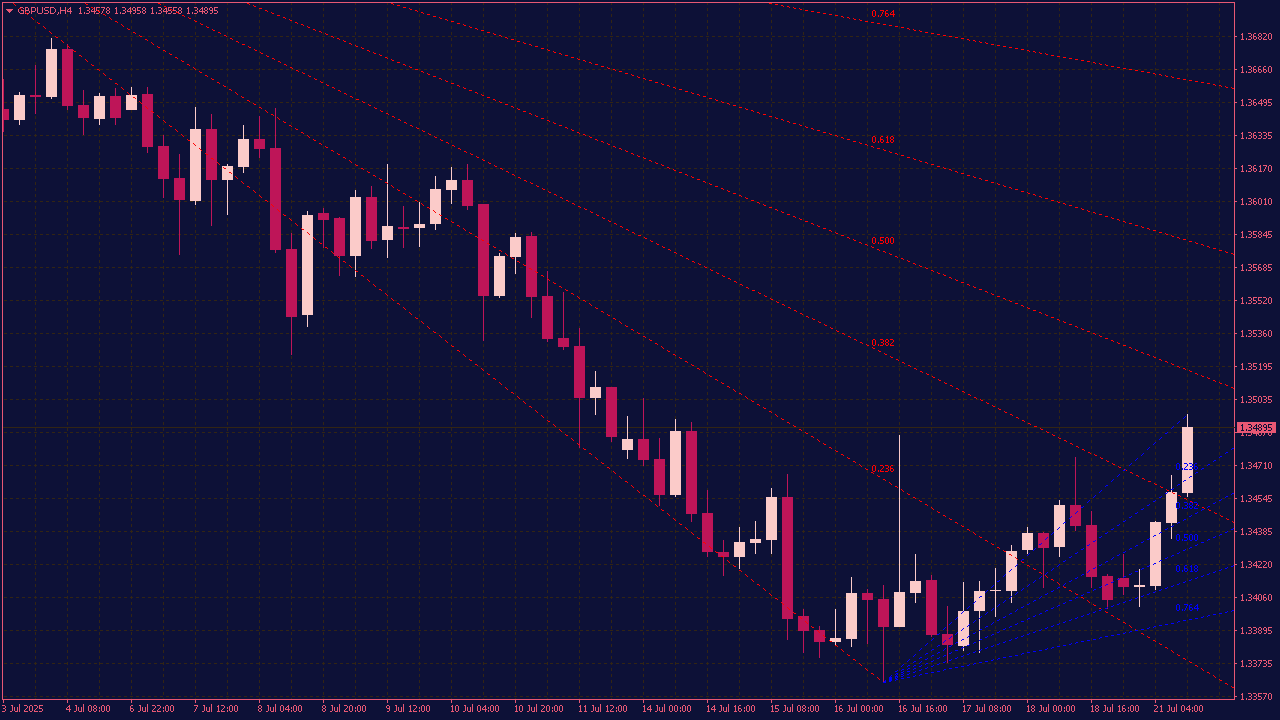
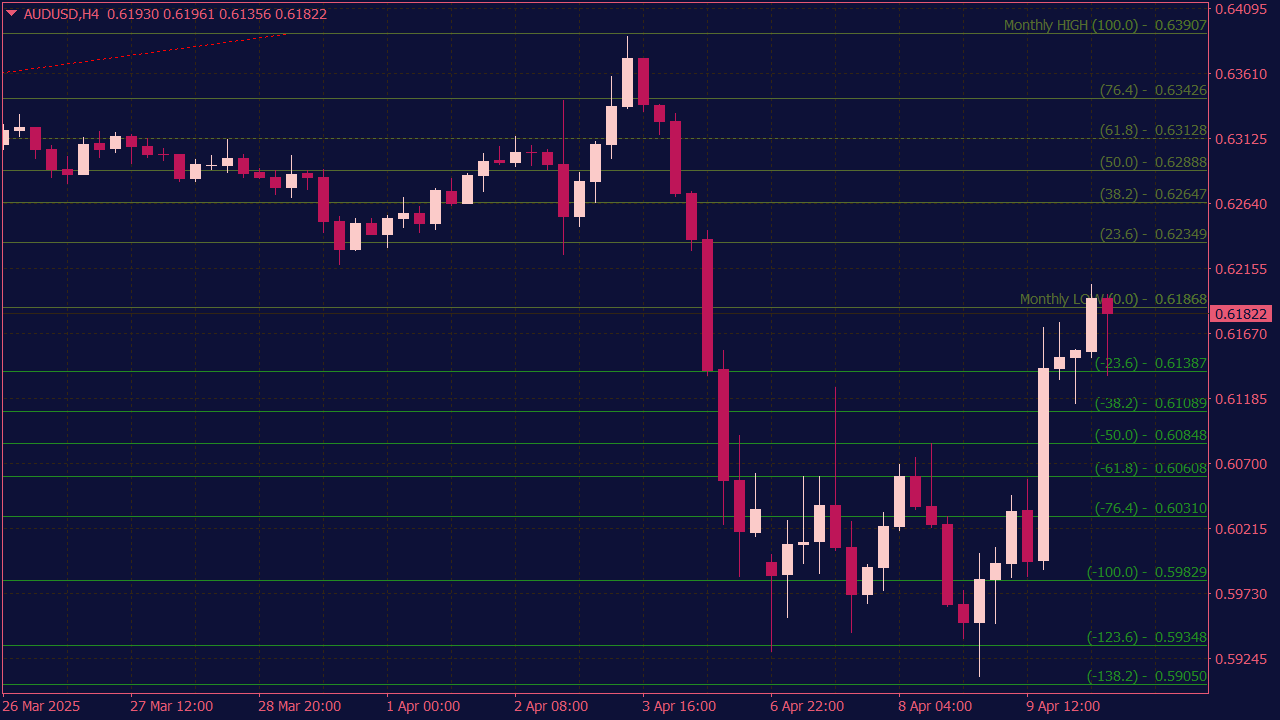
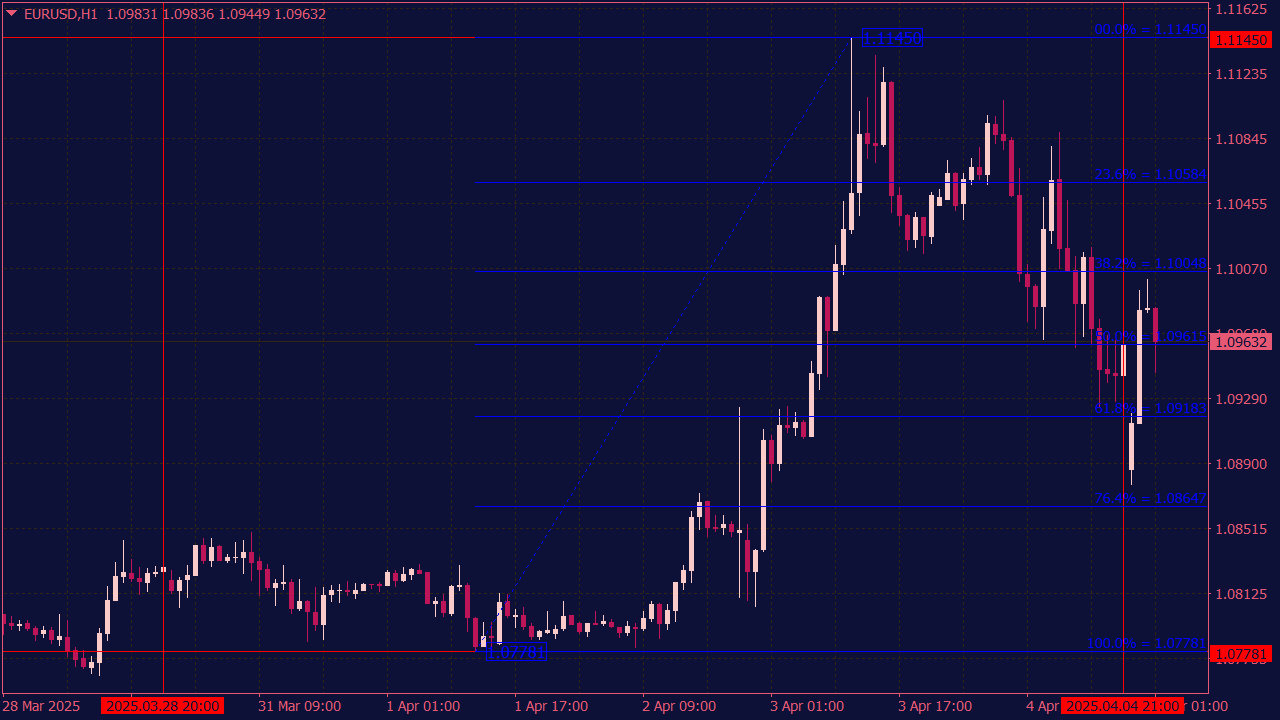
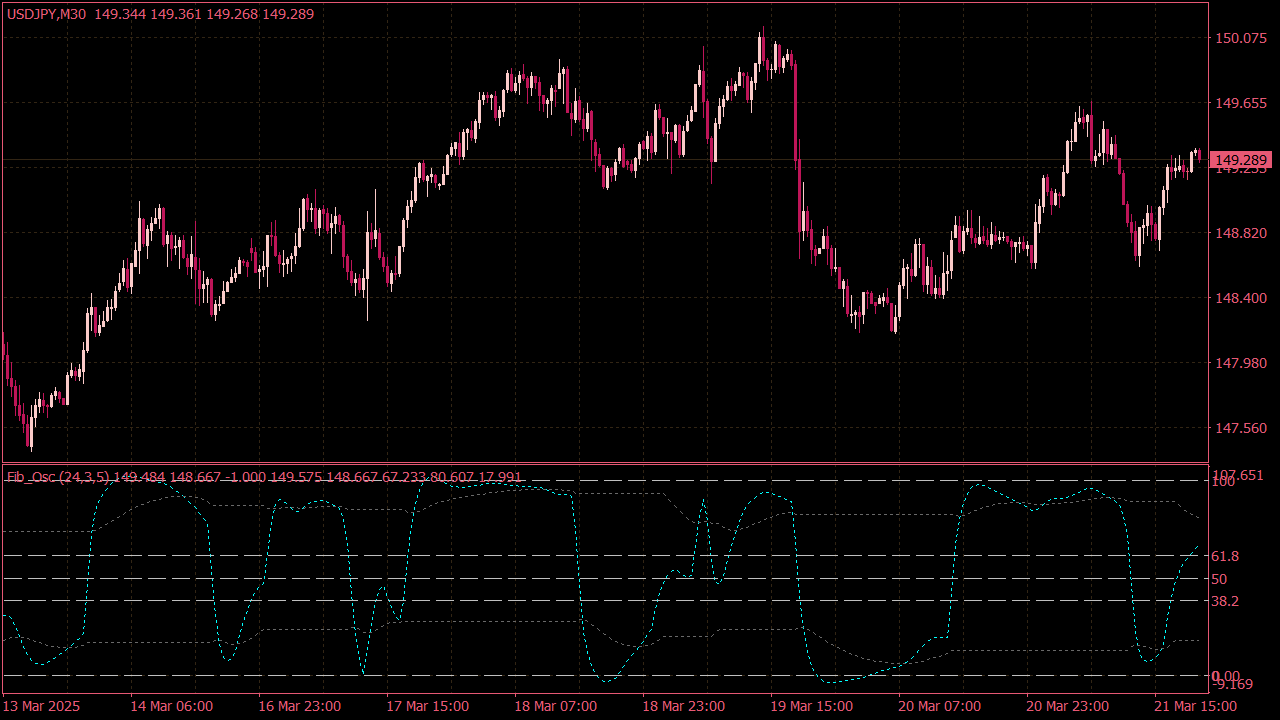
The Fibonacci Retracement Indicator is a technical analysis tool used by traders to identify potential support and resistance levels in the market. When a stock or asset is in an uptrend, traders may look for retracement levels (typically at 23.6%, 38.2%, 50%, 61.8%, and 78.6%) to find potential buy opportunities as the price pulls back. Conversely, in a downtrend, these levels can indicate potential sell points as the price approaches resistance. A buy signal may be confirmed if the price bounces off a key Fibonacci level with strong volume, while a sell signal may be confirmed with a reversal pattern occurring near these levels. However, it's important to use the Fibonacci retracement in conjunction with other technical analysis tools and indicators for better accuracy.
Fibonacci has a strange effect on traders. A chart can look messy, noisy, almost unreadable. Then a trader draws a Fibonacci retracement from one swing to another, and suddenly the market appears more organized. The pullback has structure. The levels have names. The next move feels easier to plan. That sense of order is useful. It can also be dangerous.
A Fibonacci level does not move price by itself. The market moves because orders are triggered, liquidity is taken, positions are forced out, and traders adjust risk under pressure. The numbers on the chart matter only when price action around them confirms that other market participants are reacting.
That is the real value of Fibonacci in Forex. It does not predict the next candle. It shows where the next important decision may happen. The edge is not the level. The edge is the reaction.
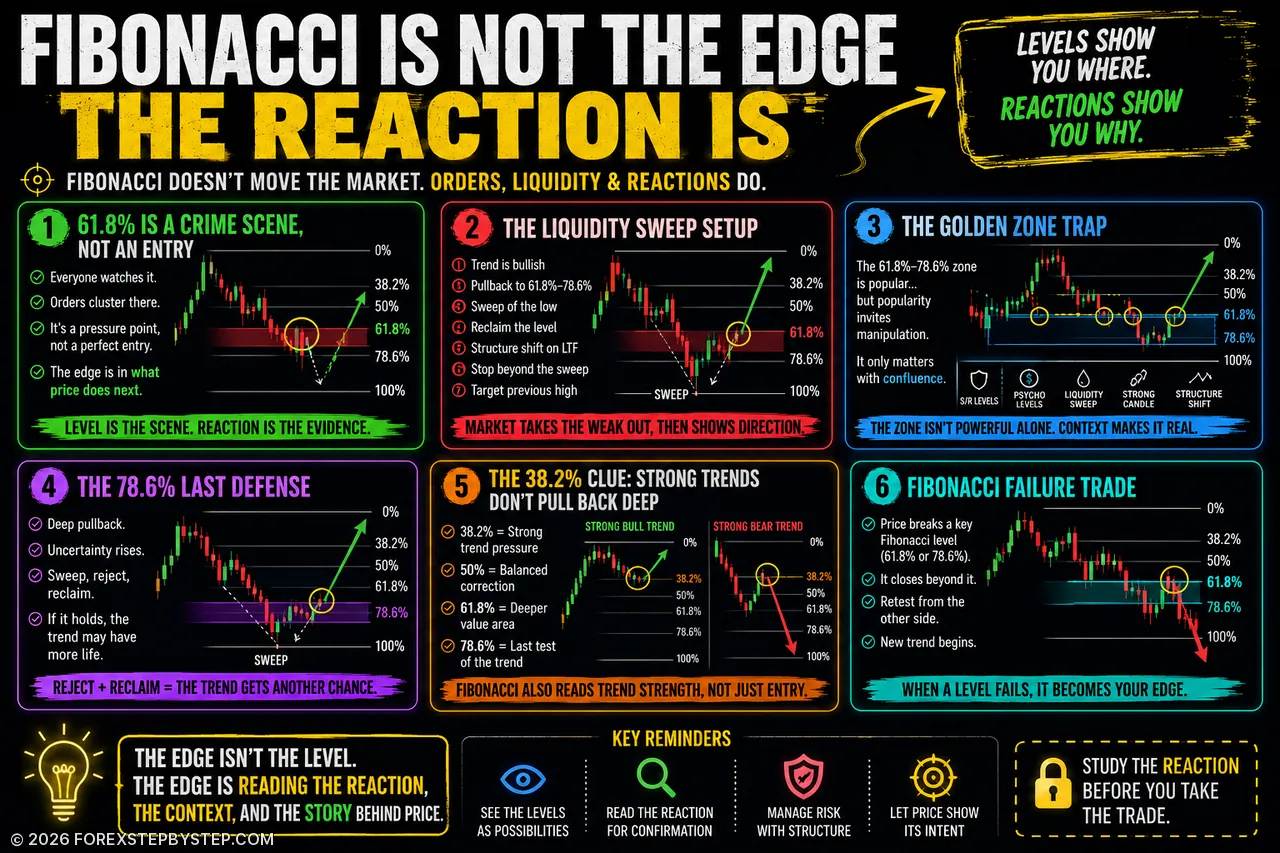
🕵️♂️ 1. The 61.8% Level Is Not an Entry — It Is a Crime Scene
The 61.8% retracement is probably the most famous Fibonacci level in trading. It is also one of the easiest to misuse.
Many traders treat it as an automatic entry point. Price pulls back, touches the level, and they enter. The stop usually sits just beyond the nearest swing. The target is the previous high or low. On paper, the setup looks clean. In live markets, clean can be dangerous.
When too many traders are watching the same area, orders begin to cluster. Entries gather around the level. Stops build just beyond it. Breakout traders wait on the other side. What looked like a perfect entry can quickly become a liquidity pocket. This is why the first touch is rarely enough.
A better question is not: Did price reach 61.8%?
A better question is: What did the market do after it got there?
Look for details that actually change the quality of the setup:
Did price reject the zone with conviction?
Did it sweep a nearby high or low before reversing?
Did the candle close back inside the previous structure?
Did the lower time frame shift direction?
Is there a logical place where the trade idea becomes invalid?
The level is the scene. The reaction is the evidence.
💧 2. The Liquidity Sweep Setup
Some of the strongest Fibonacci trades do not begin with a perfect bounce. They begin with a shakeout.
Imagine a bullish market. Price has made a strong move higher and now pulls back into the 61.8%–78.6% area. The zone lines up with previous support, so early buyers begin to step in. Then price breaks below the zone.
Stops are triggered. Late sellers enter. For a short moment, the chart looks bearish. Then price reclaims the swept area and begins to move higher again. That reclaim is often more important than the original Fibonacci touch.
A bullish liquidity sweep setup may follow this sequence:
The higher-time-frame trend is still bullish.
Price pulls back into the 61.8%–78.6% retracement zone.
A short-term low is swept.
Price closes back above the swept area.
Price action on the lower time frame shifts from bearish to bullish.
The stop sits beyond the sweep, not inside the obvious noise.
Targets are planned around the previous high and possible extension levels.
The logic is simple enough: the market removes weak hands before showing direction. This is why good Fibonacci trades often feel uncomfortable at first. They do not always look clean. Sometimes they look wrong just before they start working.
⚠️ 3. The Golden Zone Trap
The area between 61.8% and 78.6% is often called the golden zone. Traders love it because it suggests value inside a trend. But popularity creates its own problem.
If too many traders are waiting in the same area, the zone becomes crowded. A crowded level can still work, but it is more likely to produce false reactions, stop runs, and messy price action before direction becomes clear.
The golden zone is not powerful simply because it is golden. It becomes meaningful when it aligns with other evidence.
Useful confluence may include:
Previous support or resistance
A daily or weekly level
A psychological price level
A session high or low
A liquidity sweep
A strong close away from the zone
A lower-time-frame structure shift
Without context, the golden zone is only a marked area on the chart. With context, it becomes a decision zone. That distinction matters more than the ratio itself.
🛡️ 4. The 78.6% “Last Defense” Setup
The 78.6% retracement is less popular than 61.8%, but it often tells a more interesting story.
By the time price reaches 78.6%, the pullback is deep. Early entries are under pressure. Some traders have already been stopped out. Others begin to question whether the original trend is still valid. That discomfort can be useful information.
A deep retracement into 78.6% can act as a final test of the trend. If price sweeps liquidity, rejects the level, and then reclaims structure, the move that follows can be sharp.
A stronger 78.6% setup usually needs more than the level itself:
The higher-time-frame trend remains intact.
Price retraces deeply into the 78.6% area.
A previous high or low is swept.
Price rejects and closes back with strength.
The lower time frame confirms a shift in structure.
This is not a level for blind entries. It is a high-information area. If the market defends it, the trend may still have life. If price breaks through it cleanly, the original trade idea may be finished.
⚡ 5. The 38.2% Clue: When the Market Refuses to Pull Back
Not every good trade reaches the golden zone. In strong trends, price may only pull back to 38.2% or 50% before continuing. Traders waiting for the perfect deep retracement are left behind, watching the move run without them.
A shallow pullback can say a lot. In a strong bullish trend, buyers may not wait for a discount. In a strong bearish trend, sellers may defend even small rallies. The market is showing urgency.
A simple way to read retracement depth:
38.2% often suggests strong trend pressure.
50% can reflect a balanced correction.
61.8% points to a deeper value area.
78.6% tests whether the trend is still alive.
This is one of the more overlooked uses of Fibonacci. It is not only an entry tool. It is also a way to judge the quality of the move.
Sometimes the message is not “enter here.”
Sometimes the message is “this trend is stronger than it looks.”
🔄 6. The Fibonacci Failure Trade
Most traders focus on Fibonacci levels that hold. More experienced traders also watch the levels that fail.
A failed Fibonacci reaction can reveal a change in control. If a level that should attract buyers produces only a weak bounce, then breaks, the failure itself becomes useful information.
For example, GBP/USD is trending higher. Price pulls back into 61.8%. Buyers step in, but the bounce is shallow. Then price breaks through 78.6%, closes below the prior swing low, and fails to recover.
At that point, the clean long setup is gone. The failed reaction becomes the story.
A Fibonacci failure setup may unfold like this:
Price reaches a major Fibonacci retracement zone.
The first reaction is weak.
The deeper retracement levels break.
The previous swing high or low is violated.
Price retests the broken zone.
Old support becomes resistance, or old resistance becomes support.
Sometimes the best trade is not the bounce. Sometimes it is the failure of the bounce.
🇬🇧 7. The London Open Fibonacci Trap
Forex is not only about levels. Timing matters.
A Fibonacci zone touched during a quiet period does not carry the same weight as one tested during London or New York. Liquidity changes. Participation changes. Volatility changes.
The London open is especially important because it often brings the first serious liquidity injection of the European trading day.
A classic London setup may follow this sequence:
The Asian session creates a clear range.
The higher-time-frame bias is bullish.
London opens and sweeps below the Asian low.
The sweep lands inside the 61.8%–78.6% Fibonacci zone.
Price quickly reclaims the Asian range.
Lower-time-frame structure turns bullish.
This is not a random Fibonacci trade. It combines timing, liquidity, structure, and trader psychology.
That combination is what gives the setup its character.
🇺🇸 8. The New York Continuation Setup
The New York session often decides whether the London move continues or fades.
If London creates the impulse and New York pulls back into a clean Fibonacci zone, traders may get a second chance to participate without chasing the move.
A bullish New York continuation setup may look like this:
London creates a strong directional impulse.
Price breaks structure.
New York pulls back into the 38.2%–61.8% area.
The pullback looks corrective rather than impulsive.
Price rejects the zone.
Lower-time-frame structure turns back in the direction of the impulse.
This setup is especially relevant on USD pairs because New York brings fresh liquidity, new data, and a different wave of participation.
The mistake is chasing the London move late.
The better approach is waiting to see whether New York offers a controlled pullback.
🚫 9. The “No Trade” Fibonacci Setup
One of the most valuable Fibonacci setups is the one that keeps you out.
If the swing high and swing low are not obvious, do not force the tool. If price is chopping through every level, the levels probably do not matter. If major news is minutes away, technical levels may become secondary to volatility.
Fibonacci should bring clarity. If it creates confusion, remove it.
A simple filter helps:
No clear swing? No trade.
No higher-time-frame alignment? Be careful.
No confirmation? Wait.
No logical stop? Skip it.
No clean target? The setup is incomplete.
Good trading is not about finding more trades. It is about filtering harder.
🧩 10. The Three-Layer Rule
A Fibonacci level alone is weak. A Fibonacci level with structure is better. A Fibonacci level with structure, liquidity, timing, and confirmation is where the idea starts to become serious. A useful rule is to demand at least three layers of evidence before considering a trade.
Possible layers include:
Fibonacci retracement zone
Higher-time-frame direction
Support or resistance
Liquidity sweep
Session timing
Market structure shift
Clean risk-to-reward profile
Example:
61.8% retracement + previous support + Asian low sweep + London reclaim + bullish structure shift.
That is not just a level. That is a story. The market does not need to be perfect. It only needs to provide enough evidence to justify the risk.
🎯 11. Stop Losses Should Hide Behind the Story
Most bad stop losses are placed for emotional reasons. The trader wants a bigger position. The trader wants the risk to look smaller. The trader does not want to accept where the idea is actually invalidated. So the stop goes too close. Then price taps it, removes the trader, and moves in the original direction.
A professional stop loss answers one question:
Where is my trade idea wrong?
If the trade is based on a liquidity sweep, the stop usually belongs beyond the sweep. If the trade is based on a structure shift, the stop belongs beyond the structure that invalidates the shift. A tight stop is not automatically smart. Sometimes it is just easy liquidity.
🧠 12. The Best Fibonacci Trades Feel Uncomfortable
The cleanest-looking trade is not always the best trade. Often, the better setups appear after the chart has already scared most traders.
Examples include:
A deep wick into 78.6%
A sweep below a session low
A failed bounce from 61.8%
A fake breakout above the Asian range
A reclaim after the market briefly looked broken
These moments feel uncomfortable because emotional pressure has already entered the market. That is also why they matter.
Markets often move after traders have been pushed into bad decisions. Fibonacci can help identify where those decisions may happen.
The level is not the edge. The behavior around the level is the edge.
🗺️ Final Word: Fibonacci Is a Map, Not a Signal
Fibonacci is popular because it gives traders structure. It helps define pullback zones, possible invalidation areas, and extension targets.
But Fibonacci does not predict the future. It does not know whether the next candle will reject, break, sweep, or consolidate.
The amateur sees a Fibonacci level and asks: Should I enter?
The stronger trader asks:
Who is trapped here?
Where is liquidity?
Has structure shifted?
Is the timing right?
Where is my trade idea wrong?
That mindset changes everything. A Fibonacci level is not a reason to trade. It is a reason to pay attention.
The best setups are rarely perfect textbook examples. They are often messy, emotional, and uncomfortable before they become obvious.
Fibonacci does not create an edge by itself. The edge comes from patience, context, timing, and the discipline to wait until the market actually says something.
📝 Editor’s Note
The strategies and market concepts discussed in our content are designed to help readers better understand market behavior. They are not trading recommendations. Financial markets are volatile, and every trader should test ideas carefully, manage risk and make independent decisions.