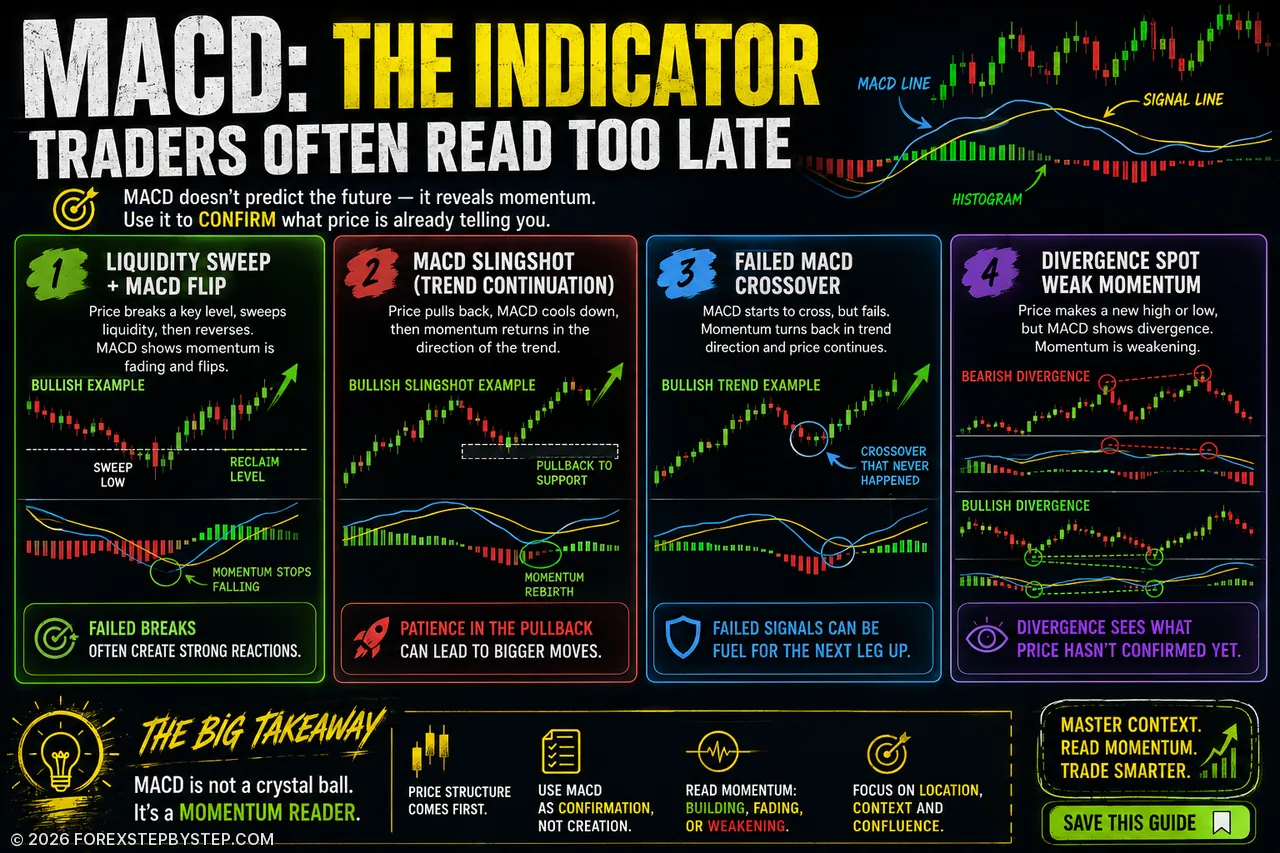
Most traders focus on the MACD crossover — but the real edge lies in what happens around it: momentum, location, and price structure.
⚡ MACD Beyond the Crossover
Most traders don’t lose with MACD because the indicator is useless. They lose because they ask too much from one simple signal.
A crossover can look convincing, but in Forex it often comes after the best part of the move is already gone. The more interesting clues usually appear earlier: a failed breakout, a liquidity sweep, fading histogram momentum, or a pullback where the trend quietly resets.
This guide looks at MACD from a more practical angle. Not as a buy-or-sell button, but as a way to read pressure, timing, and market behaviour. You will see how zero-line reactions, failed crossovers, histogram ignition, and no-trade zones can change the way you judge a setup.
Before taking your next MACD signal, ask yourself: is the indicator confirming the market — or are you reacting too late?
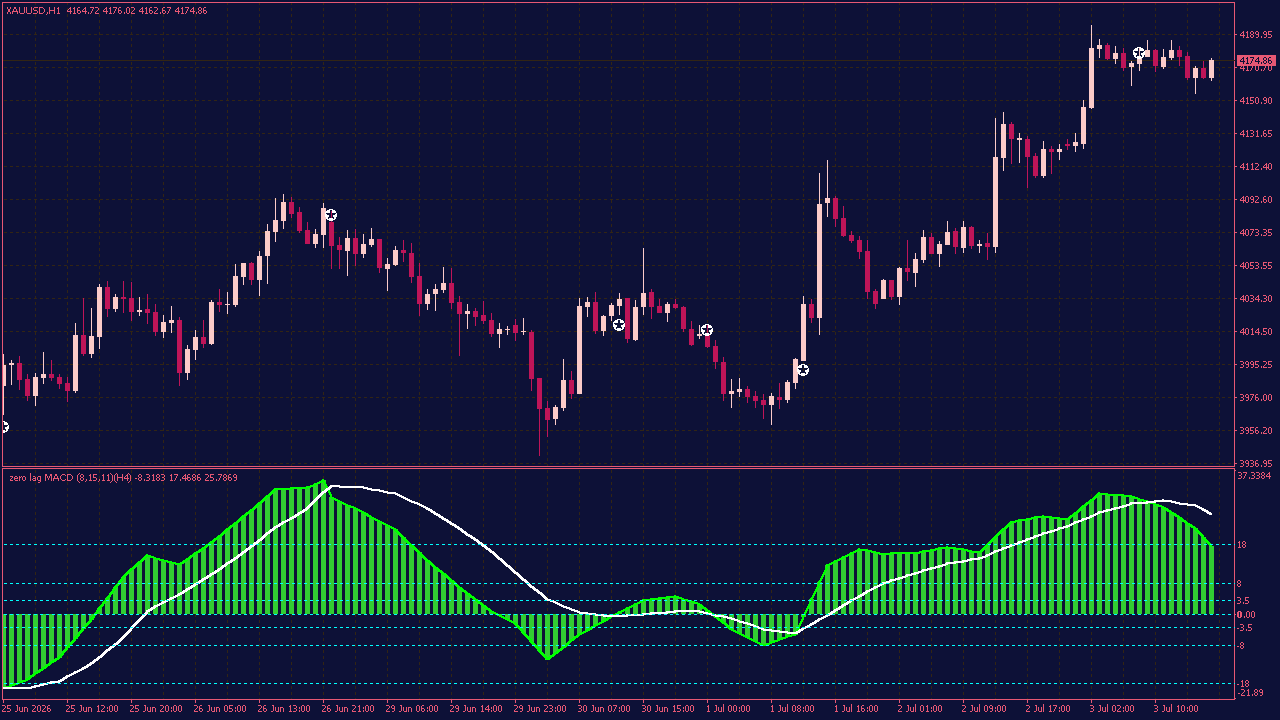
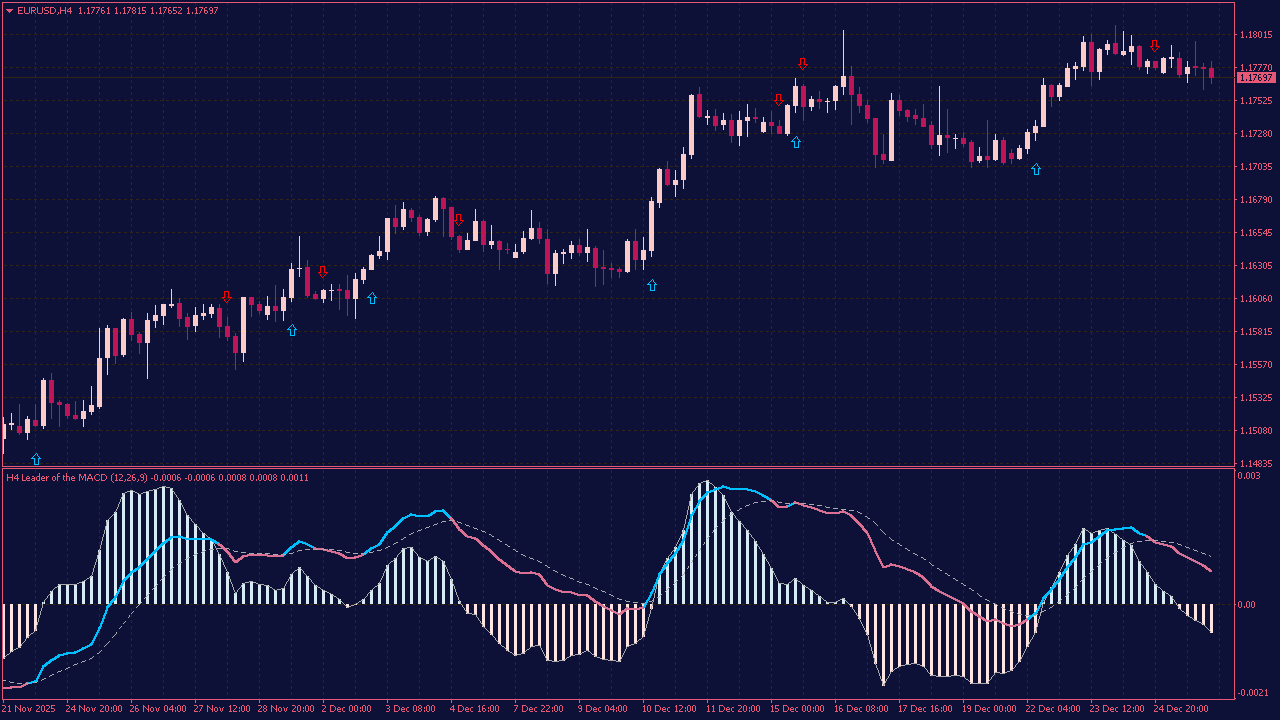
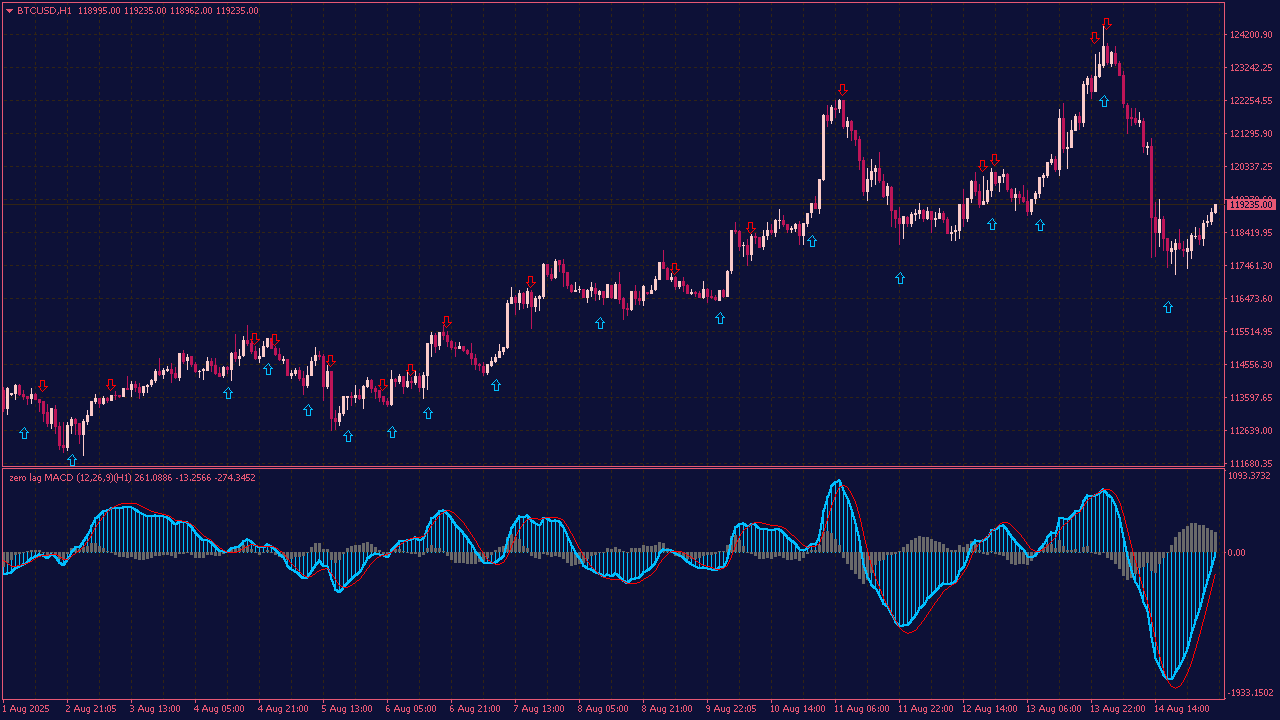
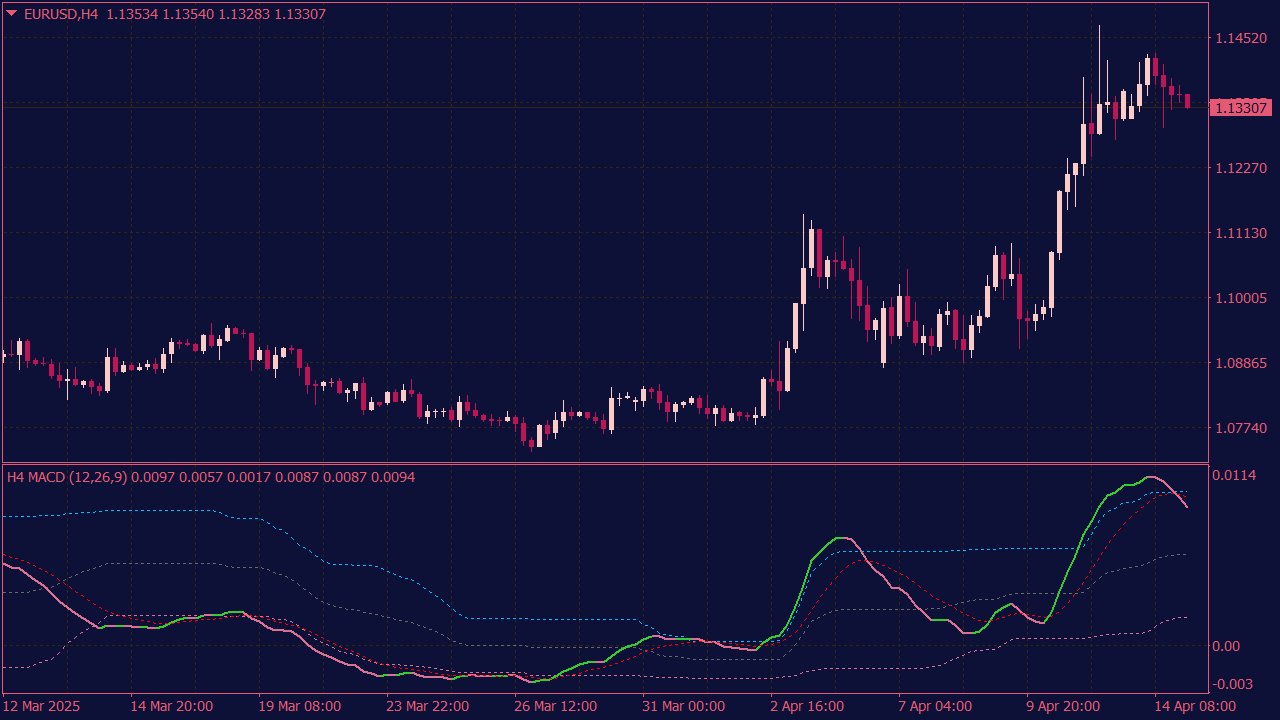
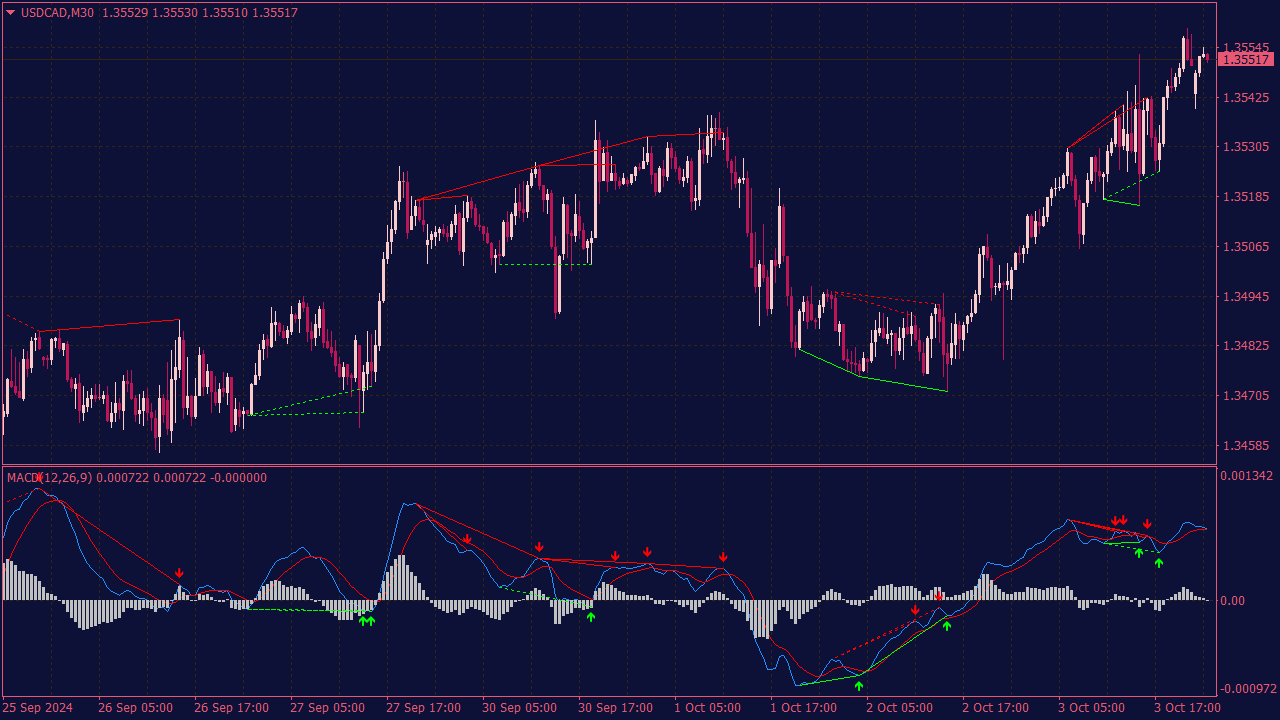
The Zero Lag MACD with Alerts is a trading indicator designed to help identify momentum changes and possible trend shifts with less delay than a traditional MACD. It displays the MACD line, signal line, and histogram for a clear view of market direction. The indicator also includes optional chart arrows and alerts for important MACD events, such as signal-line crosses or zero-line crosses. This makes it easier to notice potential trading signals without constantly watching the chart. It can be used across different markets and timeframes as a confirmation tool. For better results, traders often combine it with price action, trend analysis, support and resistance levels, or other technical tools.
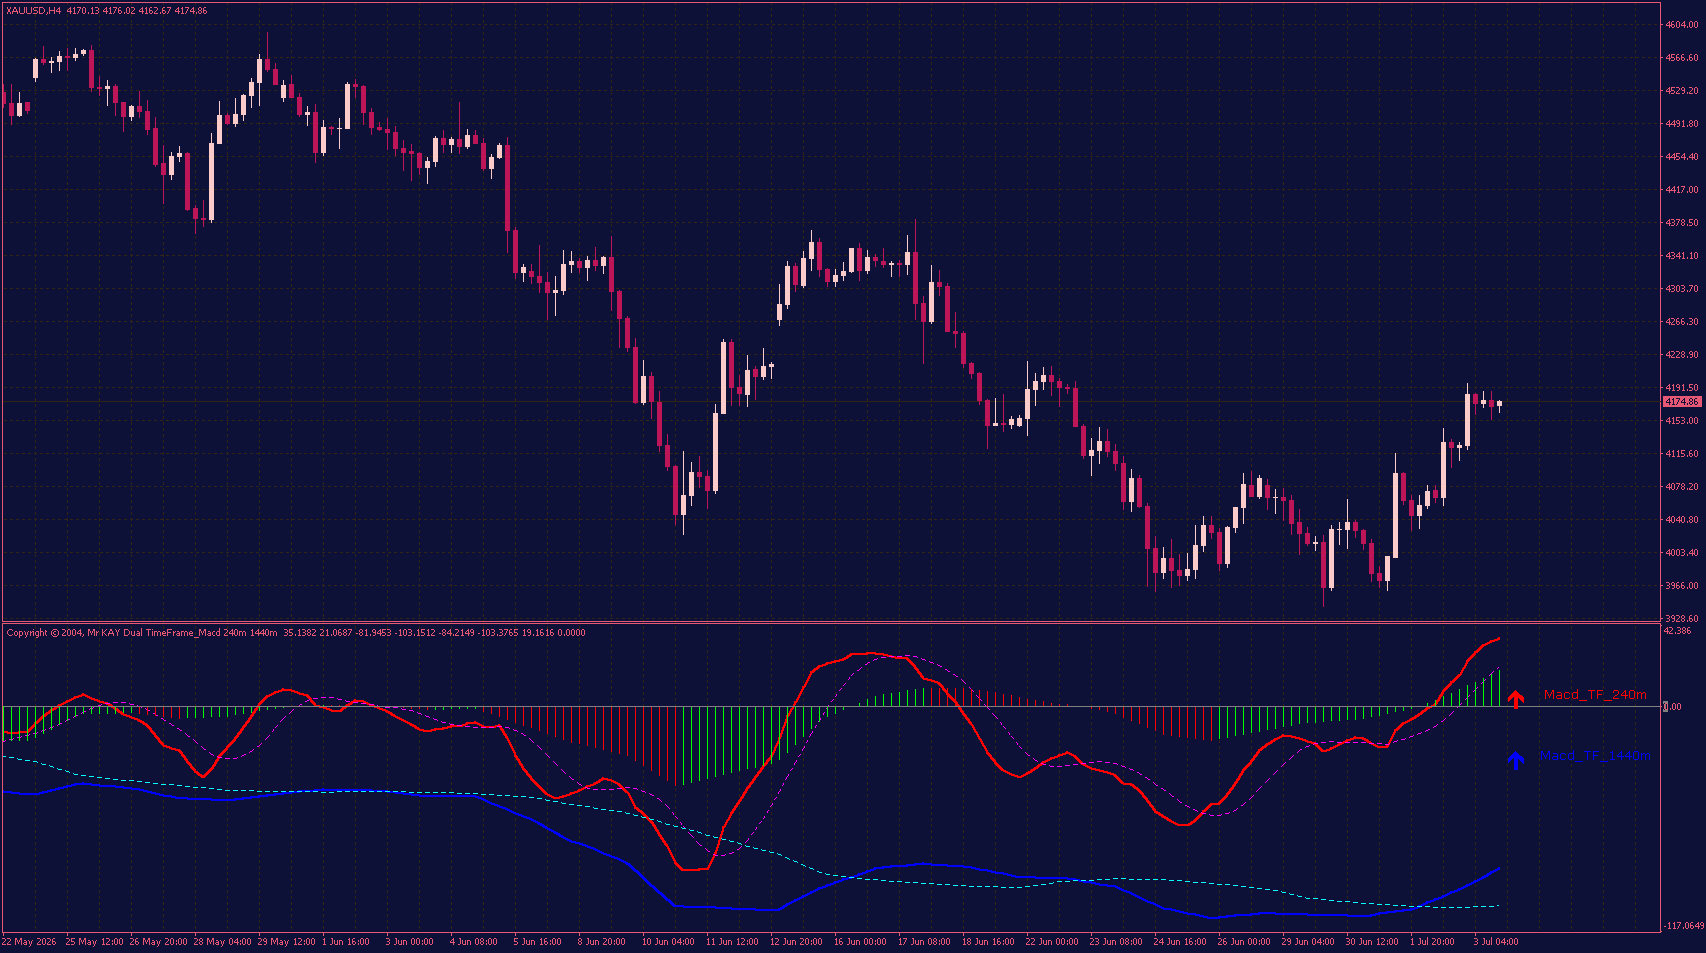
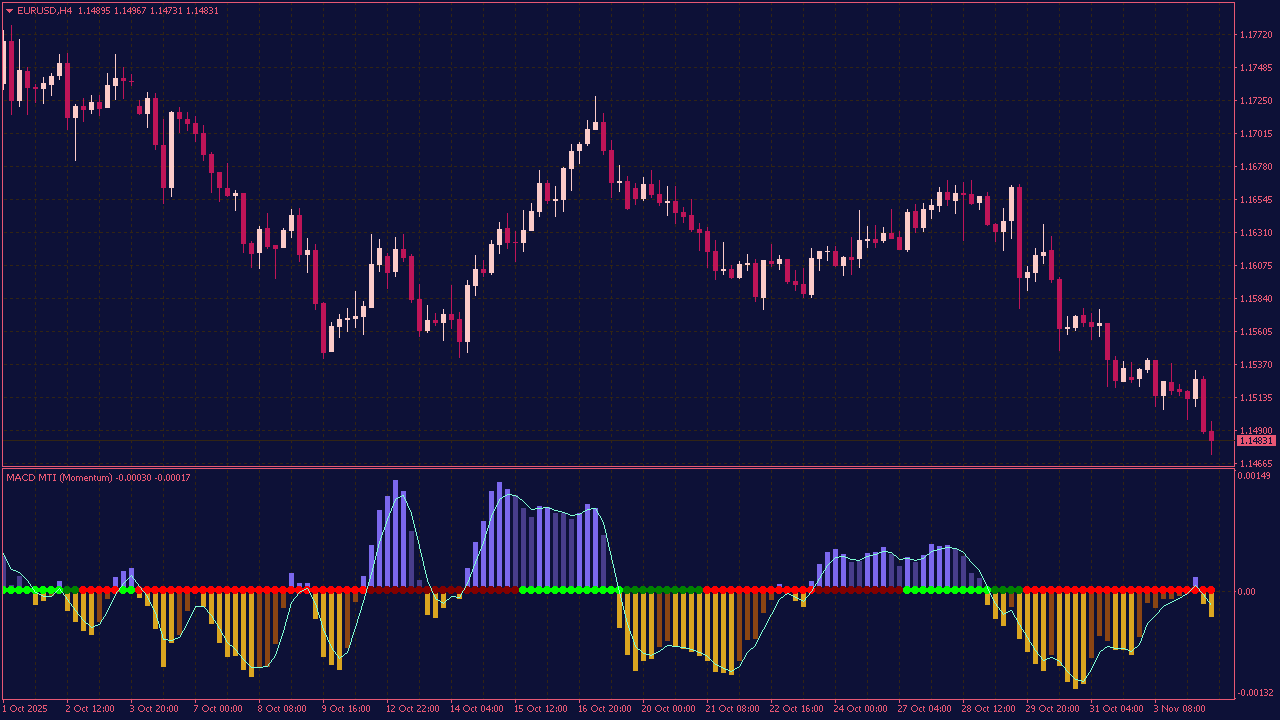
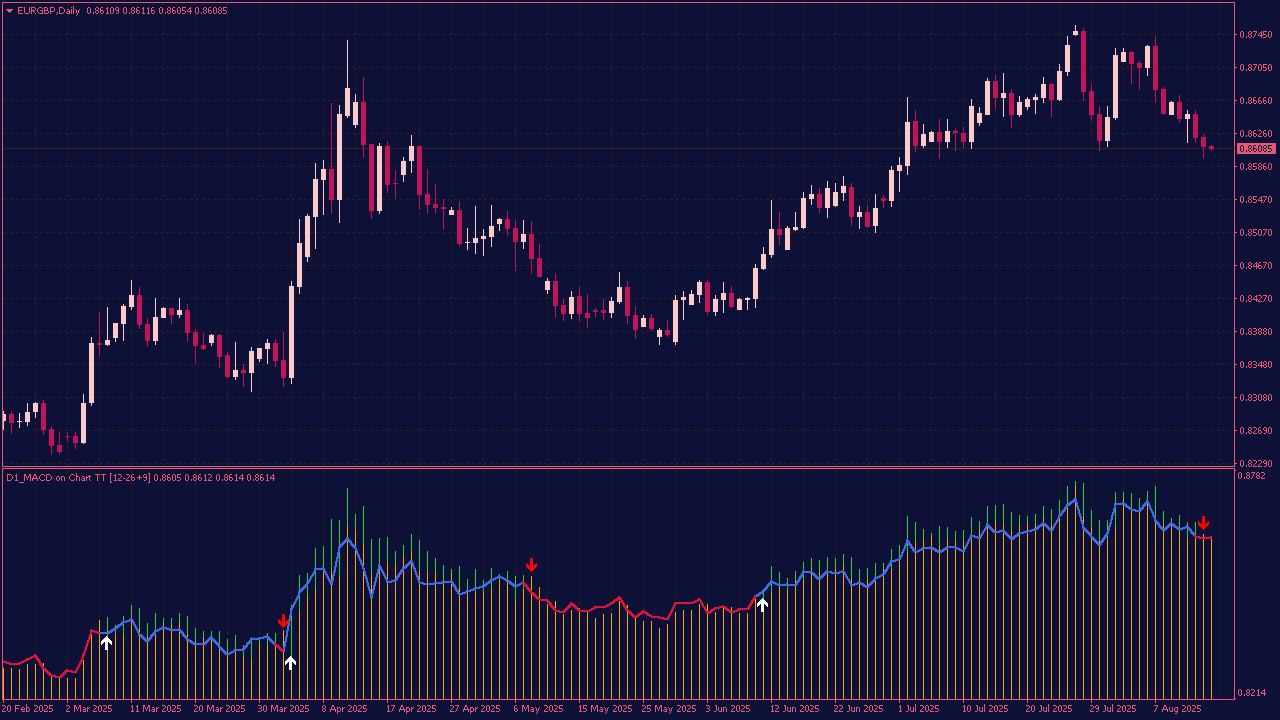
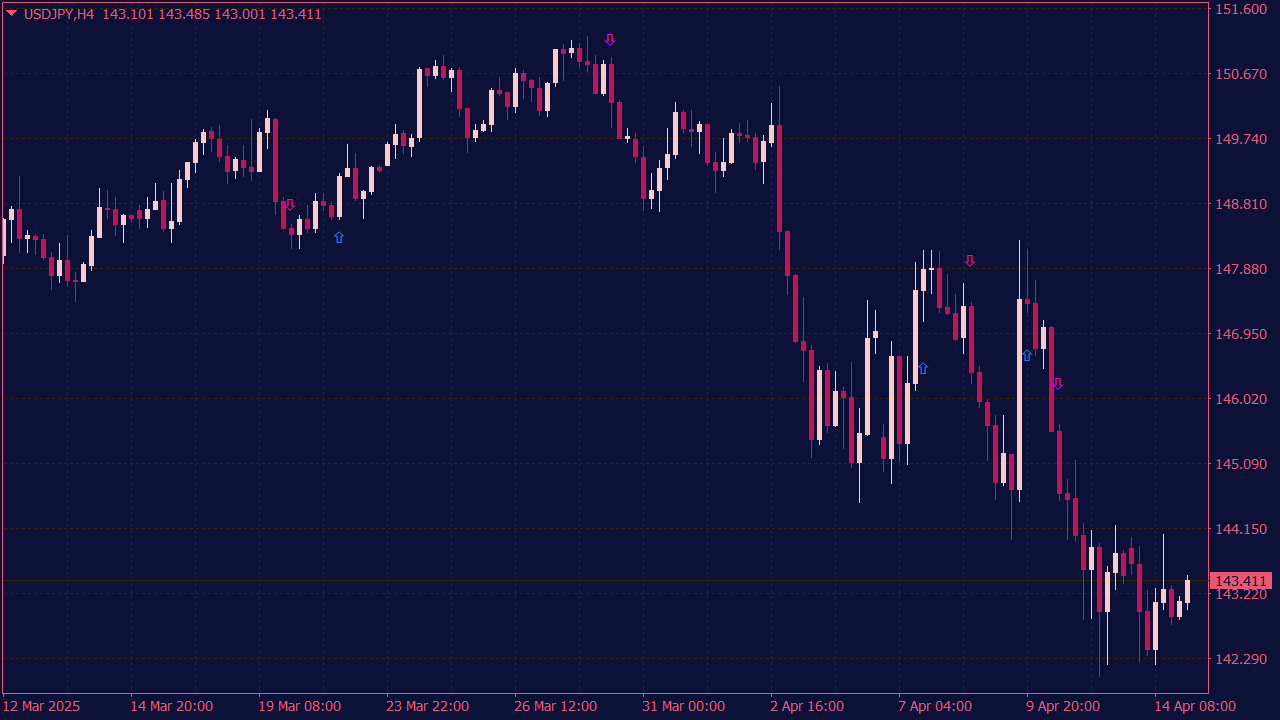
The Dual Time Frame MACD Indicator displays separate signals for each time frame, providing clear visual cues for both long-term and short-term trends. An upward arrow for the higher time frame (e.g., daily) indicates a bullish trend, while a corresponding upward arrow on the lower time frame (e.g., hourly) suggests a good entry point for long positions. Similarly, downward arrows on both time frames signal a strong bearish trend and potential sell opportunities. When the arrows align (both pointing up or down) it confirms the strength of the trend, offering traders a more reliable signal for making decisions.
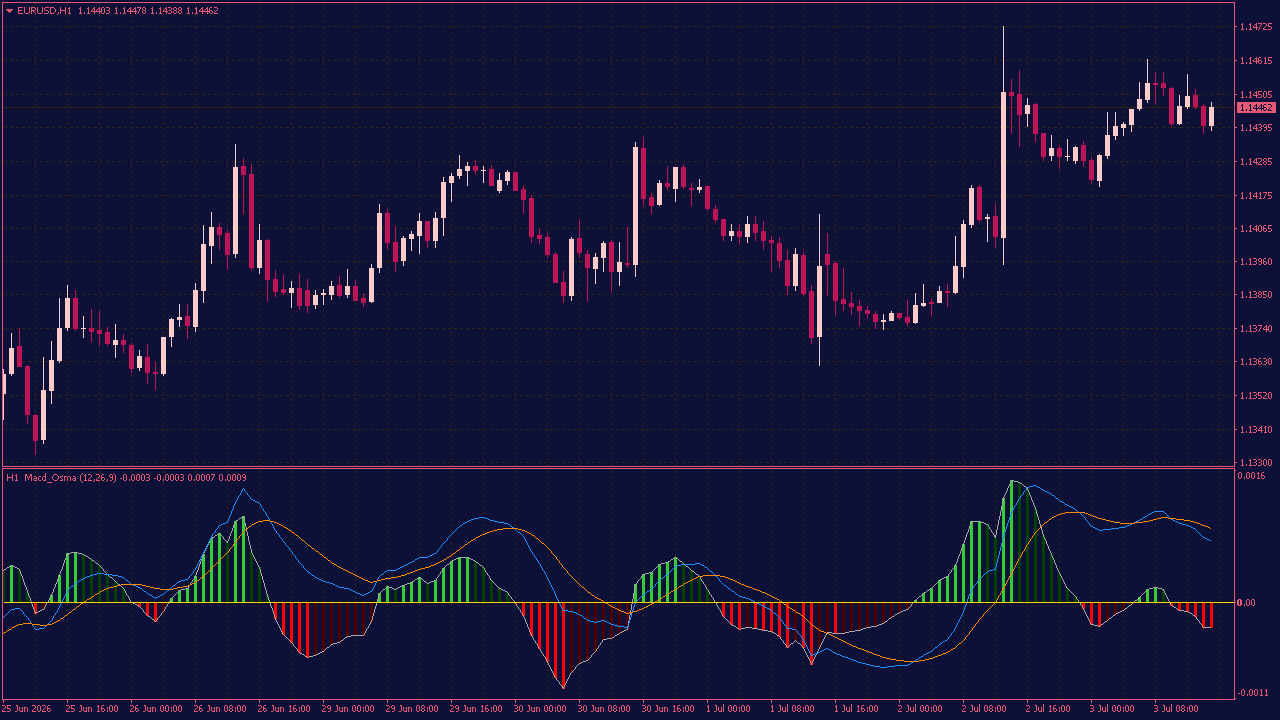
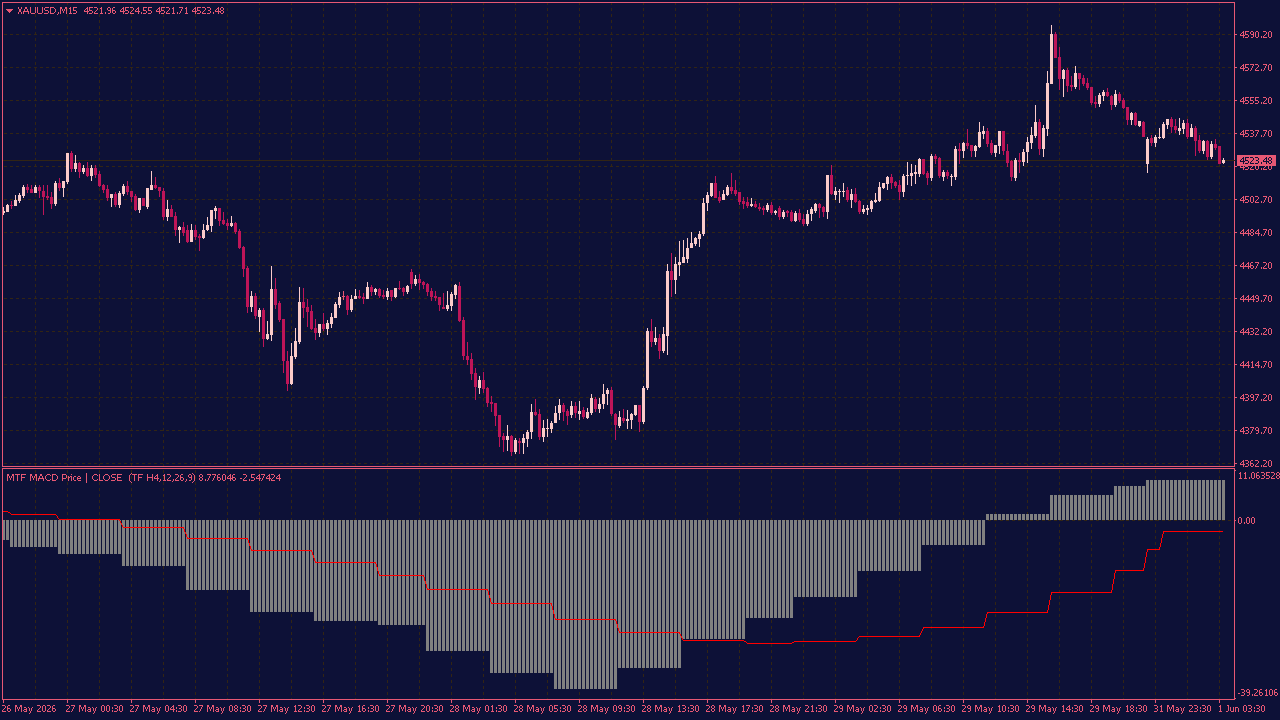
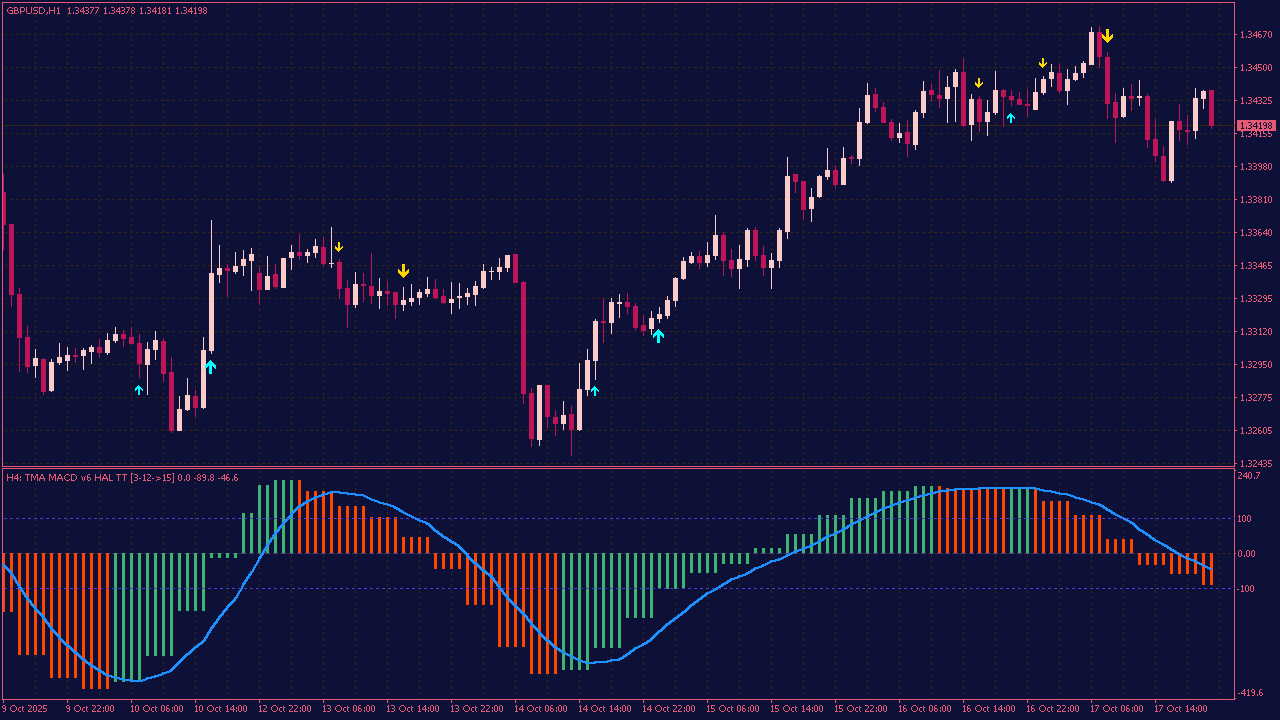
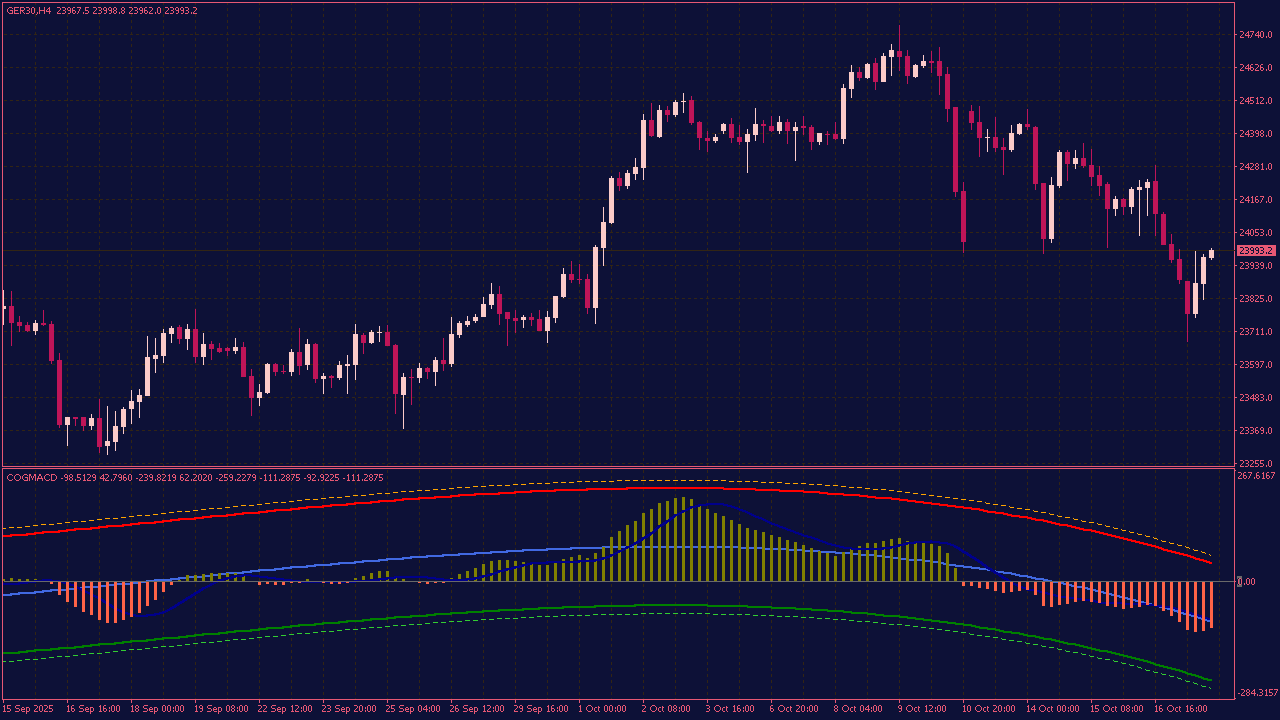
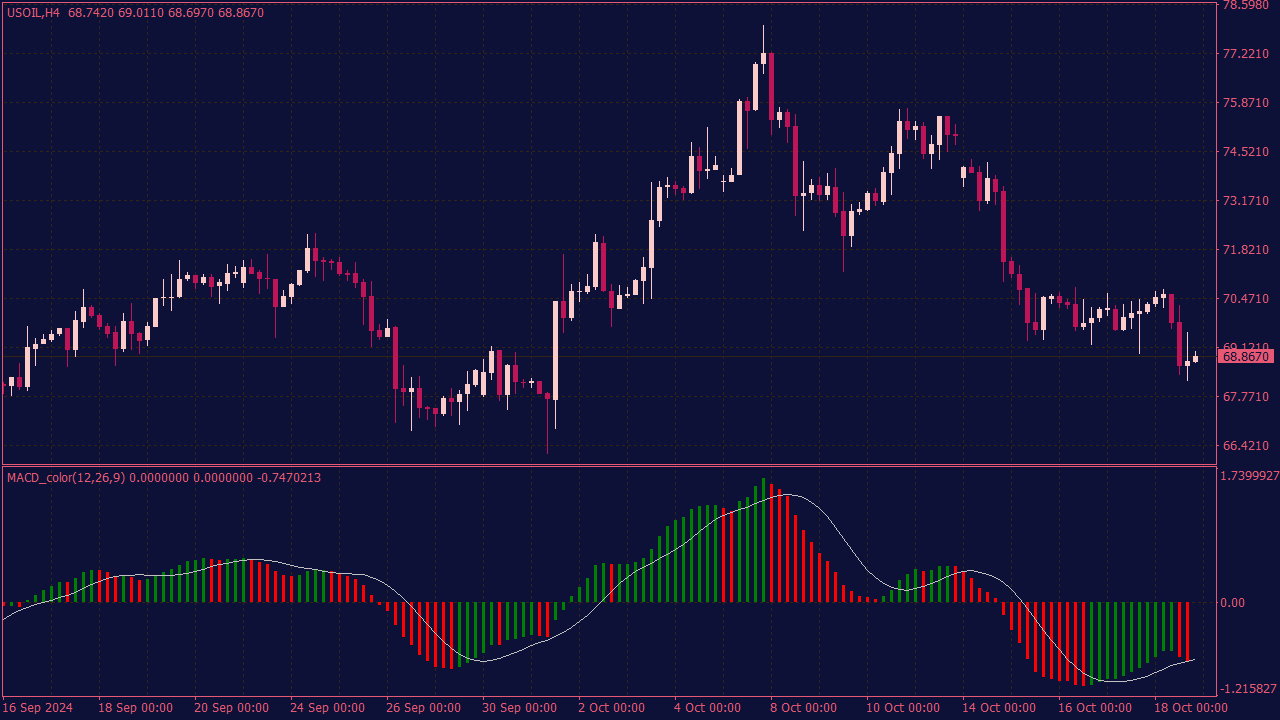
The MACD OsMA Color MTF is a practical momentum indicator that helps traders read market strength and direction more clearly. It displays the difference between the MACD line and the signal line as a color-coded histogram, making it easier to see when momentum is increasing, weakening, or changing direction. The multi-timeframe feature allows traders to view signals from another timeframe directly on the current chart. This can help confirm the broader market trend and filter out weaker trade setups.
The indicator can be adjusted to different trading styles by changing the fast, slow, and signal periods. It can be used for trend confirmation, momentum analysis, zero-line crosses, and spotting possible early changes in market direction. Optional alerts can notify traders when important signal changes occur, helping them react more efficiently without constantly watching the chart.
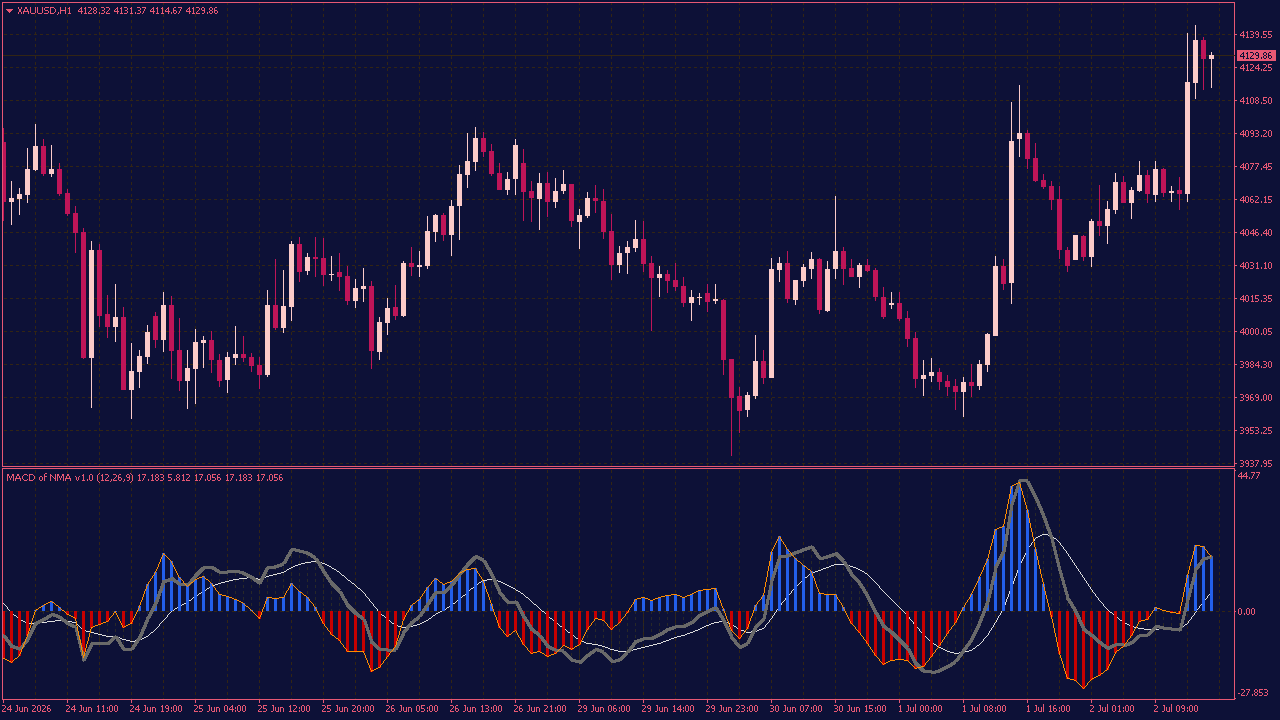
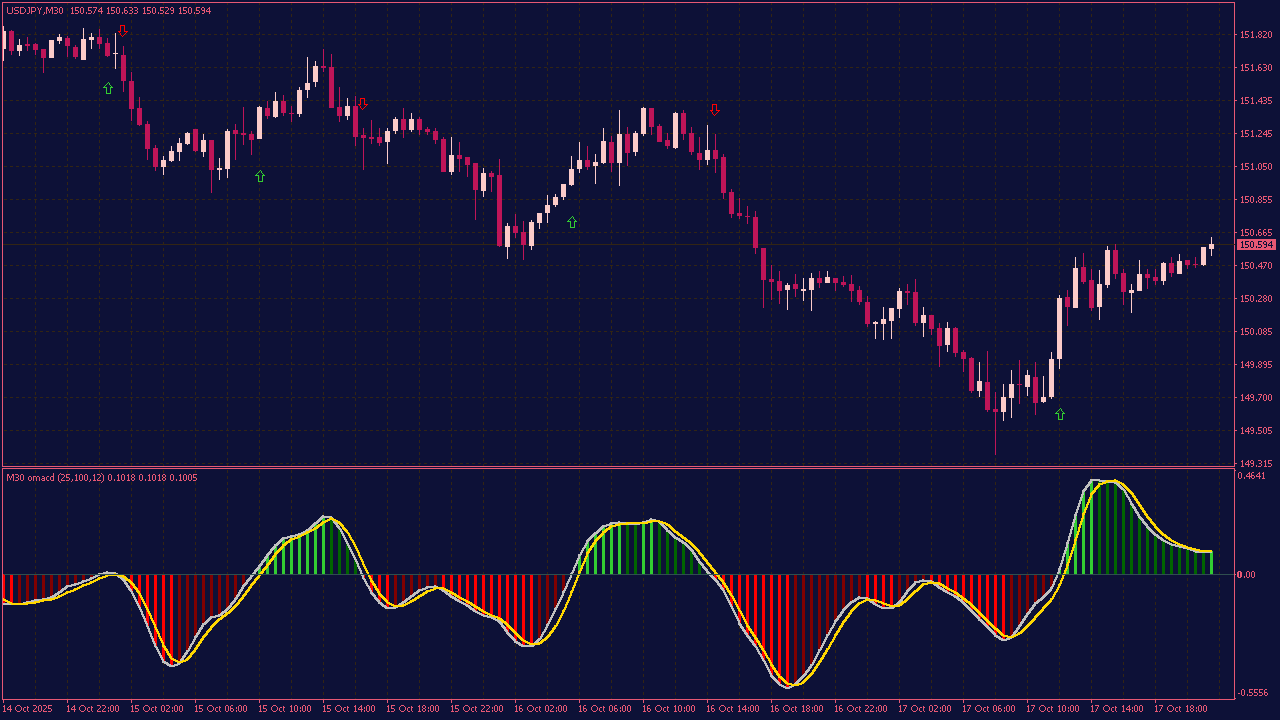
The MACD of NMA is a momentum indicator based on the classic MACD concept, but calculated with Non-Lag Moving Averages for a smoother and cleaner signal. It compares a fast and a slow NMA and displays the result with a signal line and a color-coded histogram. This helps traders spot changes in momentum, trend strength, and possible shift points more easily. The indicator includes adjustable settings for NMA periods, signal smoothing, applied price, moving average method, histogram display, and optional arrow signals. It is useful for traders who like MACD-style analysis but prefer a smoother and more responsive way to read market momentum.
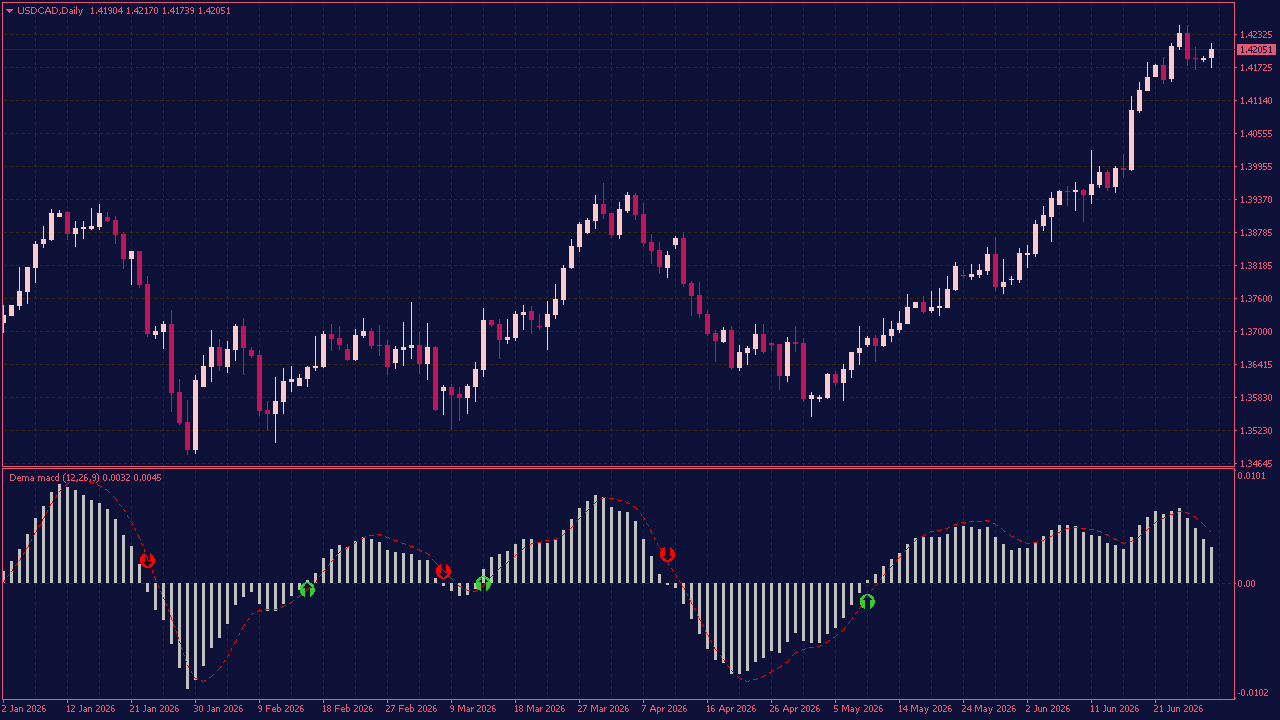
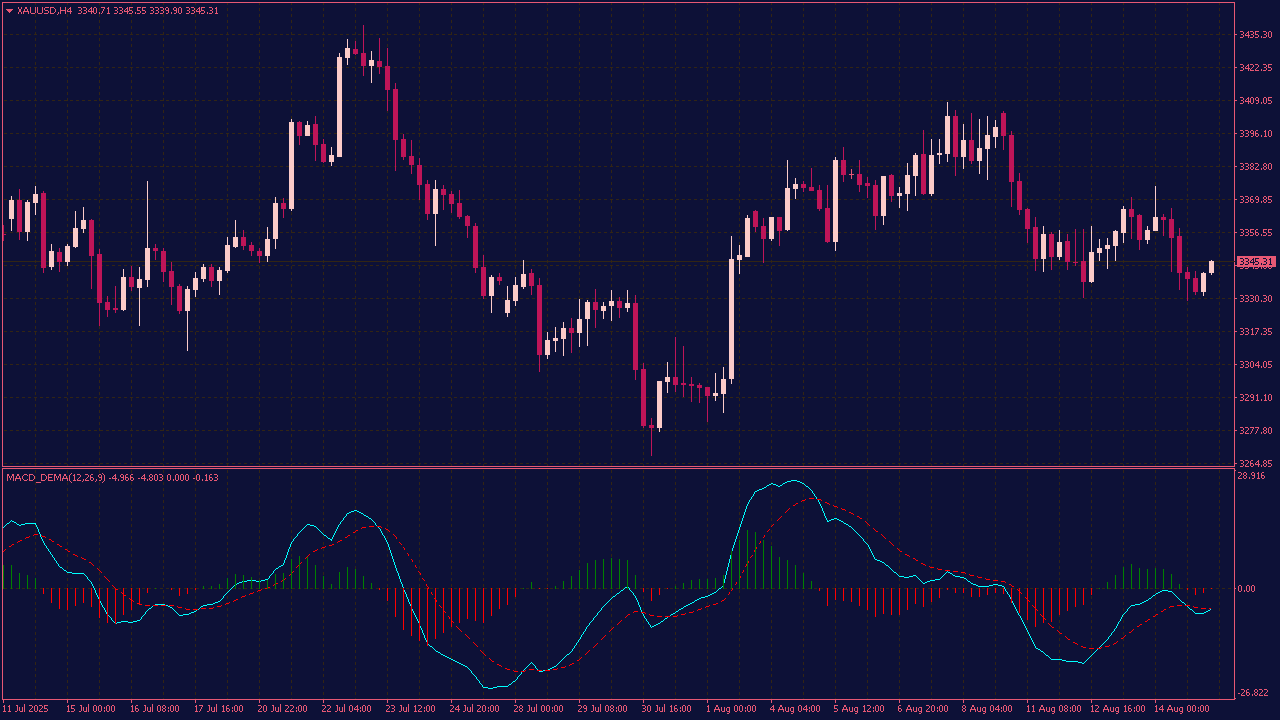
The DEMA MACD Indicator with Arrows is a custom MACD-based tool that uses DEMA smoothing to react faster to market changes. It shows clear arrow signals when possible bullish or bearish momentum appears, making trend changes easier to spot. The indicator can be used on different pairs and timeframes, but it works best together with price action or other confirmation tools. It is simple, visual, and useful for traders who prefer clean MACD-style signals without too much chart noise.
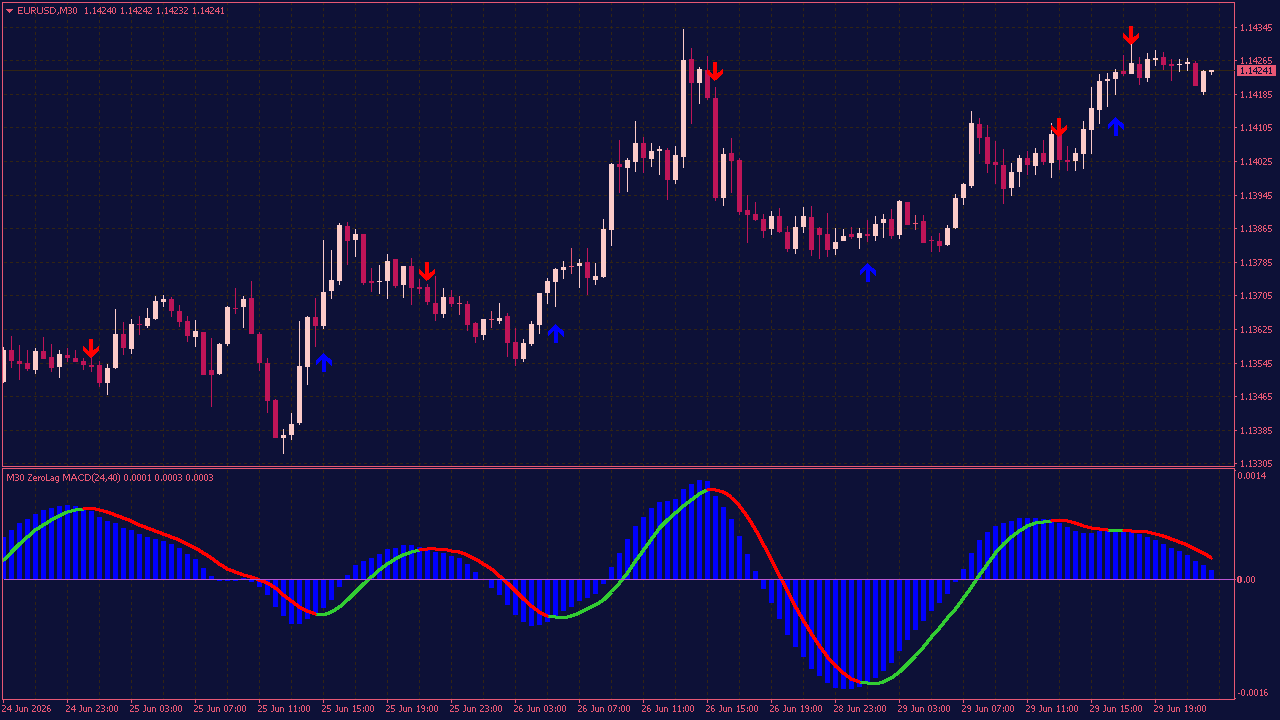
The ZeroLag MACD MTF Indicator with Arrows helps traders spot momentum changes and trend direction more clearly. It reacts faster than a traditional MACD and includes multi-timeframe support, so you can compare signals from different timeframes on one chart. The built-in arrows make potential buy and sell signals easy to see, which can be useful for scalping, day trading, or swing trading. For best results, it should be used together with price action, support and resistance, or another confirmation method.
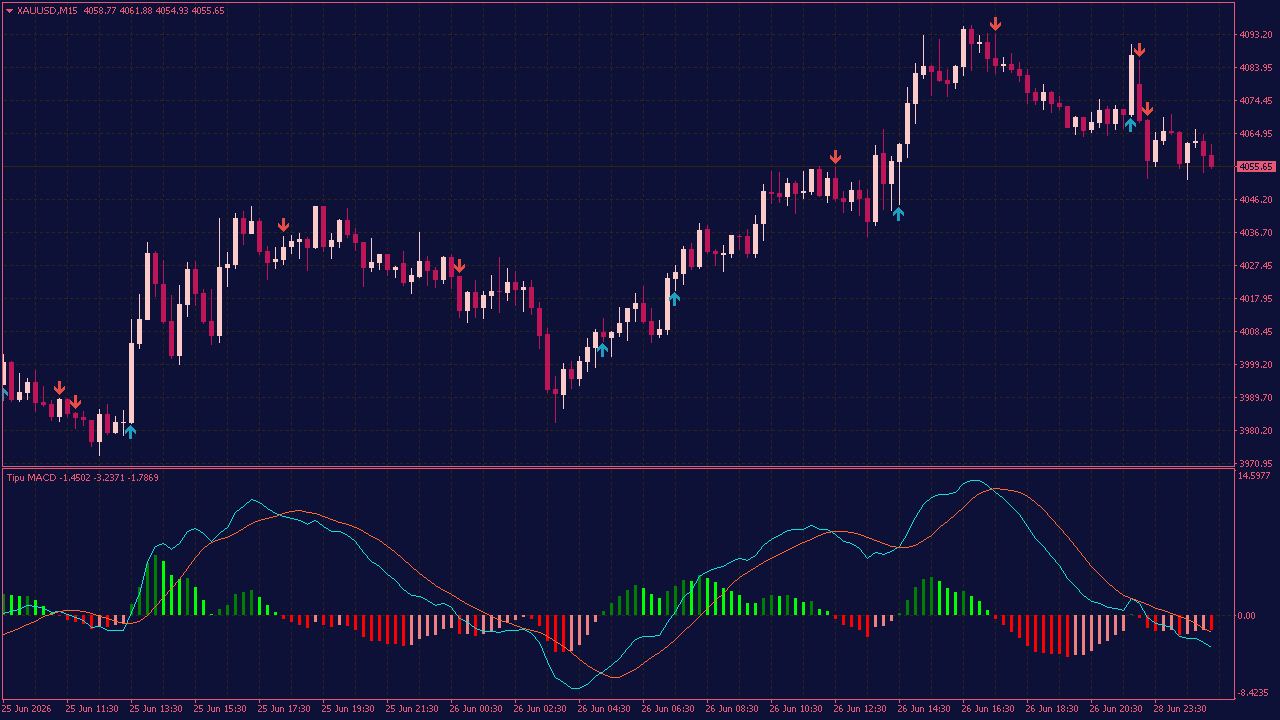
The Tipu MACD is a trading indicator that presents the classic MACD in a clearer and more visual way. It shows the MACD line, signal line, and a color-coded histogram to help traders spot changes in momentum more easily. The indicator can mark potential buy and sell signals on the chart, such as zero-line crosses or MACD signal-line crosses, using arrows or vertical lines. It also includes optional alerts for screen, email, and mobile notifications.
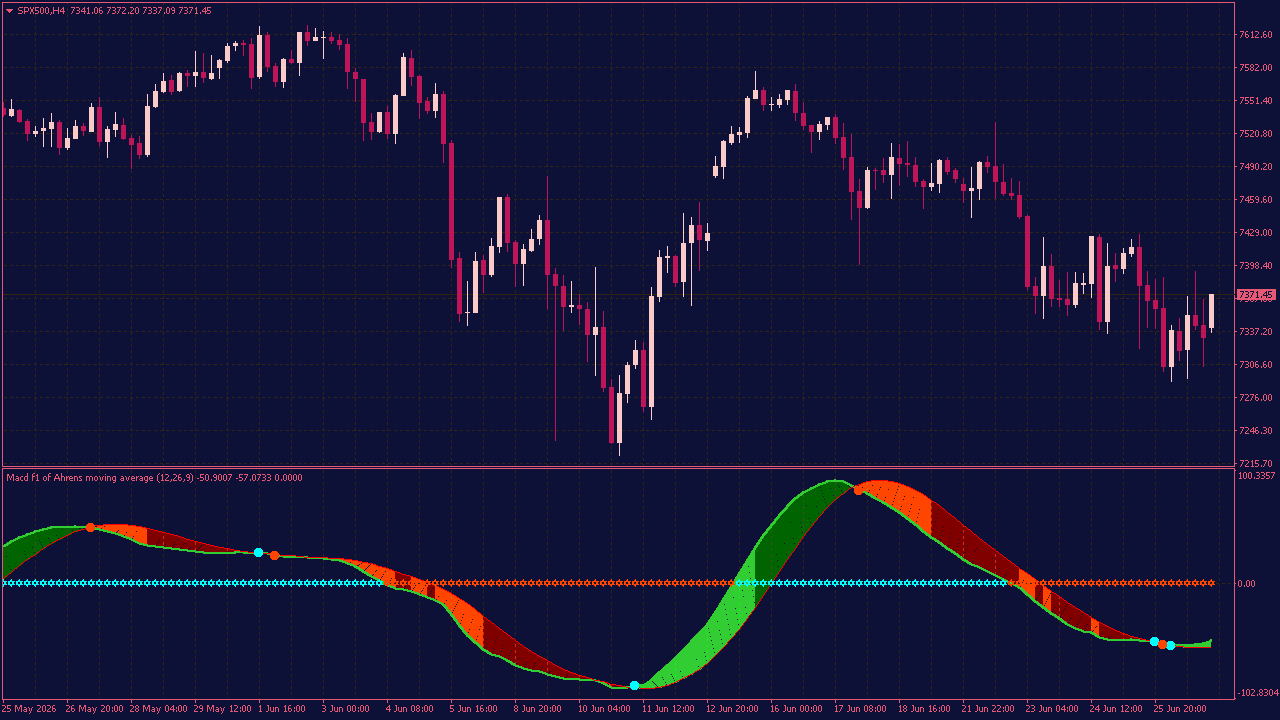
MACD Averages Fill Indicator with 50+ Average Filters
The MACD Averages Fill Indicator with 50+ Average Filters is a flexible MACD based on moving averages, with more than 50 average types to choose from and support for multiple price sources. The filled area between the MACD and signal line helps show how momentum is developing. When the gap between the two lines expands, it can suggest that the current trend is gaining strength. When the gap starts to shrink, momentum may be weakening.
You can also apply optional double smoothing to the fast MA, slow MA, and signal line, giving you more control over how responsive or smooth the MACD behaves. The indicator includes alert conditions for MACD and signal line crosses, intended to trigger when the MACD crosses above or below the signal line.
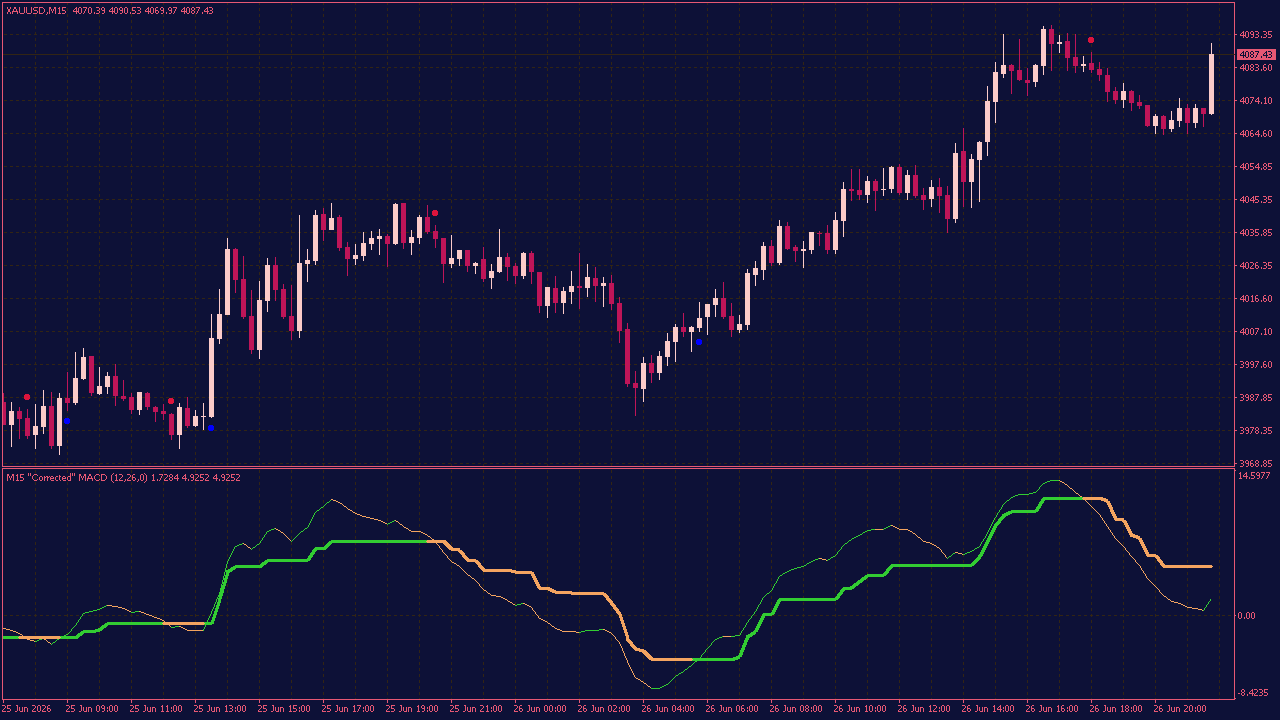
MACD CA (Corrected) MTF Indicator with Alerts & Arrows
The MACD CA (Corrected) MTF Indicator with Alerts & Arrows is based on a corrected MACD calculation designed to make the line smoother and easier to read. It can be useful in choppy, volatile, or low-volume market conditions. Compared to a standard MACD, this version uses dynamic correction to help reduce noise while keeping the core idea of the indicator intact. It also gives you more control over the price calculation, with options such as Heiken Ashi and Trend Biased price types.
The Correction setting controls the indicator’s sensitivity. Higher values create a smoother line, while lower values make it react faster. When set to 0, the slow EMA length is used as the correction period. The indicator also includes custom timeframe selection, signal options, alerts, and arrows, making it easier to adapt it to different trading styles and market conditions.
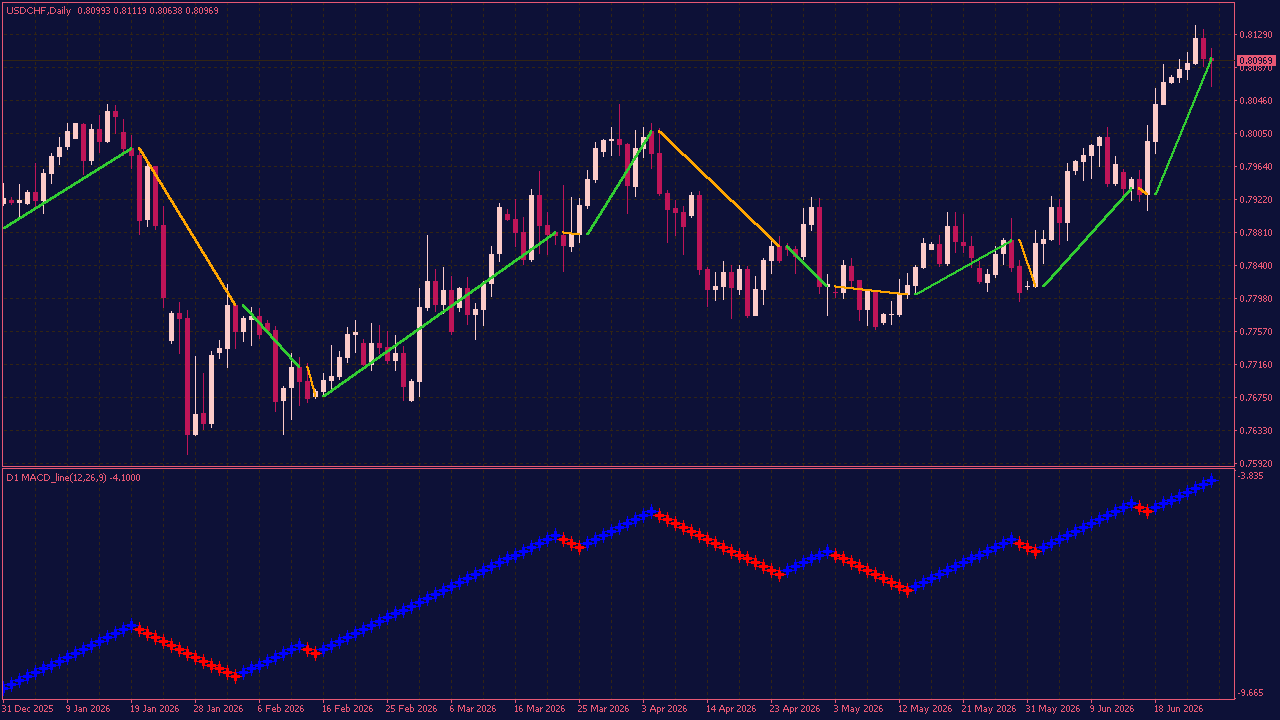
MACD Line on Chart MTF Indicator with Zig Zag/Renko Type Display
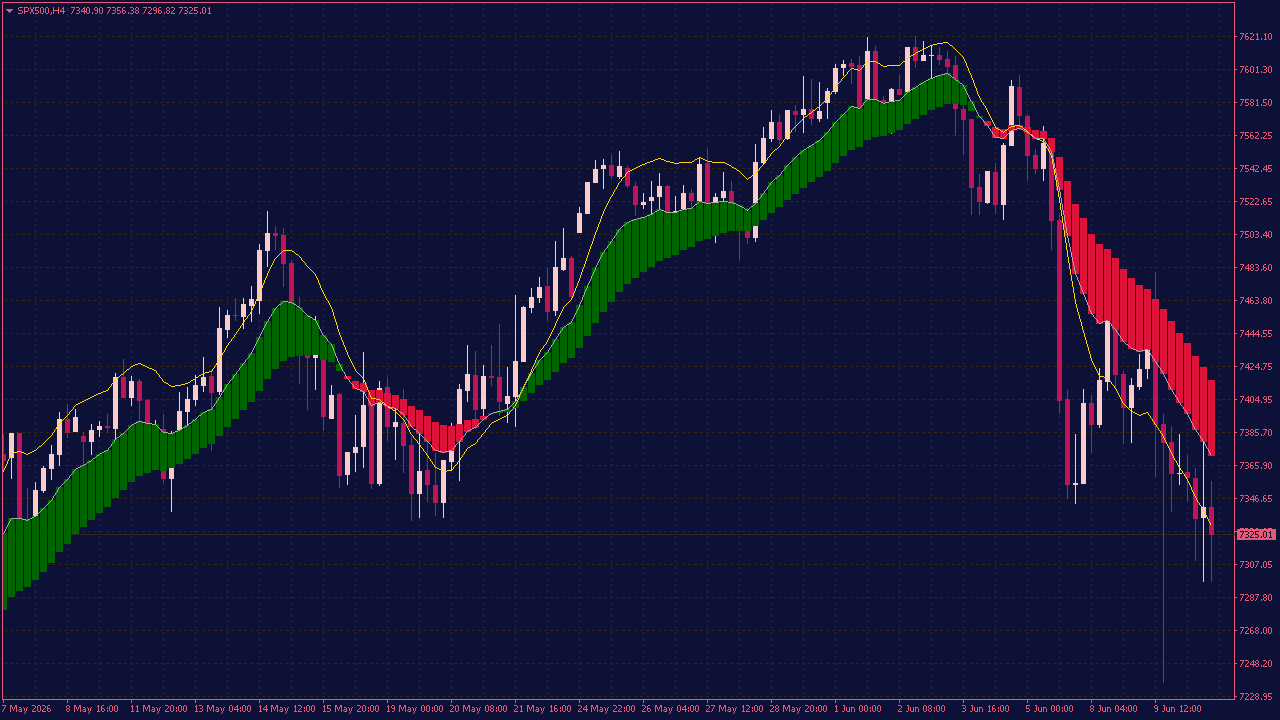
The MACD Line On Chart displays MACD movement in a clean Zig Zag / Renko-style view. It helps traders follow market direction directly on the chart and notice momentum changes more easily. The indicator uses color changes to separate bullish and bearish phases, making possible trend continuation or reversal areas easier to spot. It can be used together with price action, support and resistance, or other trading methods as an additional confirmation tool. Simple, visual, and easy to read for everyday chart analysis.
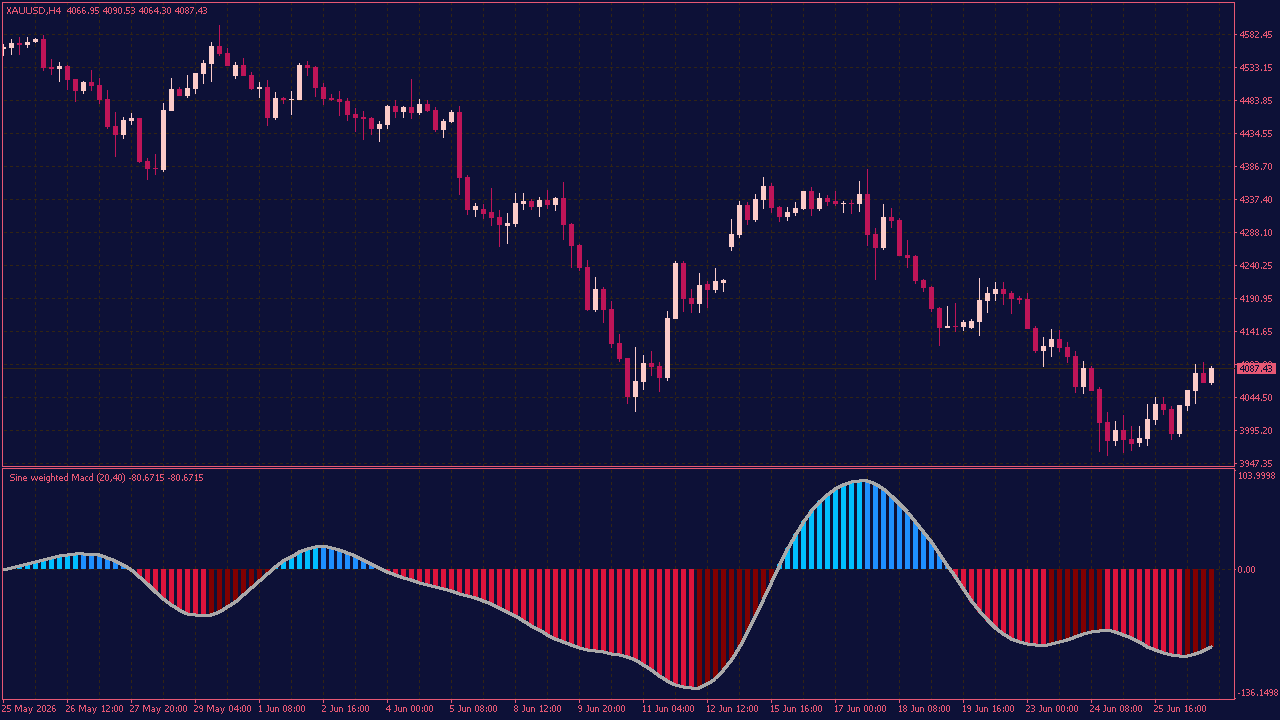
The Sine WMA MACD Indicator is built for traders who want a simple way to read market momentum and spot possible changes in trend direction. It combines sine-weighted moving averages with a MACD-style calculation, giving traders a clearer view of whether buyers or sellers are currently in control. The indicator uses colored histogram bars to show shifts in momentum. When the bars grow stronger, it can suggest that the current move is gaining power. When they become weaker, it may be an early sign that the trend is slowing down or that the market is preparing for a possible reversal.
This tool can be useful across different markets, including forex, stocks, indices, and commodities. Traders may use it to support entry and exit decisions, confirm trend continuation, or identify moments when market strength begins to fade. Like any technical indicator, the Sine WMA MACD Indicator should not be used on its own. It works best when combined with price action, support and resistance levels, trend lines, and proper risk management. This helps traders make more balanced decisions instead of relying on a single signal.
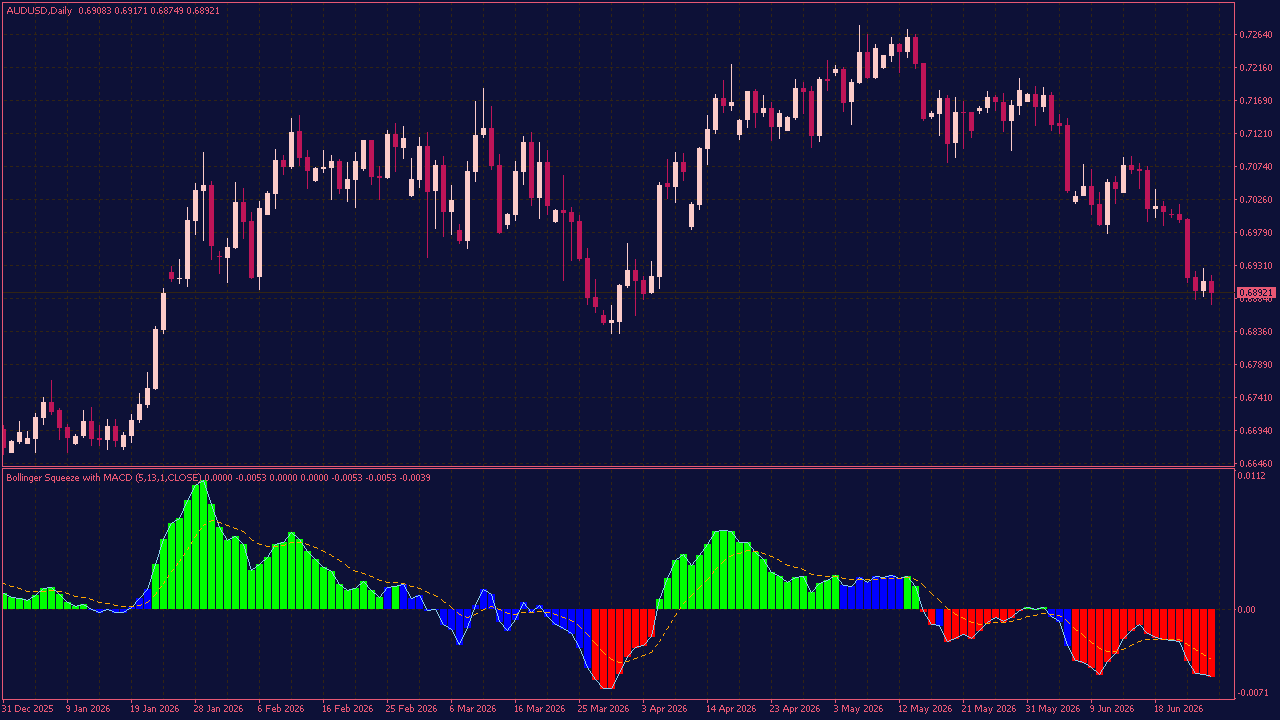
The Bollinger Squeeze with MACD MTF Indicator is an advanced and highly flexible MACD indicator designed to support different trading styles and market conditions. It includes multi-timeframe functionality, allowing traders to view MACD signals from higher or lower timeframes directly on the current chart. The indicator also features a signal line and customizable histogram calculations based on RSI, CCI, and Stochastic methods. This gives traders more control over how momentum and trend strength are interpreted. A key feature is its Bollinger Band squeeze detection, which highlights squeeze conditions in blue. This helps identify periods of low volatility where the market may be preparing for a strong breakout move. Overall, this indicator combines trend, momentum, volatility, and multi-timeframe analysis into one powerful tool, making it useful for scalping, intraday trading, swing trading, and breakout strategies.
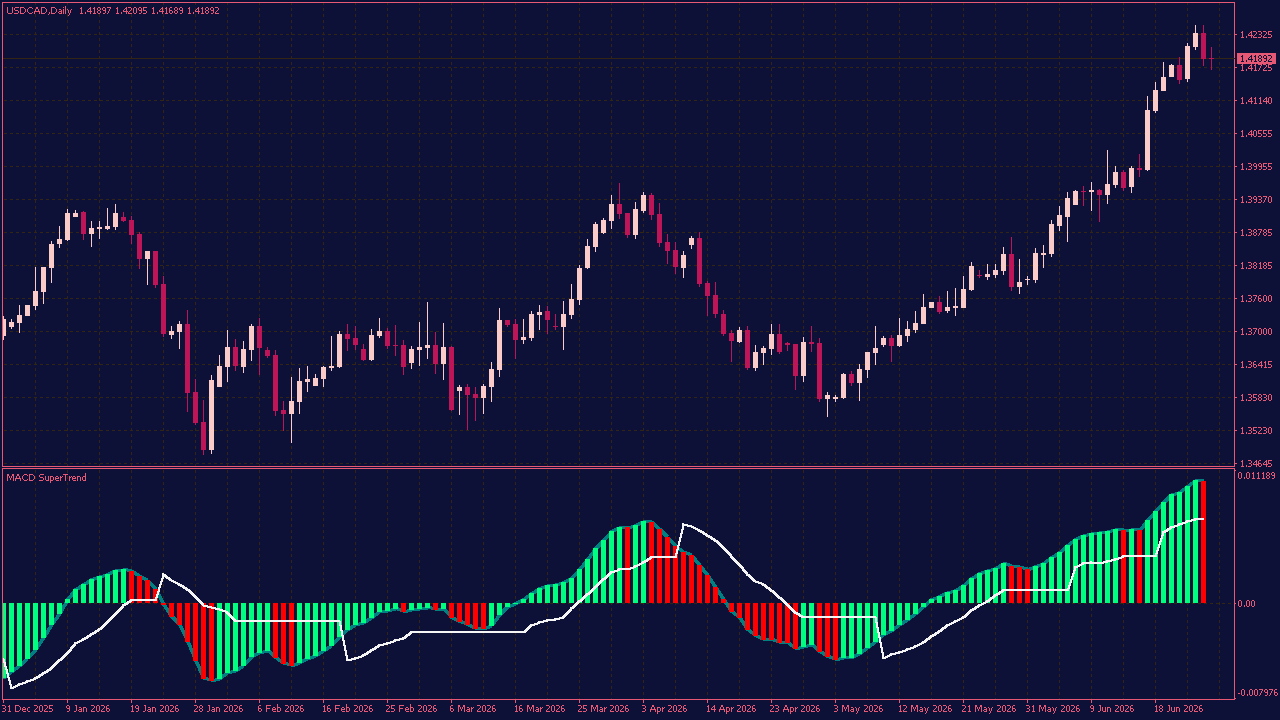
The MACD with Supertrend Indicator is a modified MACD indicator that uses the regular MACD together with Supertrend as the signal line. This creates a practical combination of momentum and trend direction, helping traders identify potential buy and sell opportunities more clearly. By using Supertrend as the signal line, the indicator becomes more trend-focused and may help filter out weaker signals. It can be useful for traders who want an additional confirmation tool when building or improving their trading strategy. The MACD with Supertrend Signal Line looks promising and can be used as part of your trading setup, especially when combined with proper risk management and your own market analysis.
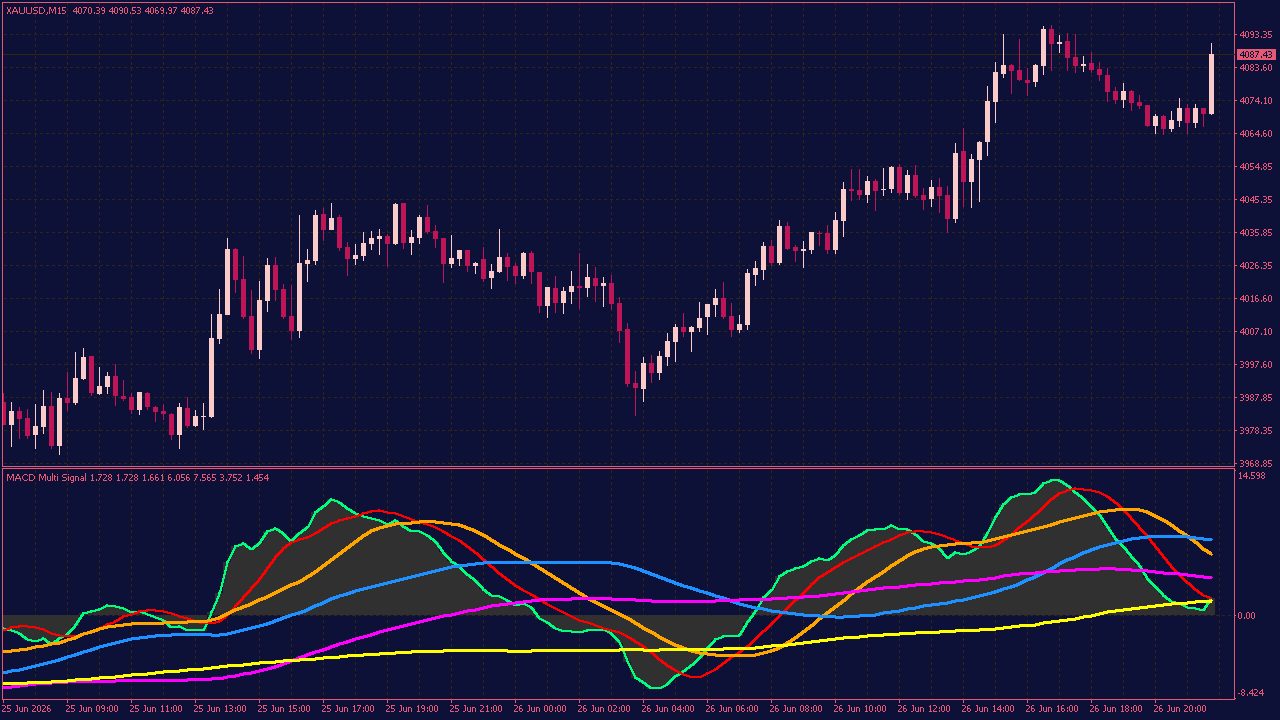
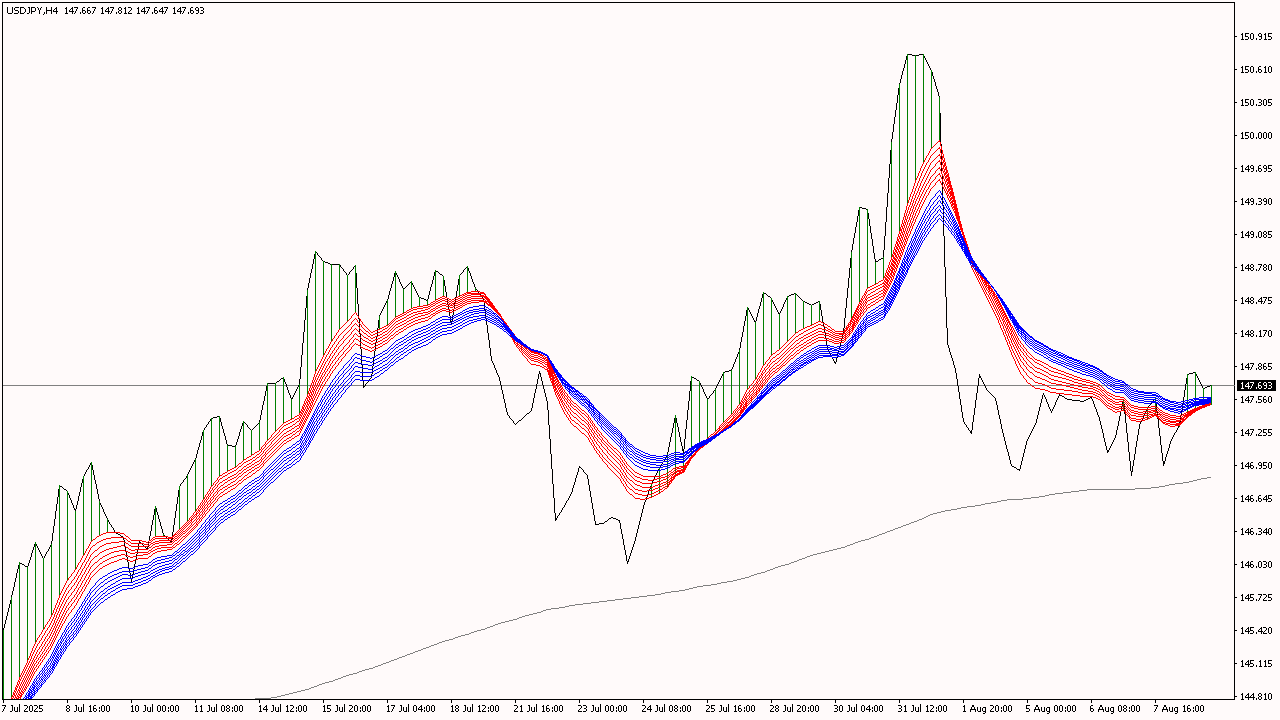
The MACD Multi Signal Indicator is a technical analysis tool used by traders to identify potential buy and sell signals in financial markets. It extends the traditional Moving Average Convergence Divergence by incorporating multiple signal lines, which help to confirm trends and reversals more effectively. Typically, it involves plotting the MACD line along with several signal lines derived from different moving averages, enabling traders to better gauge the strength and direction of a trend. This multi-layered approach aims to improve decision-making by reducing false signals and providing clearer entry and exit points.
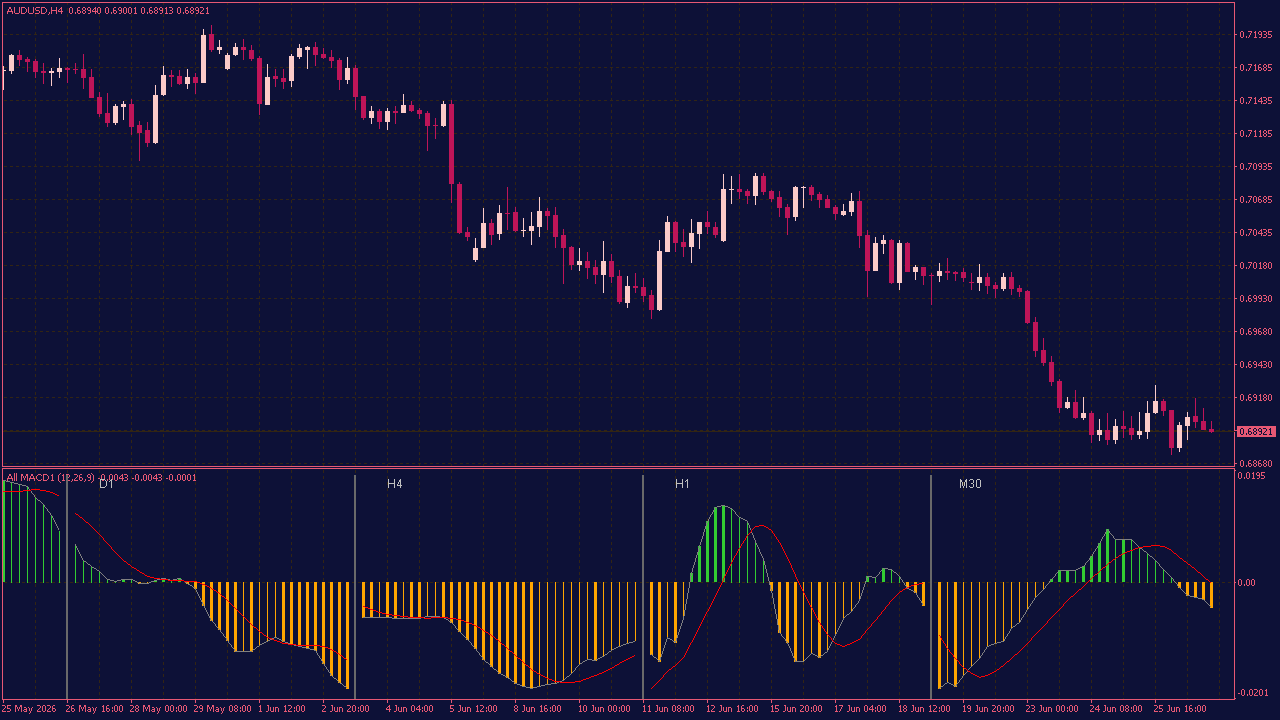
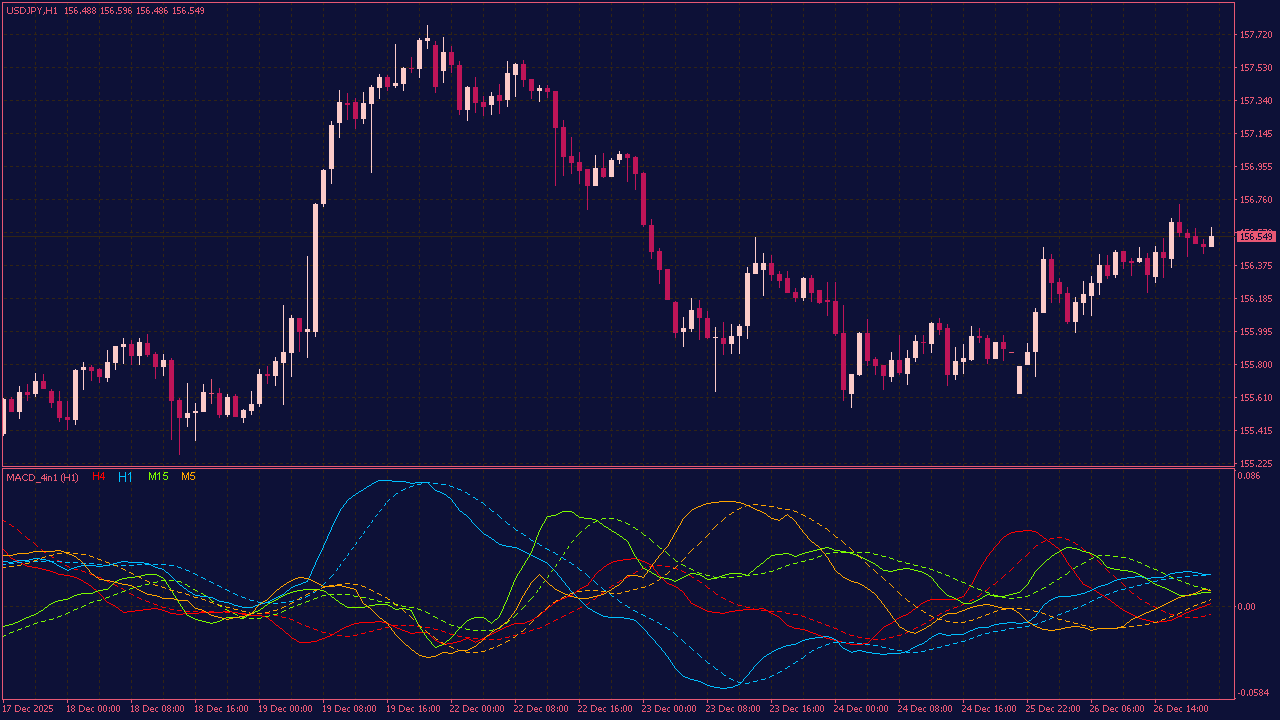
The All MACD Indicator displays MACD indicator values from multiple time frames in a separate subwindow. It allows traders to compare MACD movement, momentum, and market direction across different periods directly on one chart, without manually switching time frames. This indicator is designed for multi-timeframe MACD analysis and helps traders get a clearer overview of how the market behaves on lower and higher time frames. It does not generate direct buy or sell signals, but provides useful visual information for technical analysis.
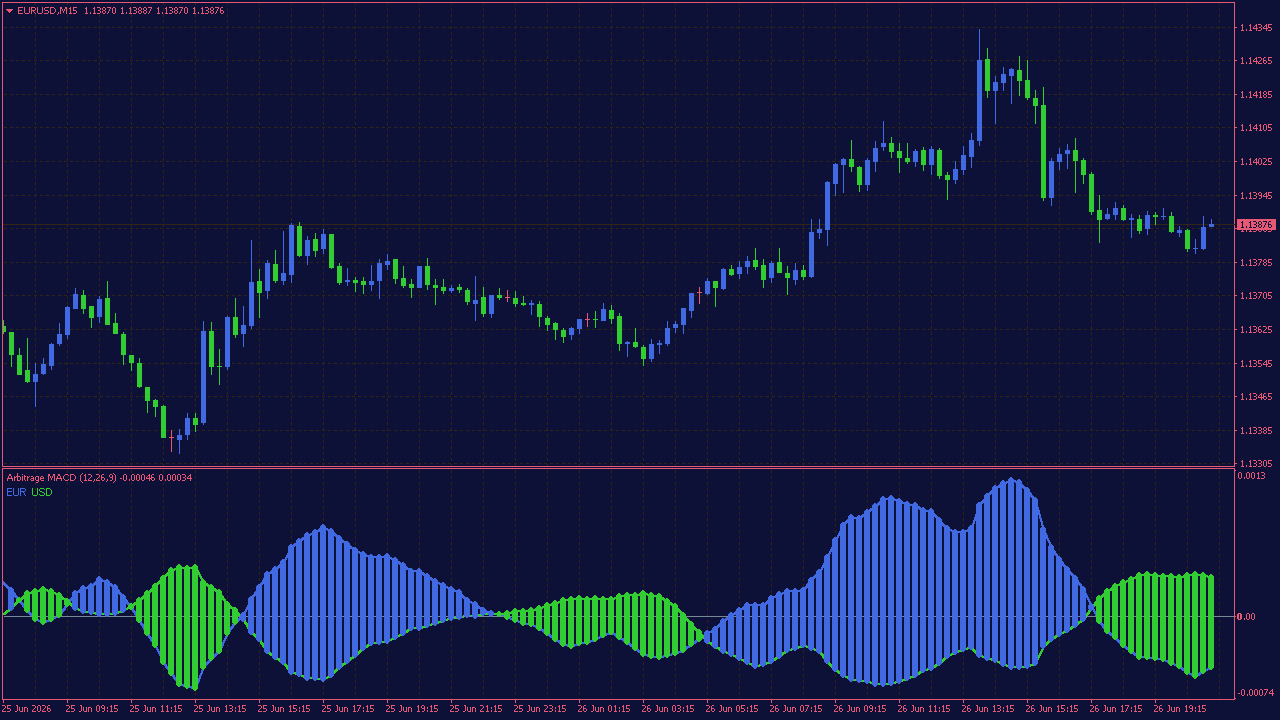
The Arbitrage MACD Indicator is a powerful momentum and trend-following trading tool designed to help traders analyze market direction and identify potential entry and exit opportunities. It uses MACD-based calculations to detect changes in trend strength, momentum shifts, and possible buy or sell signals. This indicator helps traders better understand whether the market is moving upward, downward, or losing momentum. It can be used across multiple markets, including forex, stocks, indices, commodities, and cryptocurrencies. For better accuracy, traders can combine it with support and resistance, price action, or other technical analysis tools.
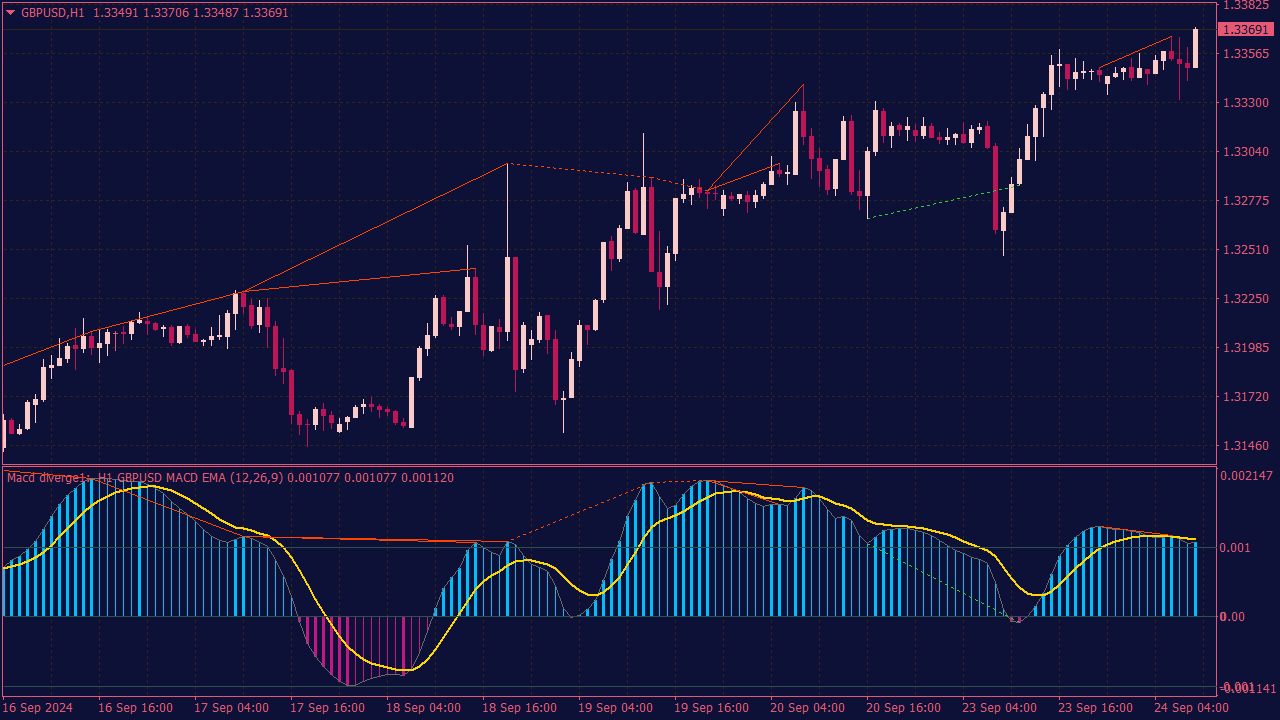
The MACD MTF Indicator with Alerts and Divergence is a versatile tool used by traders to analyze the Moving Average Convergence Divergence across different time frames, enhancing market insights. By incorporating alerts, traders can receive real-time notifications when MACD crossovers occur or when divergence signals appear, which are crucial for identifying potential reversals or momentum shifts. Divergence occurs when the price movement of an asset diverges from the MACD, indicating a possible trend reversal. This combination of features allows traders to make informed decisions based on both momentum and price behavior, improving their trading strategy and execution.
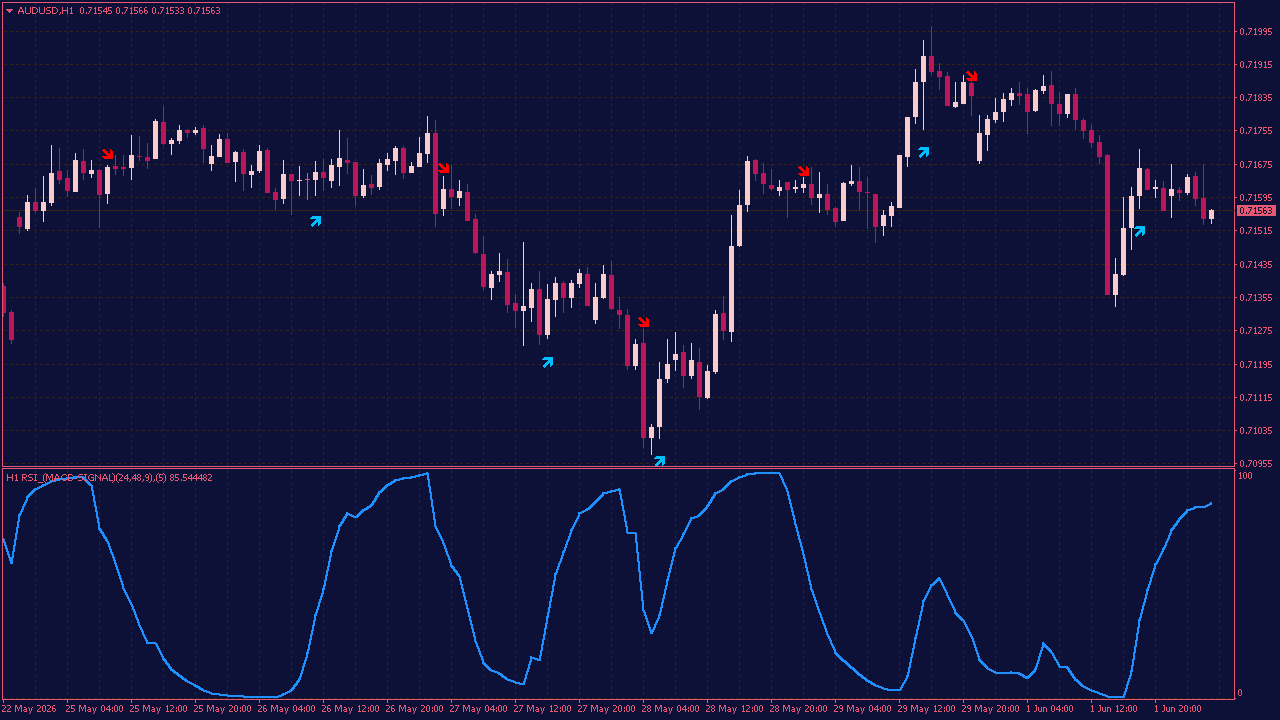
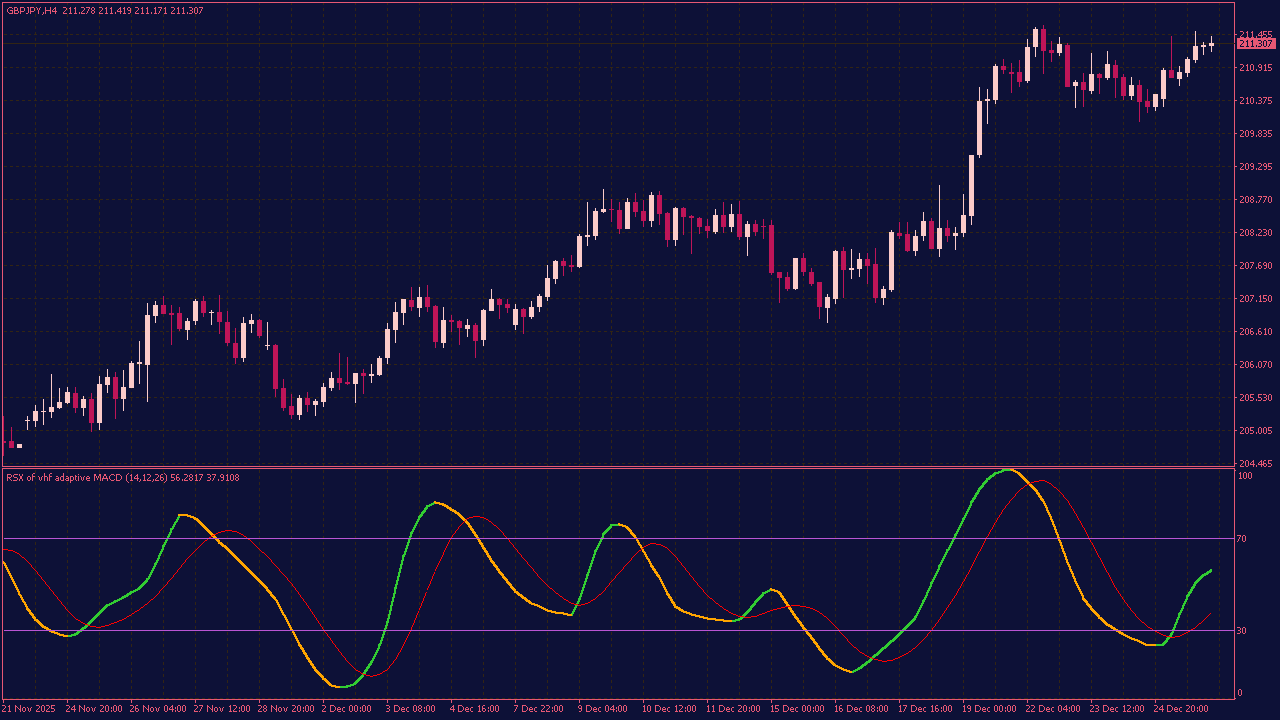
The RSI of MACD Signal MTF Indicator combines the RSI and MACD signals across multiple timeframes to identify potential trading opportunities, with visual arrows indicating buy or sell signals. It helps traders spot overbought or oversold conditions and trend reversals by analyzing MACD momentum filtered through RSI, while the arrows provide clear, immediate visual cues for optimal entry and exit points across different timeframes.
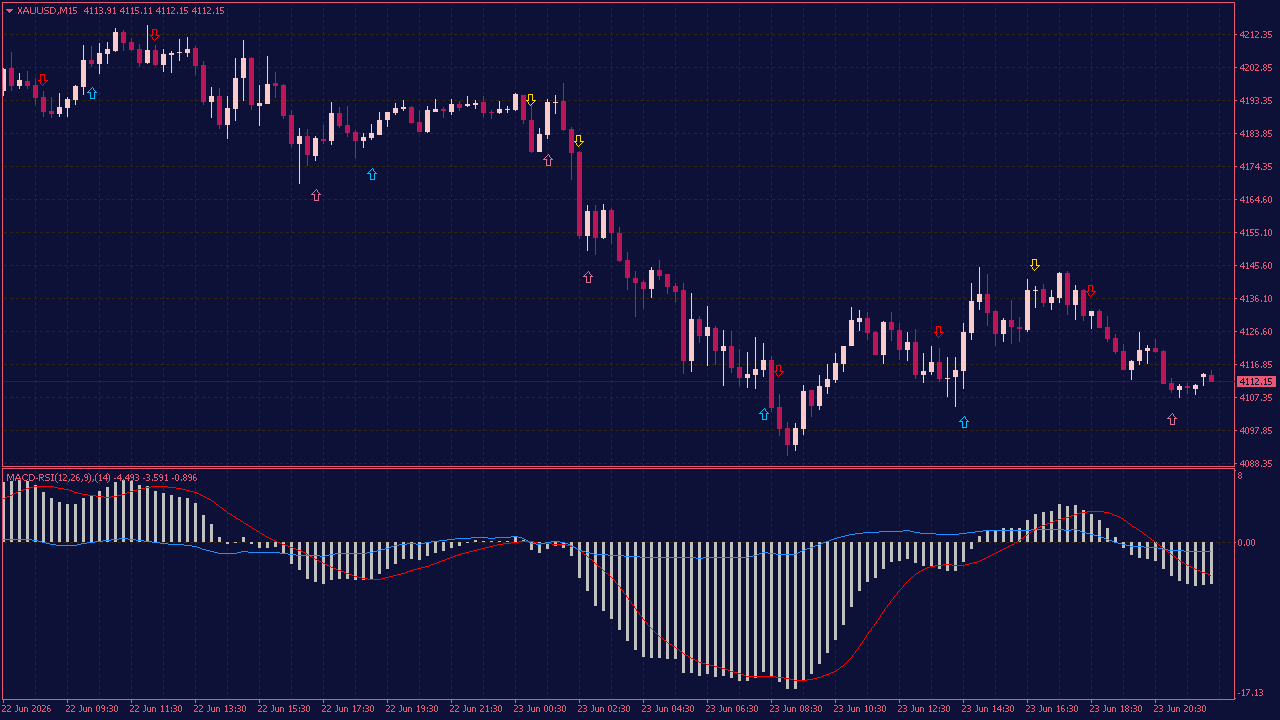
The MACD RSI Cross Indicator with Arrows is a technical analysis tool that combines the Moving Average Convergence Divergence and Relative Strength Index indicators to identify potential trend reversals and momentum shifts. It visually marks crossover points where the MACD line crosses its signal line and the RSI indicates overbought or oversold conditions, using arrows to highlight these signals on the chart. This aids traders in making more informed buy or sell decisions by clearly indicating convergence or divergence signals through intuitive arrow markers.
The MACD Indicator on Chart is a trend and momentum analysis tool that displays MACD signals directly on the price chart instead of a separate indicator window. Using color-coded histogram bars and moving average confirmation, it helps traders quickly identify bullish and bearish market conditions. Green bars indicate increasing bullish momentum, while red bars signal growing bearish pressure. By highlighting momentum shifts and trend changes in real time, the indicator assists traders in spotting potential entry and exit opportunities while staying aligned with the prevailing market direction.
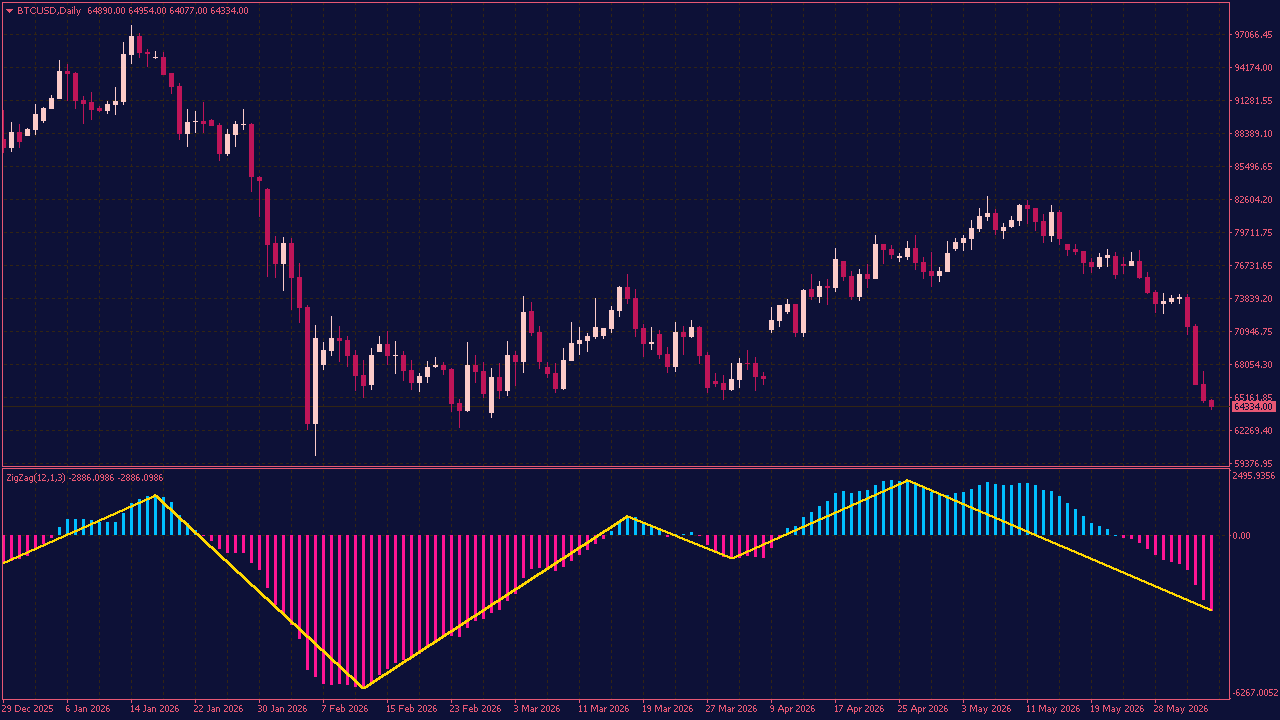
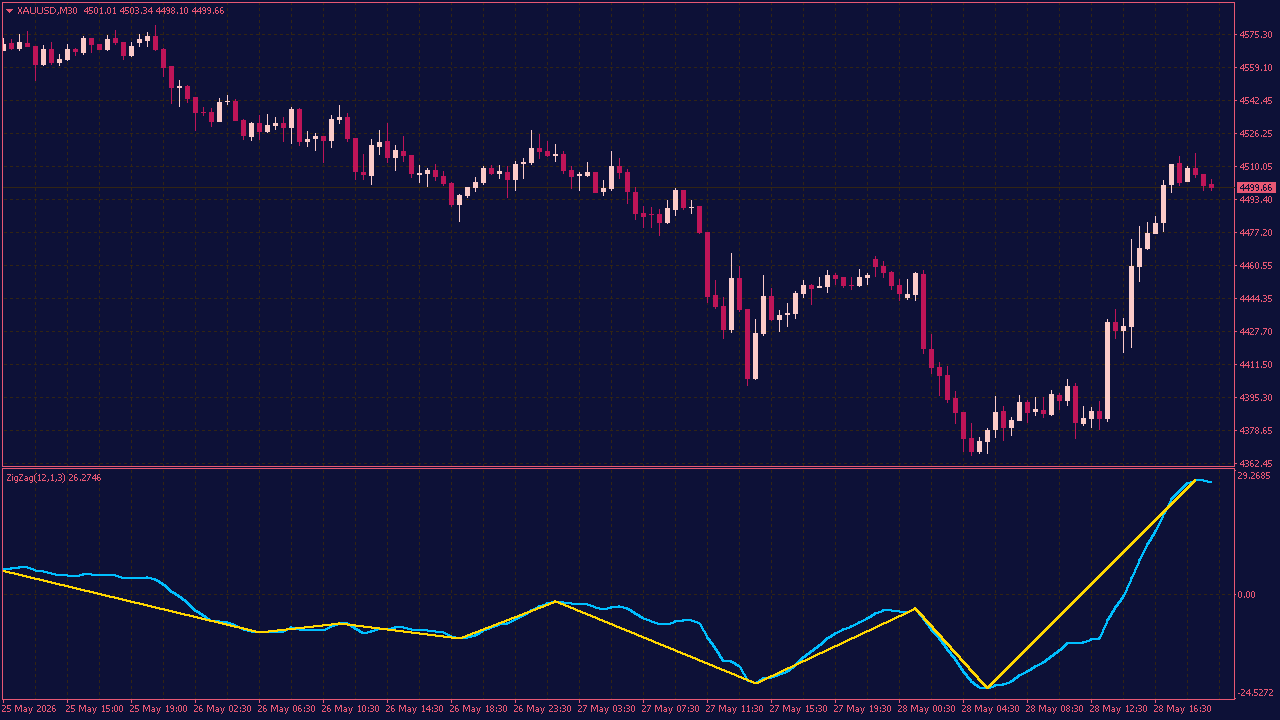
The ZigZag of the MACD indicator combined with a color histogram provides a clear visual representation of trend reversals and momentum changes. The ZigZag lines connect significant peaks and troughs in the MACD, filtering out minor fluctuations, while the color histogram highlights bullish or bearish momentum—blue for positive and red for negative. This setup helps traders identify key turning points and assess the strength of the trend more intuitively.
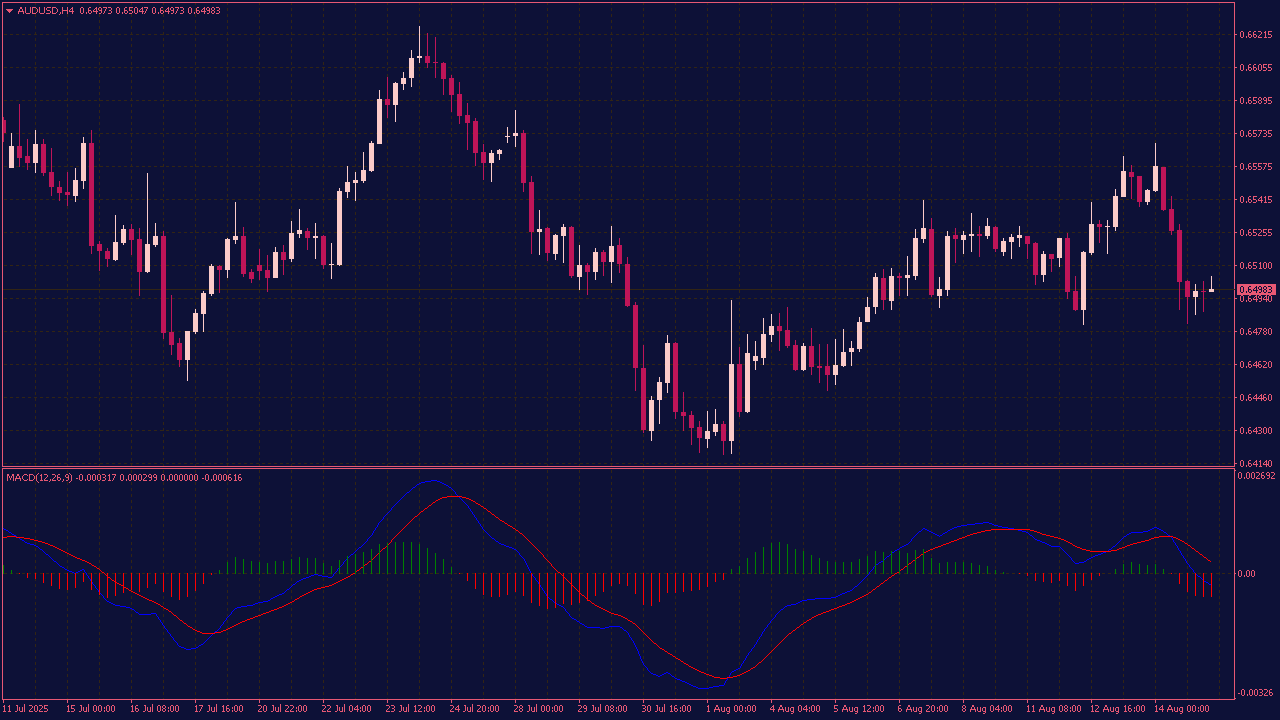
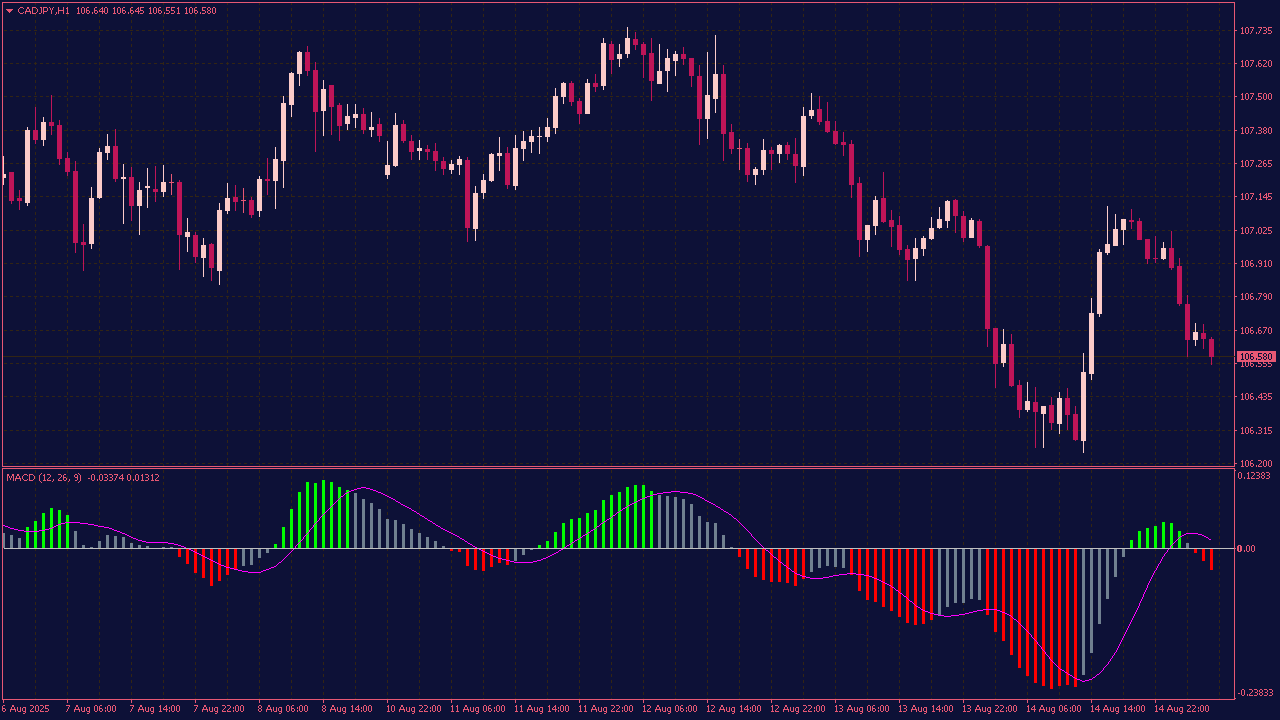
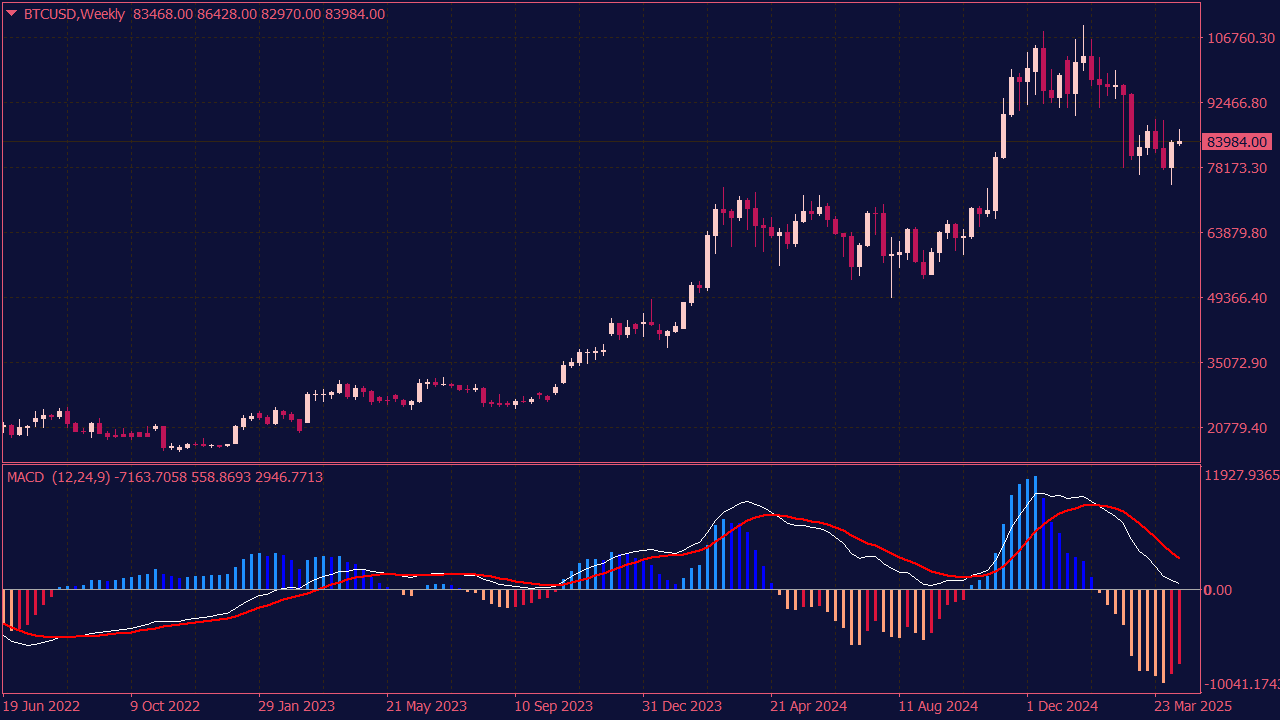
When using the traditional MACD with two lines (the MACD line and the signal line) and a histogram, traders should look for crossovers as key signals: a bullish signal occurs when the MACD line crosses above the signal line, especially if the histogram shifts from negative to positive, indicating increasing upward momentum; conversely, a bearish signal is when the MACD line crosses below the signal line, with the histogram moving from positive to negative, suggesting downward momentum. It's important to confirm these signals with volume, trend analysis, and other indicators to reduce false signals, and to watch for divergence between MACD and price action, which can signal potential reversals. Using the histogram's height and its changes can also help gauge the strength of the trend, with larger bars indicating stronger momentum.
The MTF MACD Classic Indicator is a multi-timeframe version of the classic MACD tool that helps traders analyze momentum, trend direction, and potential reversals across different timeframes. It displays MACD signals from higher or selected timeframes directly on the current chart, making it easier to confirm trends, filter weaker signals, and spot better trading opportunities without constantly switching between charts.
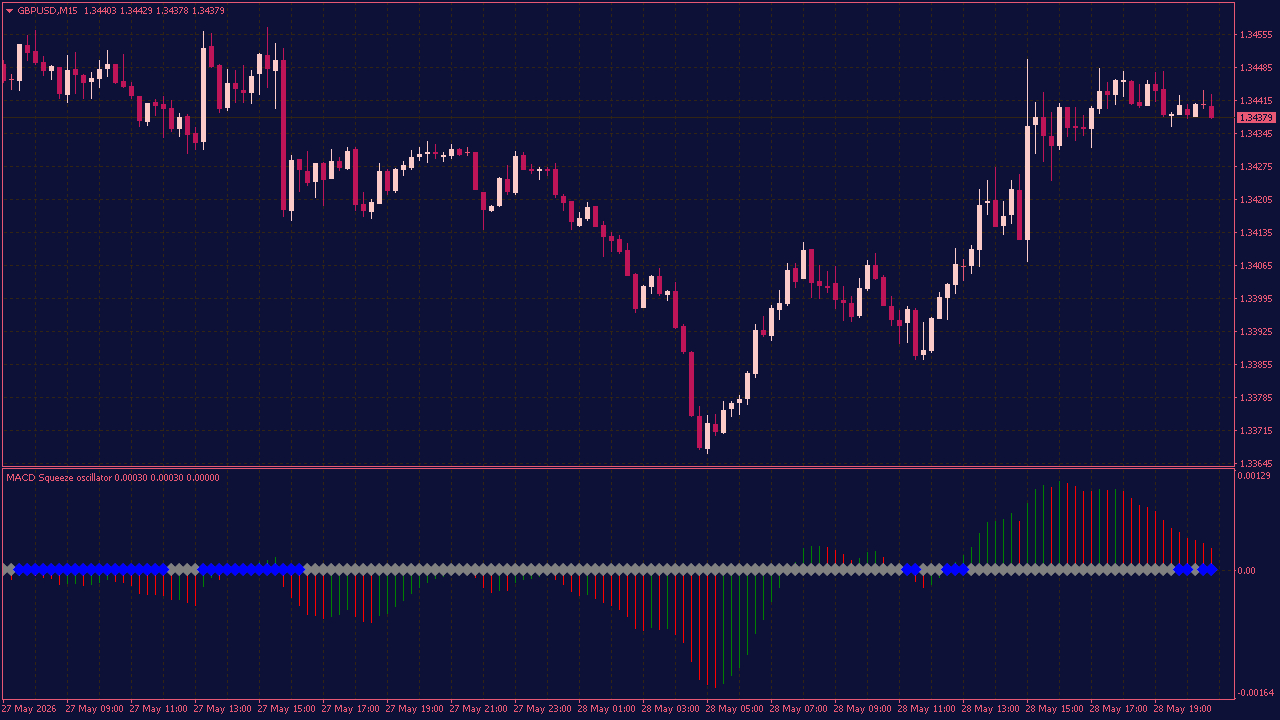
The MACD Squeeze Indicator is a trading tool that combines the MACD with volatility indicators like Bollinger Bands or Keltner Channels to identify periods of low volatility, known as "squeezes", which often lead to substantial price movements. When the MACD lines converge and the Bollinger Bands or Keltner Channels contract, it signals an impending breakout, alerting traders to potential trend shifts. This helps traders anticipate and capitalize on significant market moves by providing early warning of increased volatility.
The ZigZag of the MACD indicator is a technical analysis tool that plots a zigzag pattern on the MACD chart by connecting significant peaks and troughs, filtering out smaller price movements. This visualization helps traders easily identify major trend reversals, momentum shifts, and divergence signals, making it easier to interpret the overall trend and potential turning points in the market.
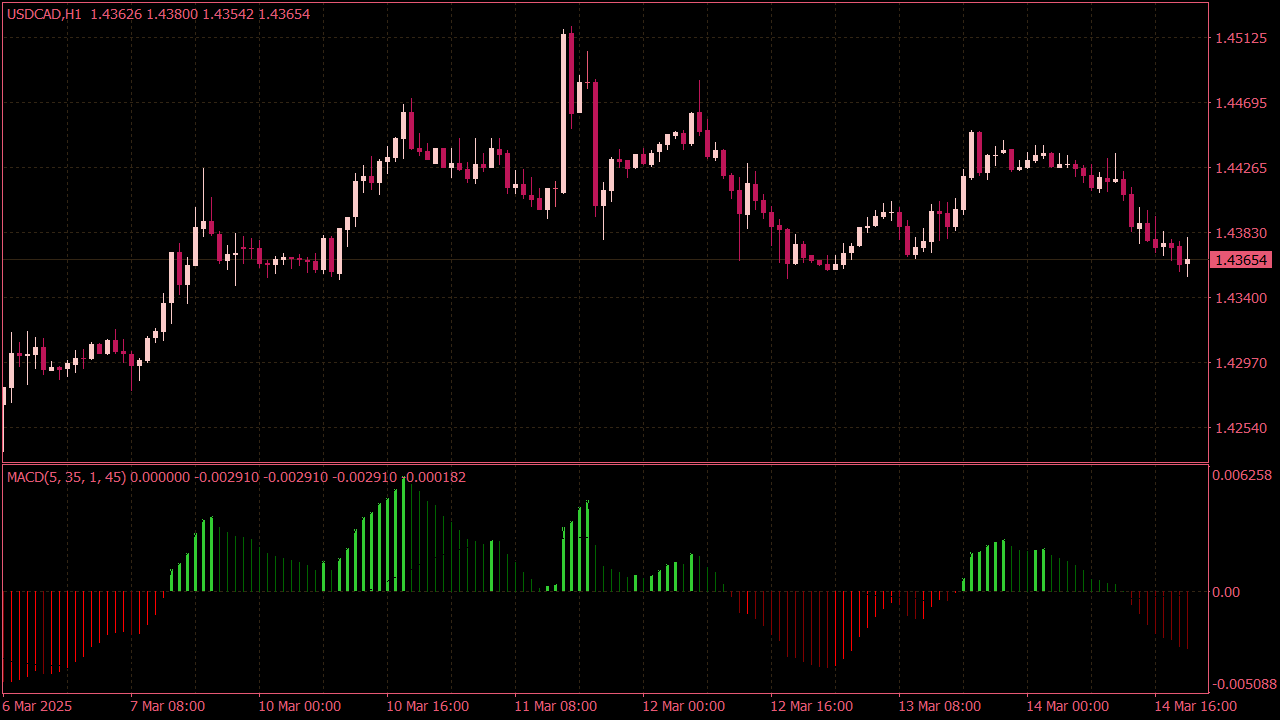
The MACD Colored Histogram Indicator is a variation of the traditional Moving Average Convergence Divergence that visually enhances the histogram by using different colors to represent bullish and bearish momentum, making it easier for traders to identify trend reversals and strength at a glance. Typically, green bars indicate increasing bullish momentum, while red bars signal increasing bearish momentum, providing clear visual cues for trading decisions. This customization helps traders quickly interpret market momentum shifts without scrutinizing the numerical values, thereby improving the speed and accuracy of technical analysis.
The MACD on Chart indicator displays the MACD lines and signal lines directly on the price chart, offering a clear view of momentum shifts, crossovers, and trend changes without switching between separate windows. This helps traders quickly identify buy and sell signals in real-time.
The MACD Color Candles Indicator is a technical analysis tool that combines the Moving Average Convergence Divergence indicator with candlestick charting to provide visual cues about market momentum and potential trend reversals. By overlaying color-coded candles based on MACD signals (such as blue for bullish momentum and gray for bearish) traders can quickly identify entry and exit points, trend strength, and possible reversals, enhancing decision-making efficiency in trading strategies.
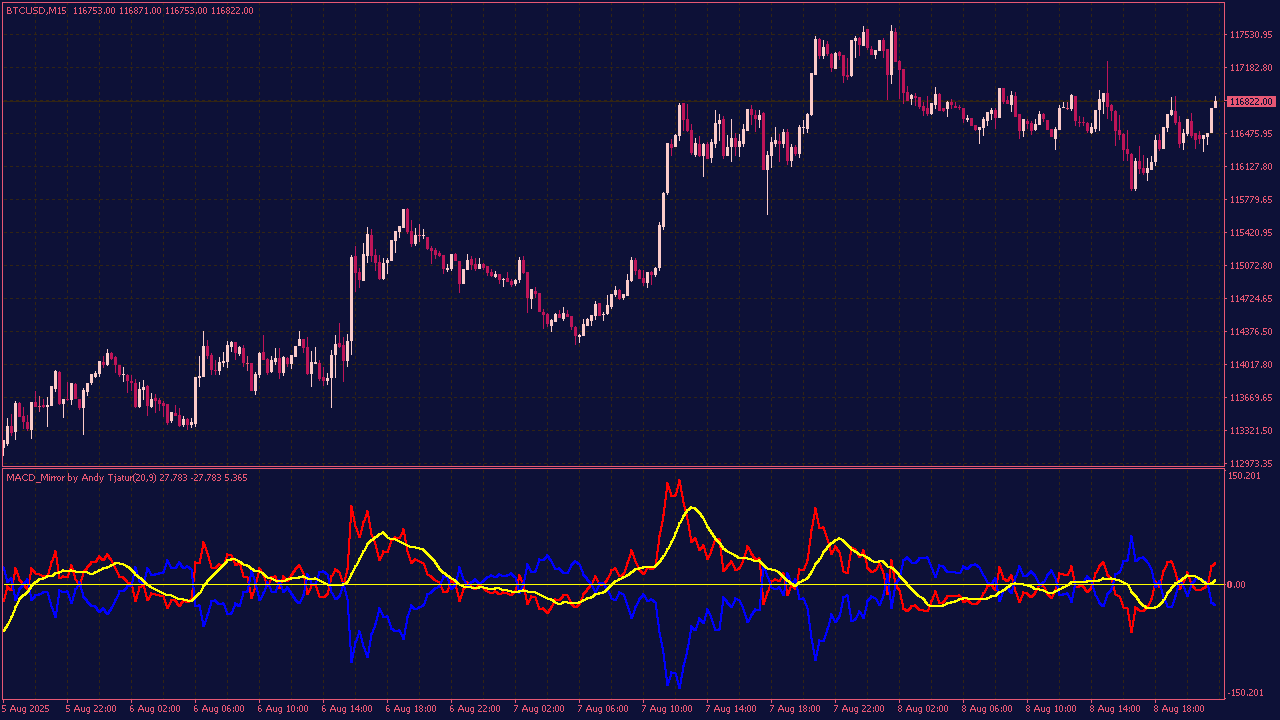
The MACD Mirror is a momentum-based trading indicator that improves upon the traditional MACD by using the Close–Open price difference instead of relying only on closing prices. This creates a more responsive and accurate view of market direction by highlighting the real strength of bullish or bearish candles. Designed for simplicity and precision, the MACD Mirror helps traders identify early trend reversals, filter out noise, and make clearer entry and exit decisions — especially in fast-moving markets like forex.
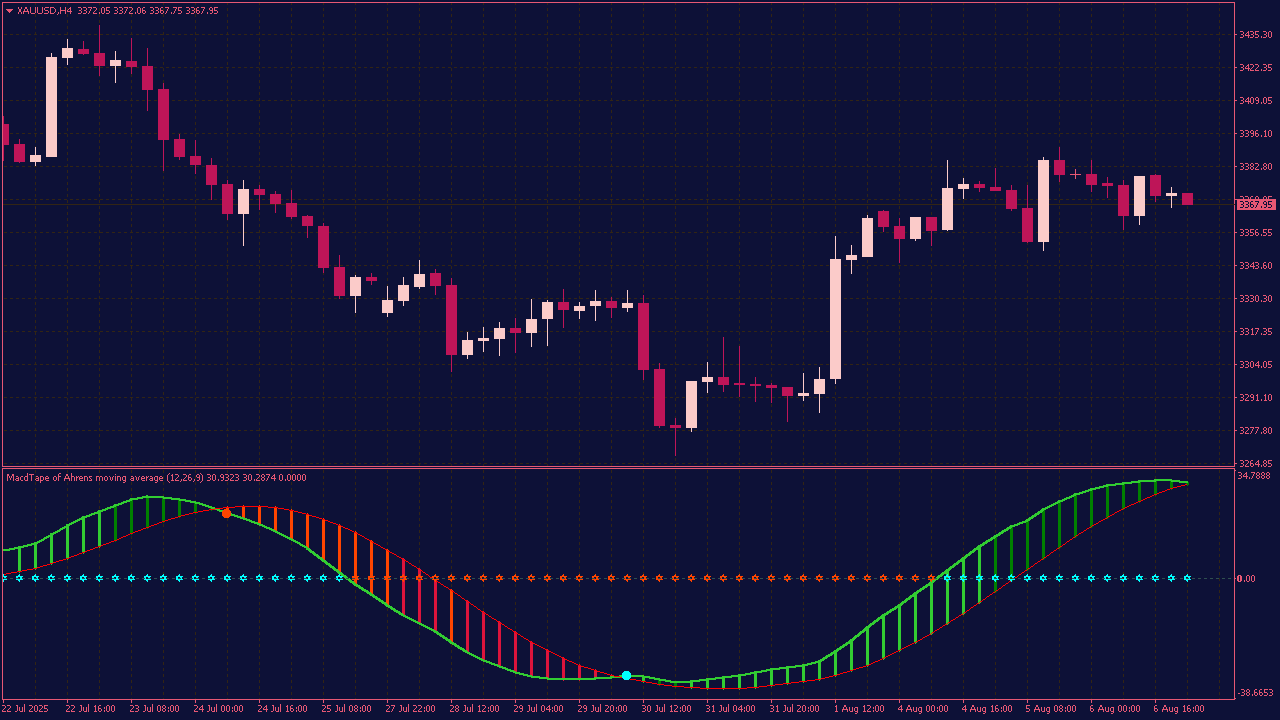
The MACD Tape MTF Indicator with Averages and Lines is a technical analysis tool that combines the MACD histogram (as a colored tape), moving averages, and multi-timeframe functionality. It visually represents momentum shifts with color-coded bars (the "tape"), overlays MACD signal and average lines, and allows users to monitor MACD trends from higher timeframes on a single chart - making it useful for spotting trend alignment and potential entries or exits across different timeframes.
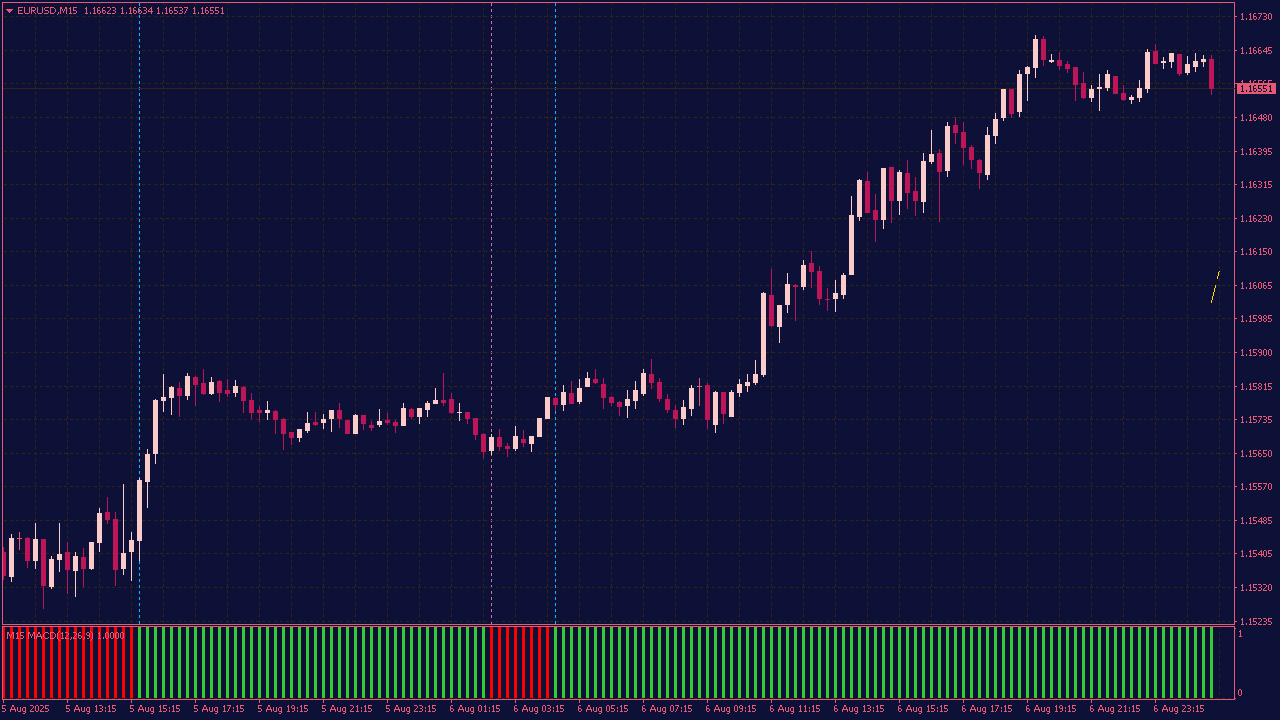
MACD MTF Histogram Indicator with Lines and Alerts
The MACD MTF Histogram Indicator with Lines and Alerts is a multi-timeframe technical analysis tool that displays the MACD histogram from a selected higher timeframe on your current chart. It helps identify trend strength and momentum across timeframes. The indicator also includes built-in alerts that notify you when bullish or bearish MACD crossovers occur, allowing for timely trading decisions.
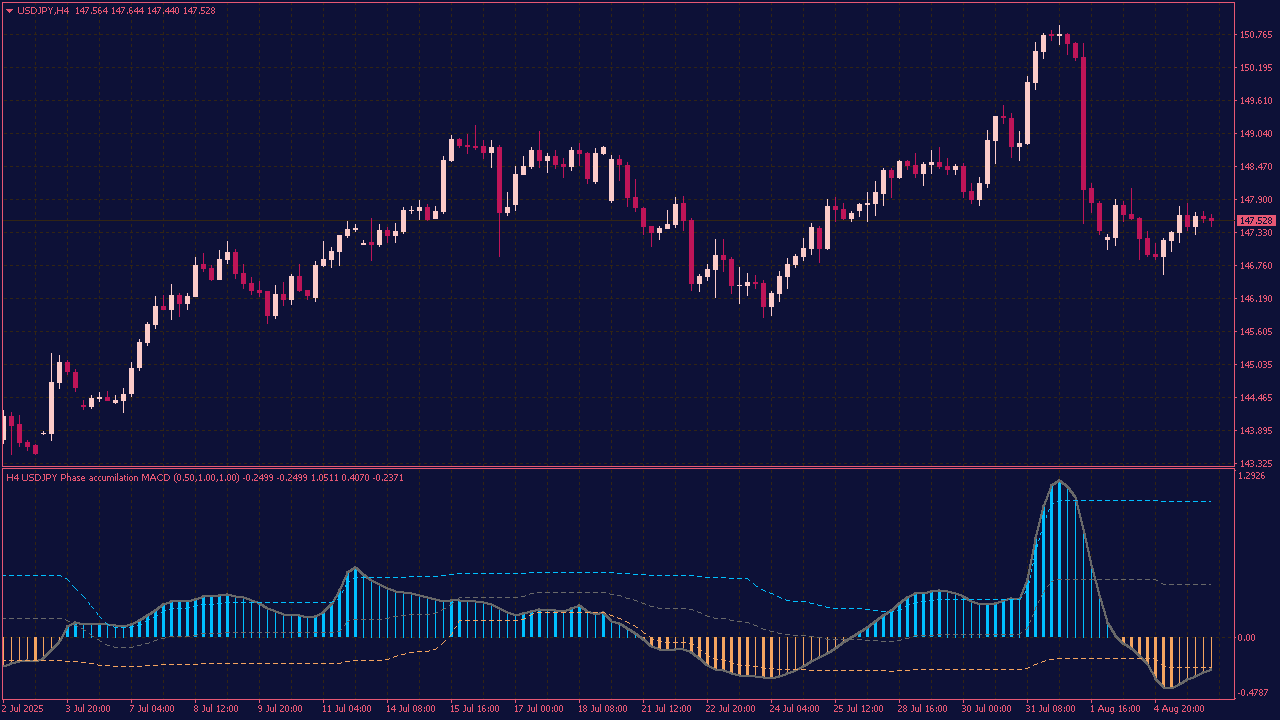
The Phase Accumulation MACD with Floating Levels is an advanced version of the traditional MACD indicator that incorporates cycle analysis (phase accumulation) and dynamic threshold lines (floating levels). It enhances signal accuracy by detecting trend strength and timing using adaptive levels, rather than fixed ones. Ideal for multi-timeframe analysis, it helps traders filter out noise and better identify entry/exit points in changing market conditions.
The MACD DSL (Discontinued Signal Lines) is an enhanced version of the traditional MACD indicator that adds upper and lower threshold levels (DSLs) to filter out weak signals. It highlights stronger bullish or bearish momentum only when the MACD line crosses beyond these levels, helping traders reduce noise and focus on significant trend shifts.
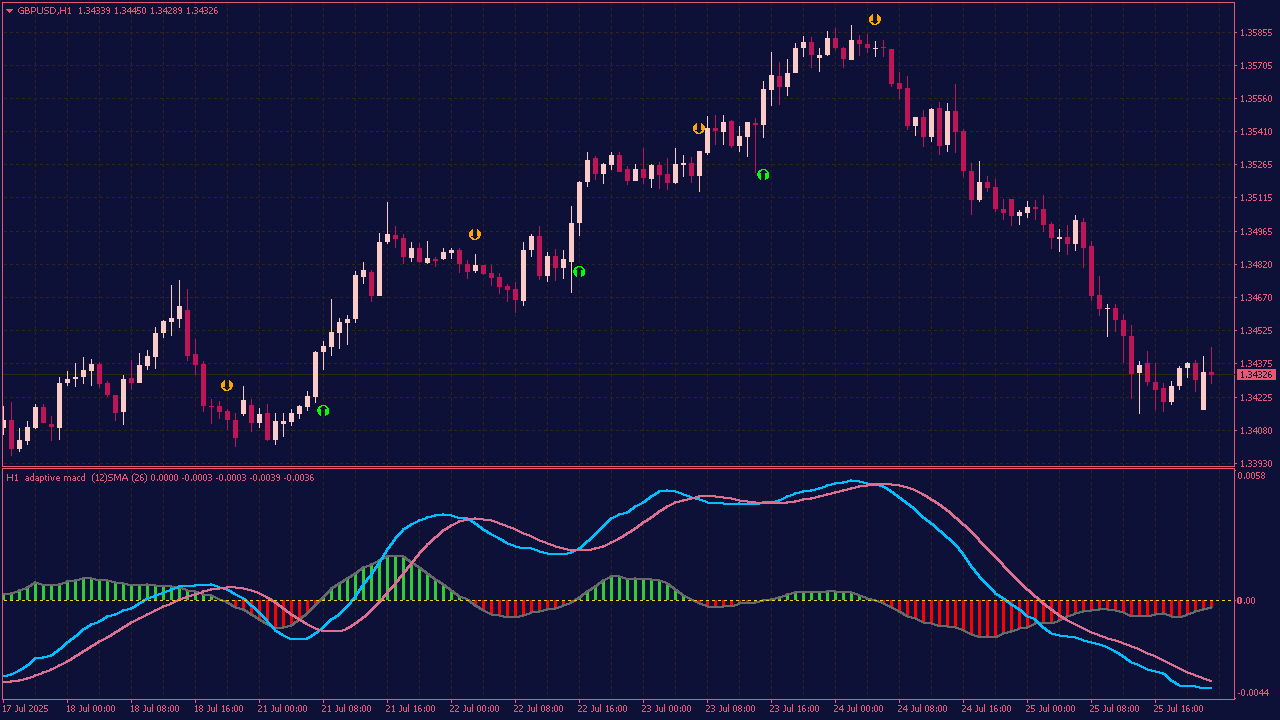
The Adaptive MACD MTF with Alerts and Arrows is an advanced MACD indicator that adjusts to market conditions and works across multiple timeframes. It provides real-time alerts for key signals like crossovers, while also marking entry points with arrows on the chart. This combination helps traders spot trends more accurately and react promptly to market changes.
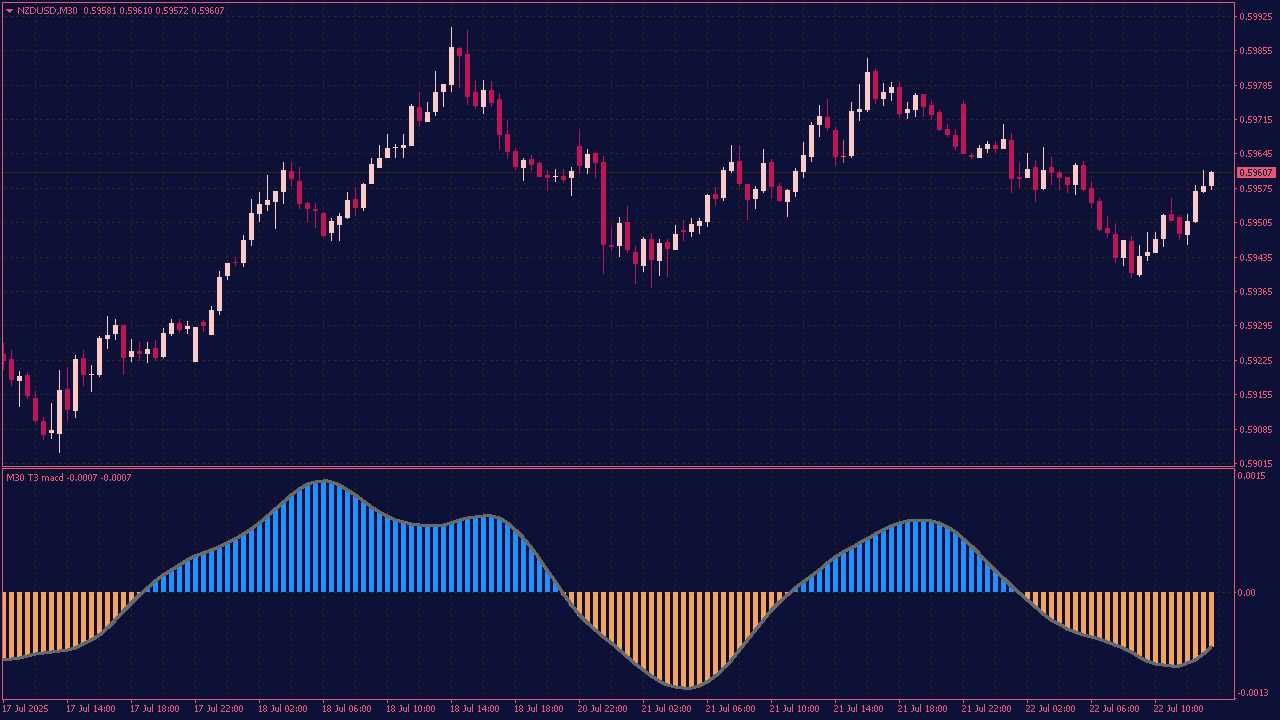
The T3 MACD MTF with Alerts is a custom indicator that combines the smooth, low-lag T3 moving average with the classic MACD oscillator. It supports multi-timeframe analysis, allowing users to track higher timeframe trends on a lower timeframe chart. The indicator includes real-time alerts for MACD signal line crossovers, helping traders spot momentum shifts and trend confirmations efficiently. Ideal for filtering noise and enhancing signal accuracy in trend-following strategies.
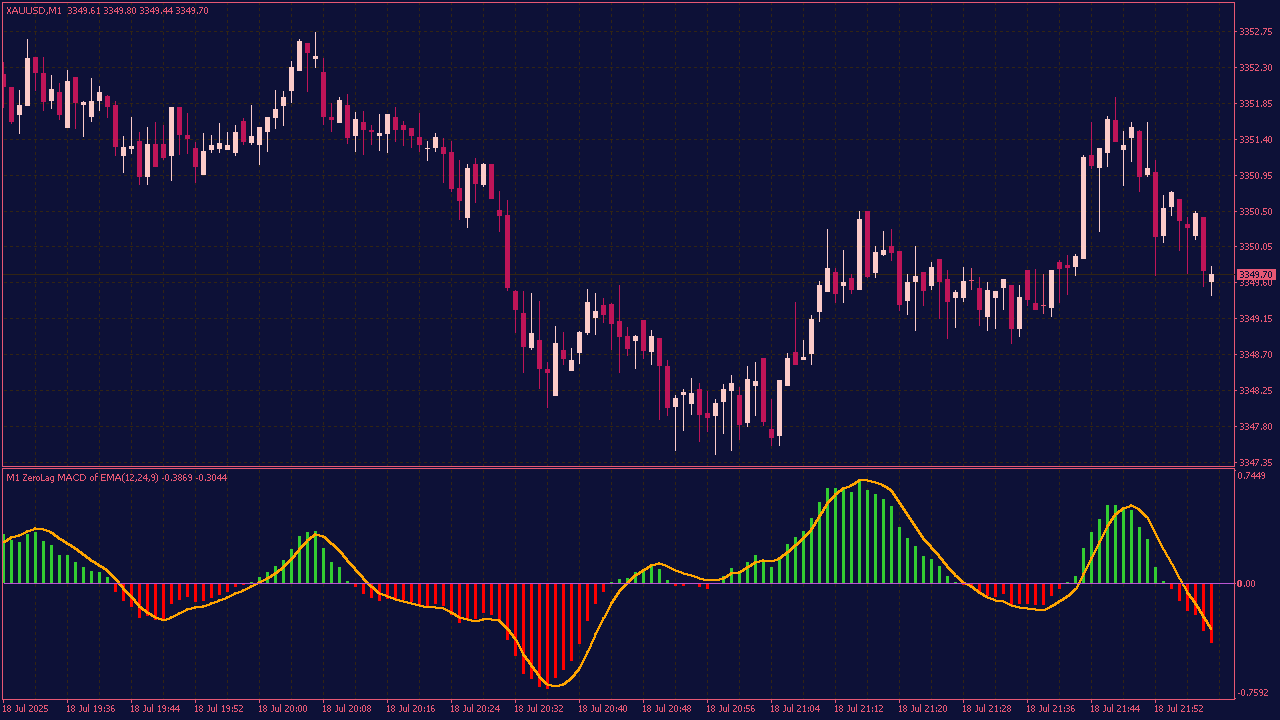
The Zero Lag MACD is a faster, more responsive version of the traditional MACD indicator. It uses advanced moving averages to reduce lag, helping traders detect trend changes and momentum shifts earlier for better entry and exit timing.
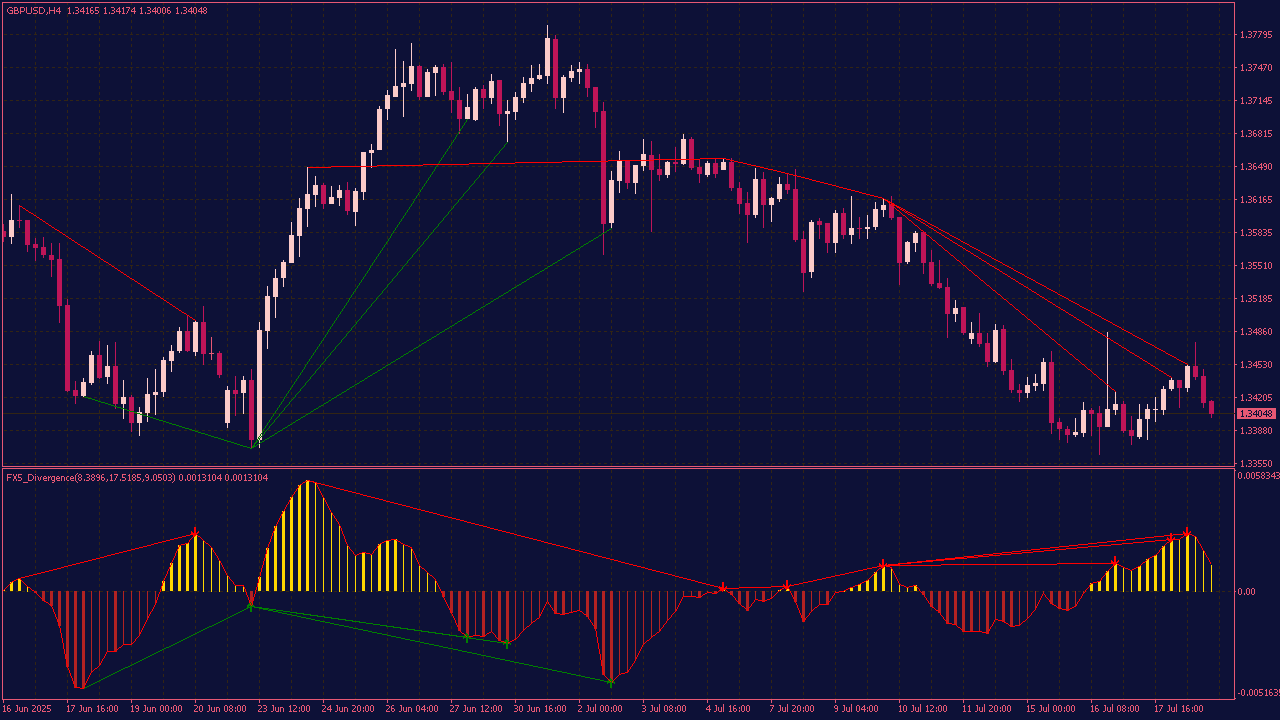
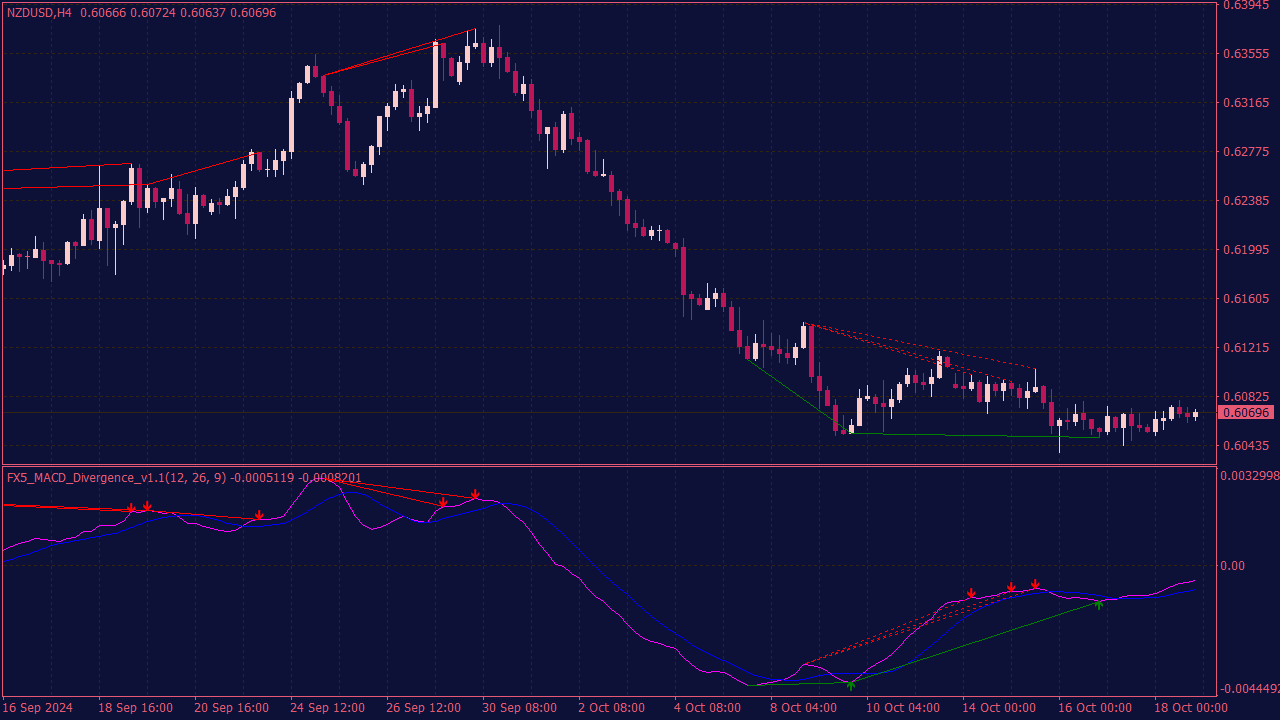
The FX5 DEMA MACD Divergence Indicator automatically identifies bullish and bearish divergences between price and the MACD oscillator using Double Exponential Moving Average smoothing. It highlights both regular and hidden divergences with clear visual signals and offers alerts for timely trade entries. Designed to be non-repainting, it helps traders spot potential trend reversals and continuations with greater accuracy.
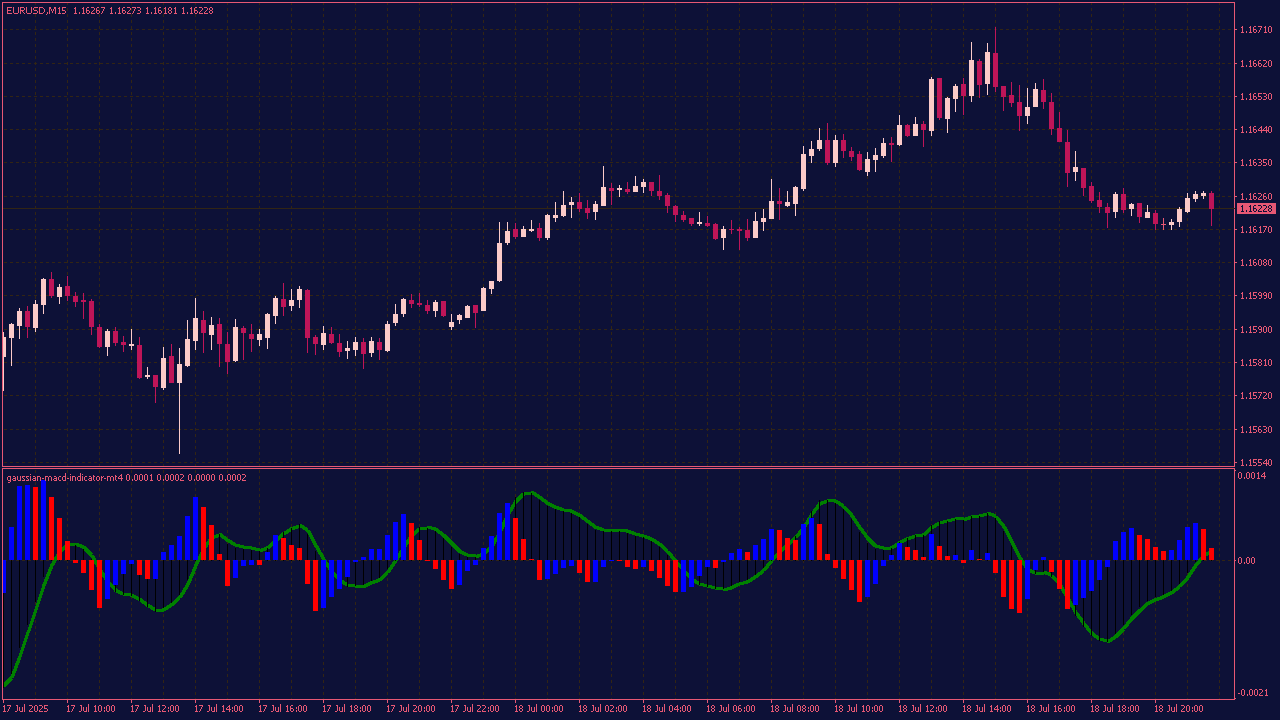
The Gaussian MACD is a variation of the standard MACD that uses Gaussian filters instead of traditional exponential moving averages (EMAs). Gaussian filters smooth price data more effectively, reducing noise while maintaining responsiveness. This results in cleaner signals, helping traders better identify trend direction and momentum shifts with reduced lag and fewer false signals.
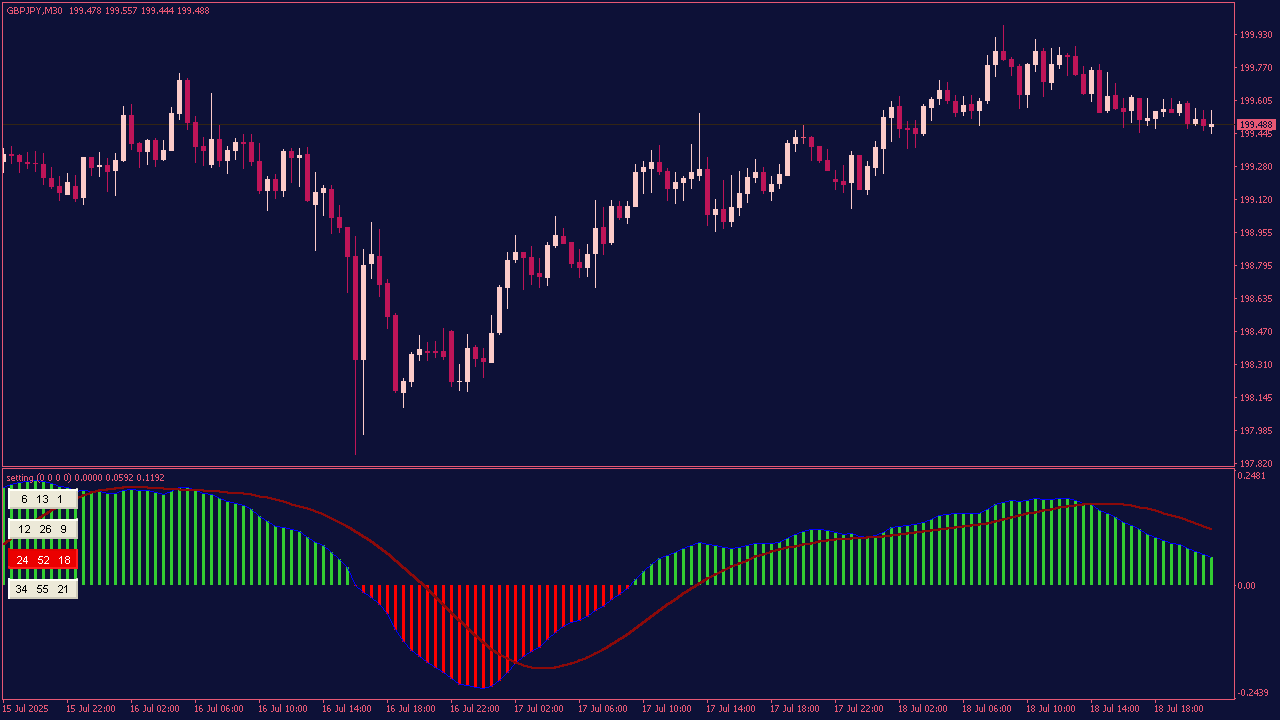
The Multi-MACD Indicator with buttons lets traders quickly switch between different MACD period settings directly on the chart. By using on-chart buttons (or dropdown controls), users can toggle predefined MACD configurations (such as short-term, standard, and long-term periods) enabling fast comparison of momentum across multiple timeframes without manual input changes. This interactive tool simplifies trend analysis and improves decision-making efficiency.
The MACD of MACD is a custom momentum indicator that applies the MACD calculation to the MACD line itself, rather than directly to price. This layered approach reveals the momentum of the momentum, offering deeper insight into trend strength and potential reversals. It can help spot early trend shifts or confirm existing signals when used alongside traditional MACD or price action analysis.
The MACD Pivots MTF Indicator is a trading tool that combines the MACD oscillator with pivot points across multiple timeframes. It helps traders identify key support and resistance levels alongside momentum shifts, providing clearer signals for potential trend reversals or continuations. The indicator includes visual cues and alerts for MACD crossovers and pivot point breaks, enhancing decision-making on any timeframe.
The MACD x3 MTF Indicator displays three MACD indicators simultaneously, each calculated on different timeframes. This allows traders to monitor momentum and trend strength across short-, medium-, and long-term periods all on one chart. By comparing multiple MACD signals from different timeframes, traders get a clearer picture of market direction and potential trade opportunities, improving timing and confirmation for entries and exits.
The Adjustable MACD with 4-Color Histogram is an enhanced MACD indicator that allows full customization of MACD parameters and uses four distinct colors in the histogram to clearly visualize:
MACD above Signal & rising (bullish momentum increasing).
MACD above Signal & falling (bullish but weakening).
MACD below Signal & falling (bearish momentum increasing).
MACD below Signal & rising (bearish but weakening).
This color-coded system makes it easier to quickly assess trend direction, momentum strength, and potential reversal zones at a glance.
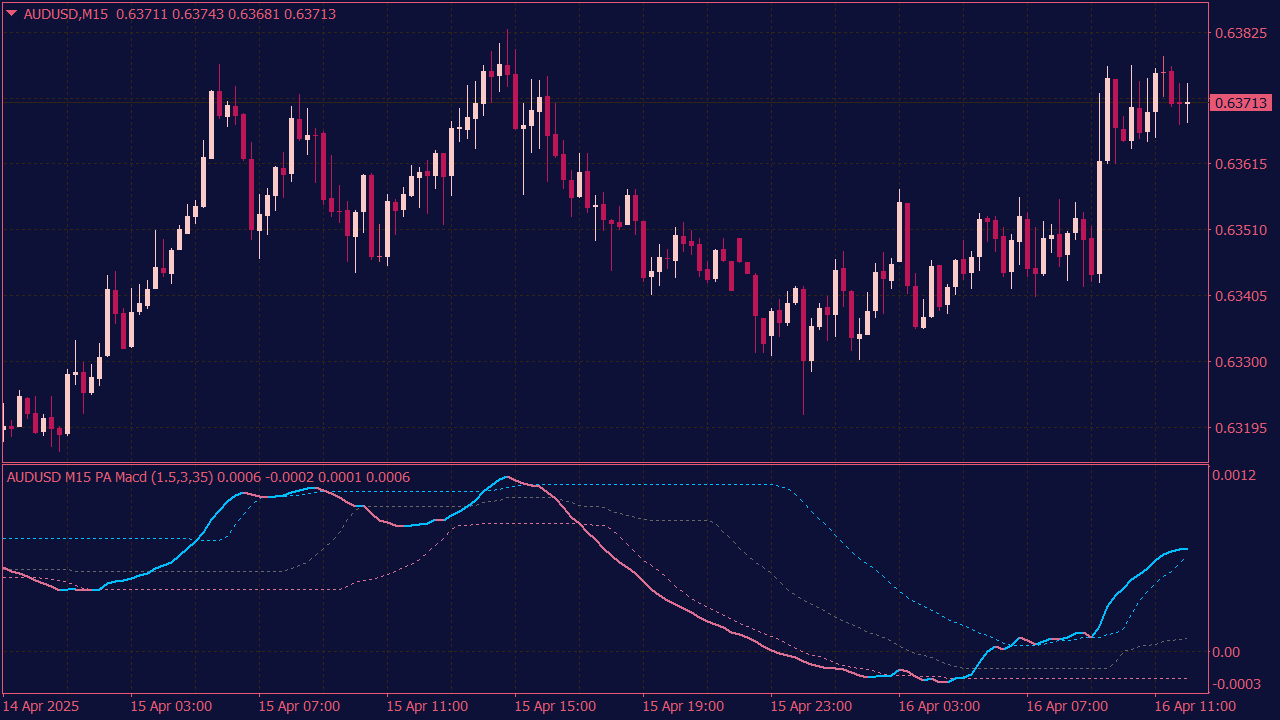
The PA Adaptive MACD Indicator is a dual-adaptive MACD indicator that adjusts to market conditions using Hilbert Transform-based phase accumulation for independently adaptive fast and slow periods. Signal logic is enhanced with dynamic, adaptive thresholds (floating or quantile-based) instead of static zero-line crosses. Includes multi-timeframe support, alerts, slope-based momentum, and optional on-chart arrows for visual signals.
The MACD Cross Indicator with Arrows and Alerts plots arrows on the chart to signal bullish and bearish crossovers between the MACD line and the signal line. It also includes alert conditions, allowing traders to receive notifications when these momentum shifts occur, helping to identify potential entry and exit points more effectively.
The MACD Advanced with Floating Levels is an enhanced version of the traditional Moving Average Convergence Divergence indicator. It features dynamic or floating levels for overbought and oversold conditions, adapting based on the price action and market volatility. This version aims to provide more accurate signals by adjusting thresholds in real-time, rather than relying on fixed levels. Traders can use this to better identify potential entry and exit points, as it accounts for changing market conditions.
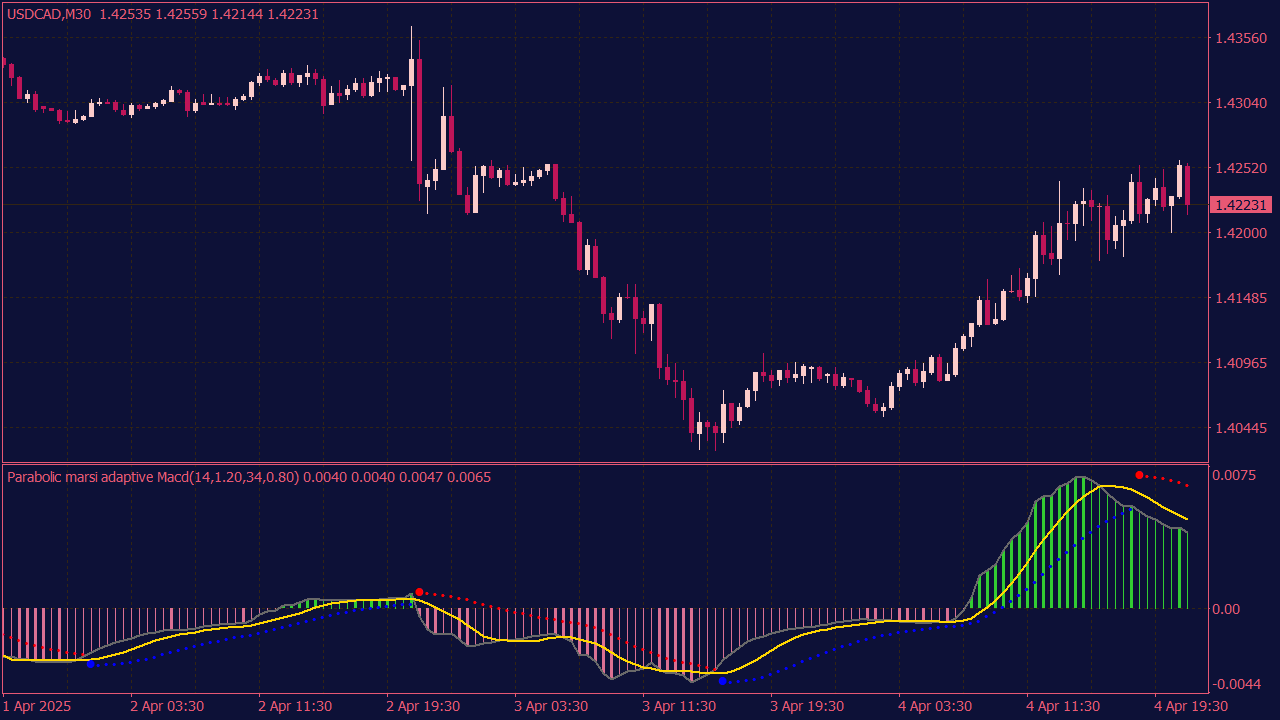
The Parabolic Marsi Adaptive MACD is an advanced variation of the traditional MACD indicator that integrates adaptive moving averages influenced by the Parabolic SAR and Marsi’s methodology. This indicator dynamically adjusts its smoothing periods based on price action and trend strength, aiming to enhance the accuracy of momentum and trend reversal signals. By combining parabolic acceleration concepts with adaptive MACD calculations, it provides traders with a responsive tool for identifying high-probability entry and exit points in trending markets.
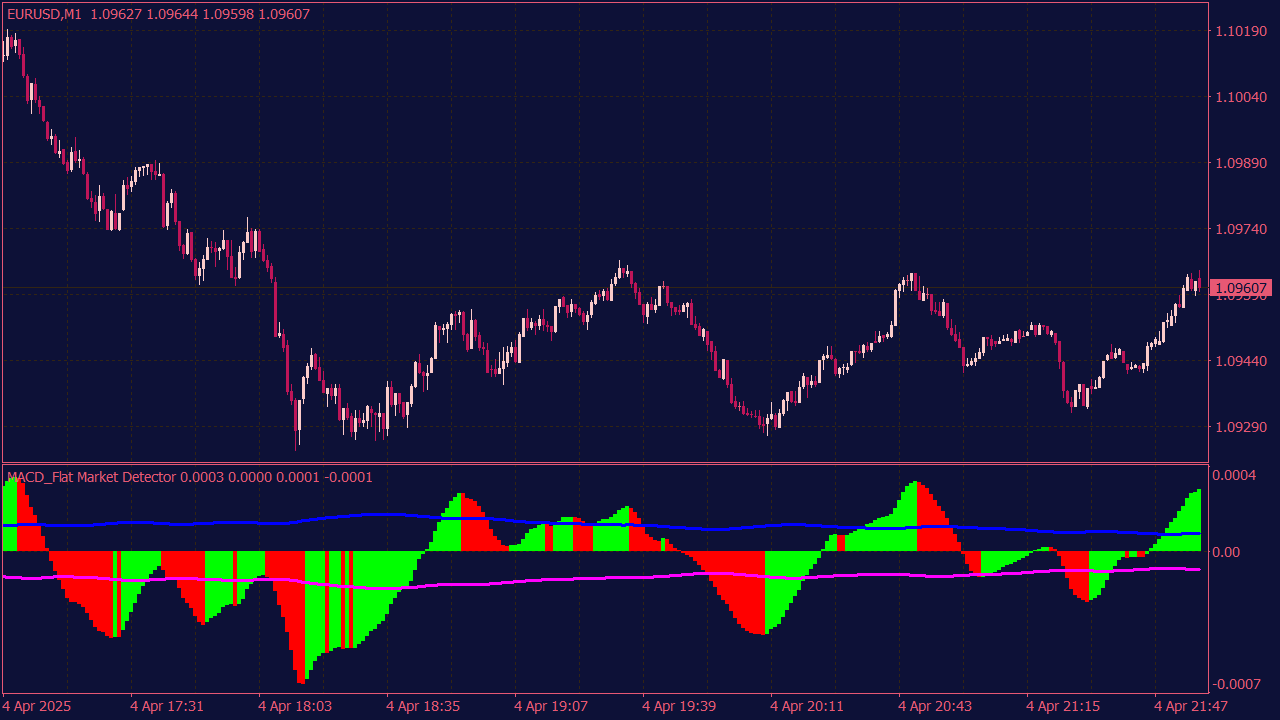
The MACD Flat Market Detector is an indicator designed to identify periods of low momentum or sideways price movement using the MACD. By analyzing when the MACD line and signal line are close together and the histogram remains near zero, it signals a flat or consolidating market phase. This helps traders avoid false signals during ranging conditions and better time entries for upcoming trend breakouts.
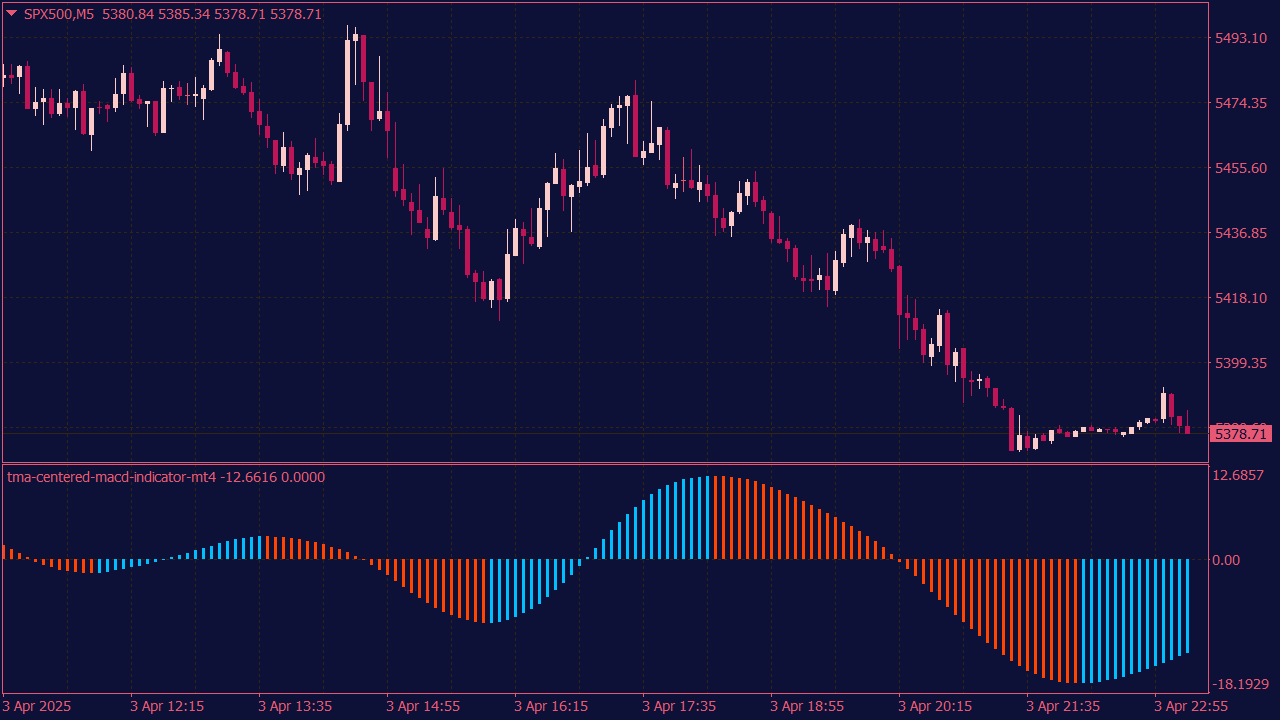
The TMA Centered MACD Indicator combines the Moving Average Convergence Divergence with a Triangular Moving Average to smooth price data and reduce noise. By centering the MACD calculation around the TMA, this indicator offers a clearer view of momentum shifts and trend changes, helping traders identify more reliable signals with fewer false alarms in choppy markets.
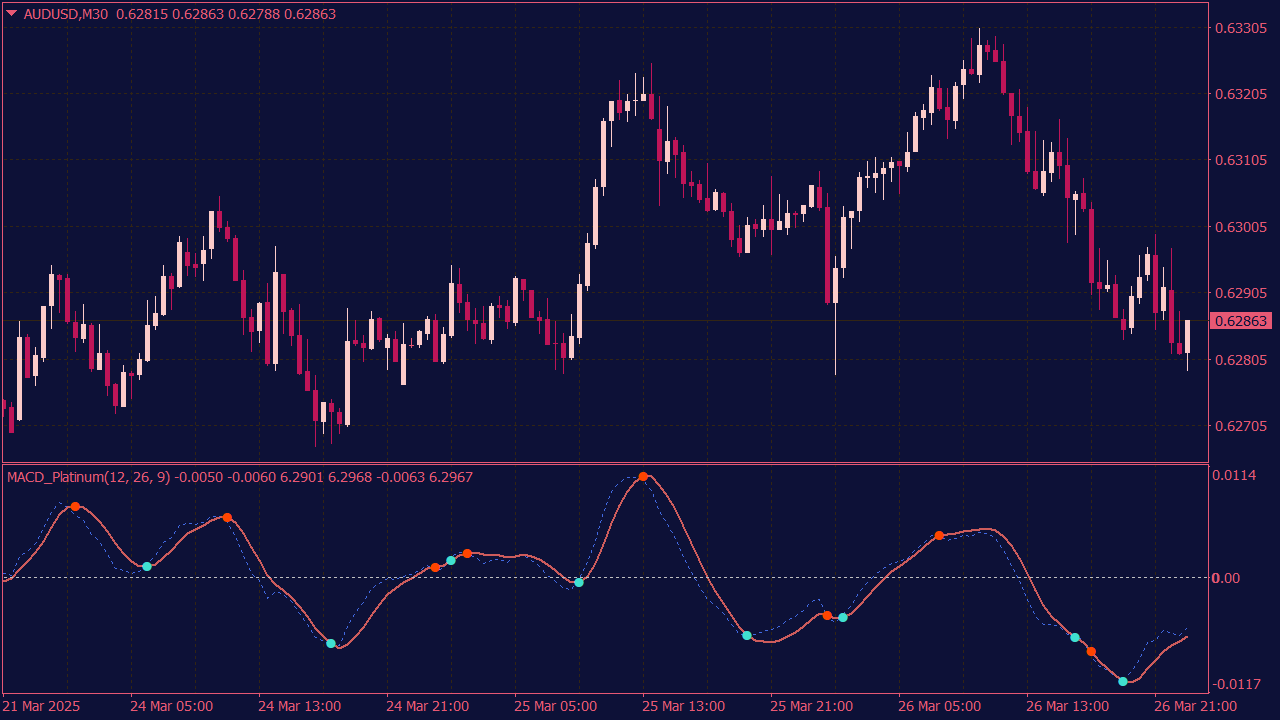
The MACD Platinum Indicator with Alerts is a clean and enhanced version of the classic MACD indicator, focusing solely on the MACD line and Signal line without displaying the histogram. It includes real-time alerts for key crossover events, making it ideal for traders who prefer a simplified chart view with reliable momentum signals.
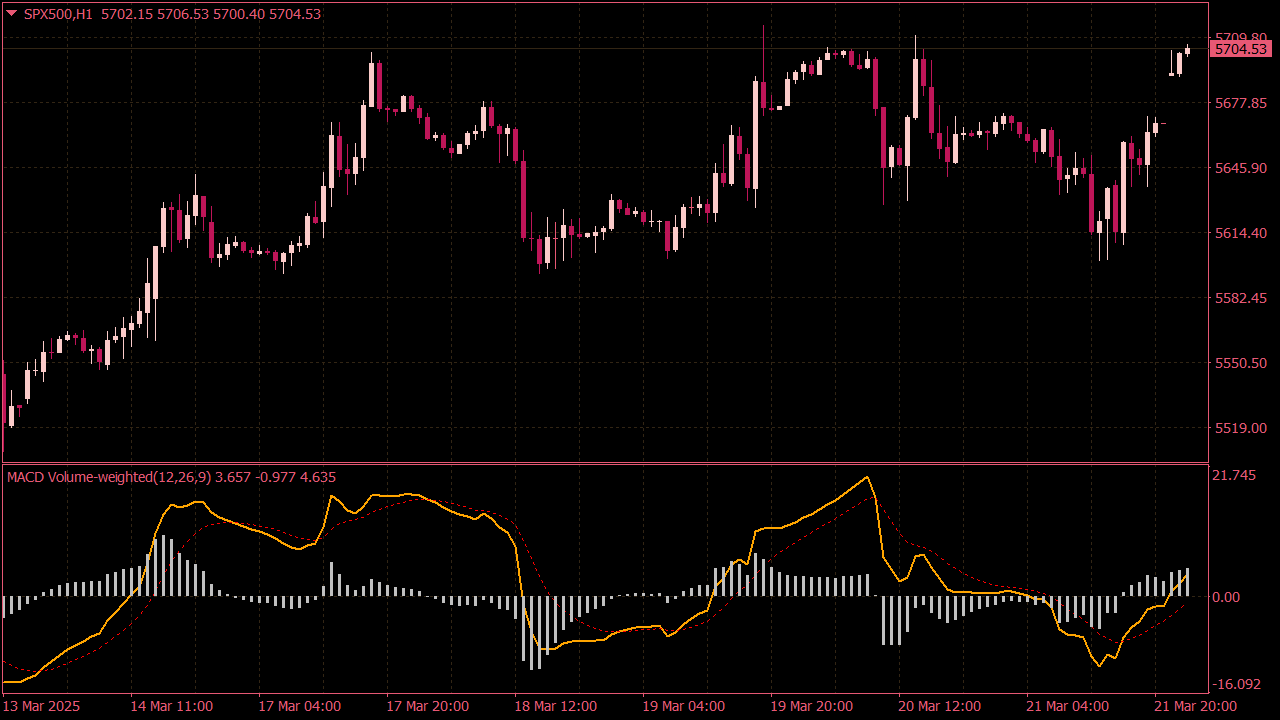
The MACD Volume Weighted indicator is a modified version of the traditional MACD that incorporates volume data into its calculations. By weighting price movements with trading volume, it emphasizes signals that occur during high-activity periods and helping filter out low-volume noise and enhancing the reliability of trend and momentum signals. This indicator is especially useful for identifying stronger, more confirmed moves and avoiding false breakouts during periods of weak volume.
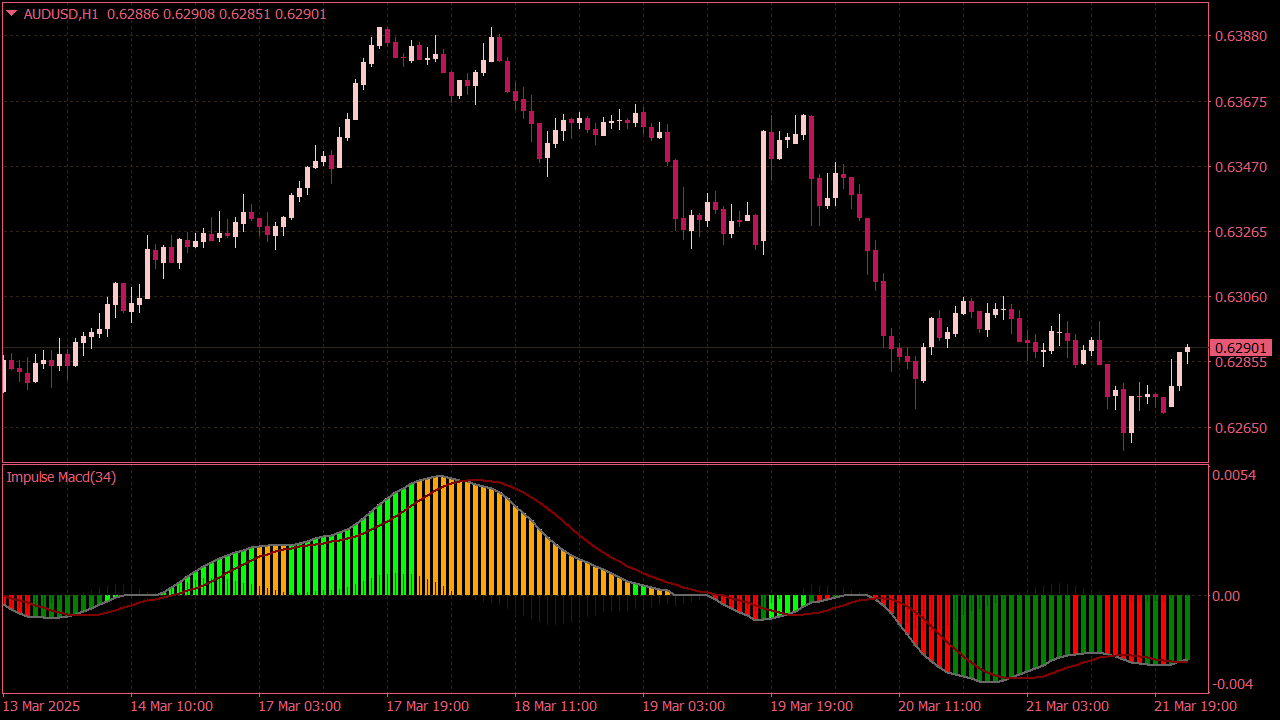
The Impulse MACD is an enhanced MACD indicator that filters out noise using a moving average range, helping reduce whipsaws in sideways markets. It features a color-coded histogram (Lime, Green, Orange, Red) based on momentum strength, a maroon signal line, and a blue histogram showing the difference between Impulse MACD and its signal. It’s used like a traditional MACD for identifying trend direction, momentum shifts, and entry/exit points.
The FX5 MACD Divergence Indicator is a technical analysis tool that helps traders identify potential reversals in price trends by spotting divergences between the Moving Average Convergence Divergence and the price action of an asset. A common trading strategy using this indicator involves looking for bullish divergences (where the price makes lower lows while the MACD makes higher lows) as potential buying opportunities and bearish divergences (where the price makes higher highs while the MACD makes lower highs) as potential selling opportunities. Traders typically confirm these signals with additional indicators or volume analysis and set stop-loss orders to manage risk, utilizing a risk-to-reward ratio tailored to their trading style.
The QFF MACD Indicator is a custom, smoothed version of the traditional MACD designed to reduce market noise and provide clearer trend and momentum signals. It enhances the standard MACD with visual cues like color-coded histograms and crossover alerts, making it easier for traders to identify buy and sell opportunities with improved accuracy.
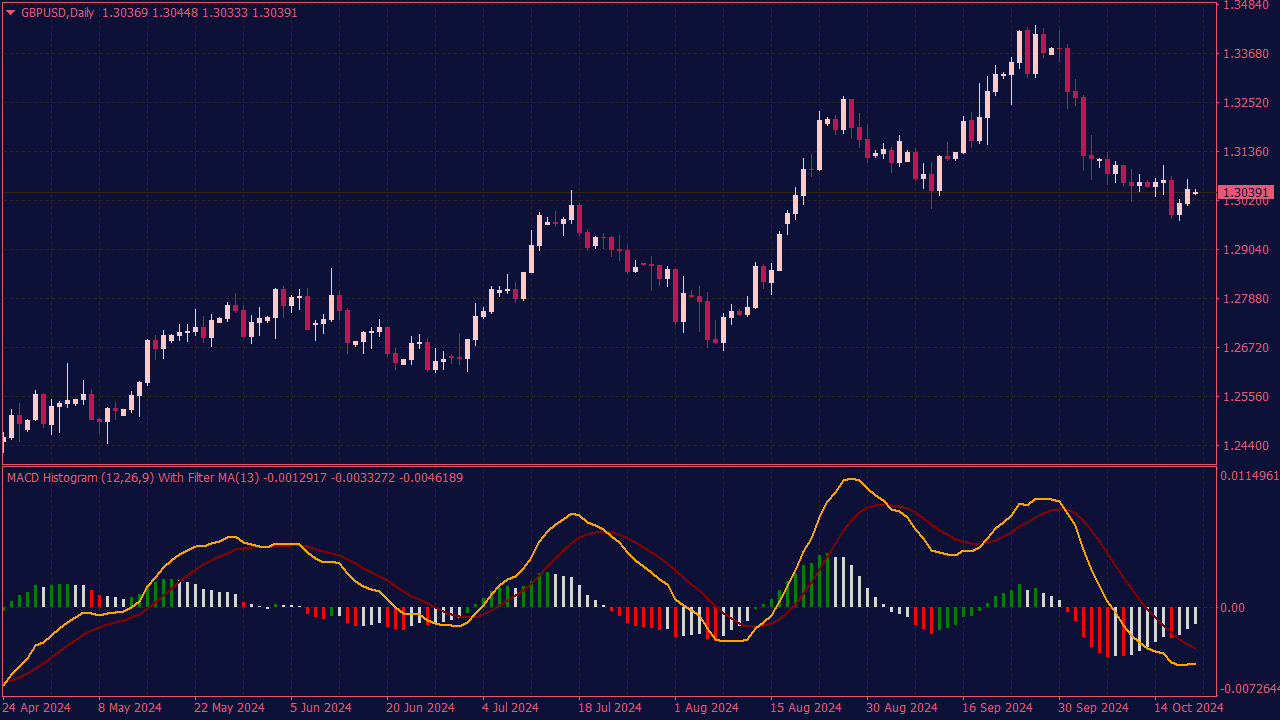
The MACD Histogram with MA Filter Indicator is a momentum indicator that shows the difference between the MACD line and the signal line, providing insights into potential trend reversals. To trade using the MACD Histogram, look for the following signals: buy when the histogram crosses above the zero line, signaling bullish momentum, and sell when it crosses below the zero line, indicating bearish momentum. Additionally, consider divergences between the histogram and price action (if prices are making new highs or lows but the histogram is not, this could suggest a potential reversal). Always use proper risk management and combine the MACD Histogram with other indicators for confirmation.
The MACD Color Indicator is a valuable tool for traders looking to gauge momentum and potential reversals. When the histogram is green (above the zero line), it indicates bullish momentum, signaling possible buying opportunities, especially if confirmed by other indicators or price action. Conversely, a red histogram (below the zero line) suggests bearish momentum, signaling potential selling points. Traders can look for histogram divergences, where price moves in one direction while the histogram moves in the opposite, as possible signals for market reversals. Always combine these indicators with sound risk management strategies for optimal performance.
The MACD Histogram Indicator can be effectively utilized for divergence trading by automatically plotting trend lines to highlight potential divergences between price action and the MACD histogram itself. To implement this, the indicator identifies higher highs or lower lows in price compared to corresponding peaks in the MACD histogram. When a divergence is detected (e.g., price makes a new high while the MACD forms a lower high), it signals a potential trend reversal. Automatic trend lines can be drawn between significant peaks and troughs of both price and the histogram, aiding traders in visually identifying these divergences. Additionally, incorporating alerts can further enhance trading strategies by notifying traders of potential divergence opportunities in real-time.
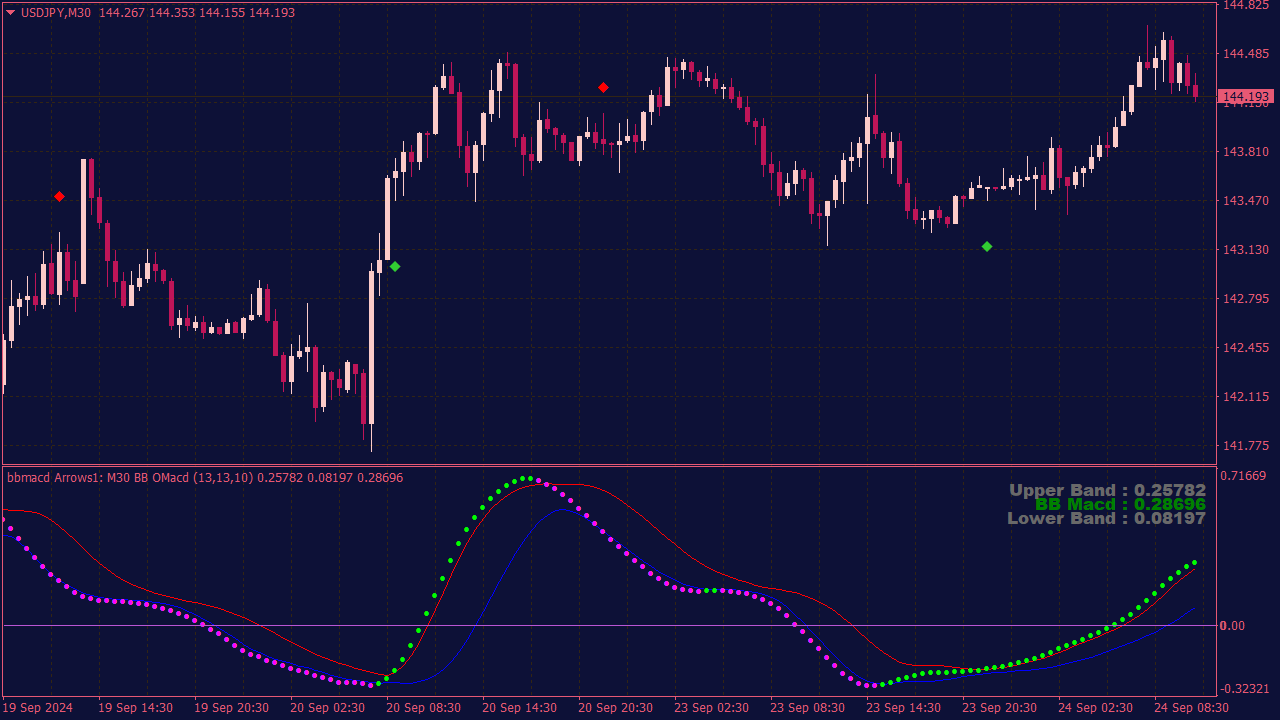
The BB MACD MTF Indicator is a trading tool that combines Bollinger Bands and the Moving Average Convergence Divergence indicator to identify potential entry points across multiple time frames. In a subwindow, the indicator displays MACD values and signals based on the crossover of MACD and signal line, while Bollinger Bands help indicate volatility and potential price reversals. The alerts feature notifies traders when these conditions are met, providing opportunities for entries or exits based on their trading strategies.
The MACD is one of those indicators almost every trader knows — and almost every trader misuses at some point.
It is available on nearly every trading platform. It looks simple. It gives clean visual signals. And that is exactly why many traders become too comfortable with it.
They wait for the MACD line to cross the signal line, treat the crossover as a decision, and ignore the one thing that matters most in Forex: where the signal happens.
A crossover in the middle of a choppy range is not the same as a crossover after a liquidity sweep, a failed breakout, or a clean pullback into support.
The MACD can be useful, but not because it predicts the future. It does not. Its real value is in helping traders read momentum: when it is building, when it is fading, and when the market is losing pressure in one direction.
That is where the indicator becomes useful.
Not as a button. As a filter.
🎯 The Signal Is Not Enough — Location Comes First
One of the biggest mistakes with MACD is treating every crossover equally.
They are not equal.
A bullish crossover after price rejects a major support zone carries more weight than a bullish crossover in the middle of a sideways market. A bearish crossover below resistance means more than a bearish crossover after price has already dropped aggressively.
The question is not only: Did MACD cross?
The better question is: Did MACD confirm something important that price was already showing?
That small difference changes how the indicator is used.
A weak trader uses MACD to create trade ideas. A stronger trader uses MACD to confirm trade ideas.
Price structure comes first. MACD comes second.
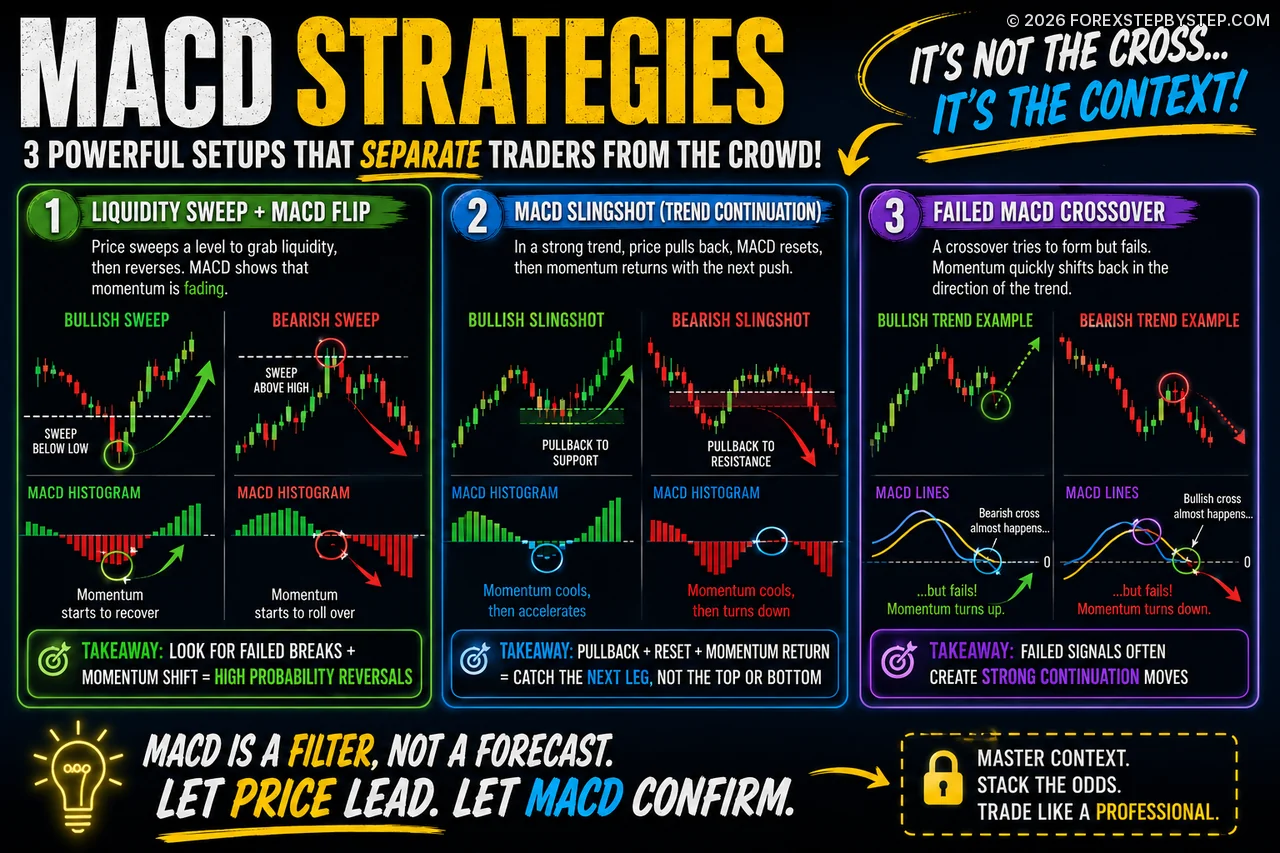
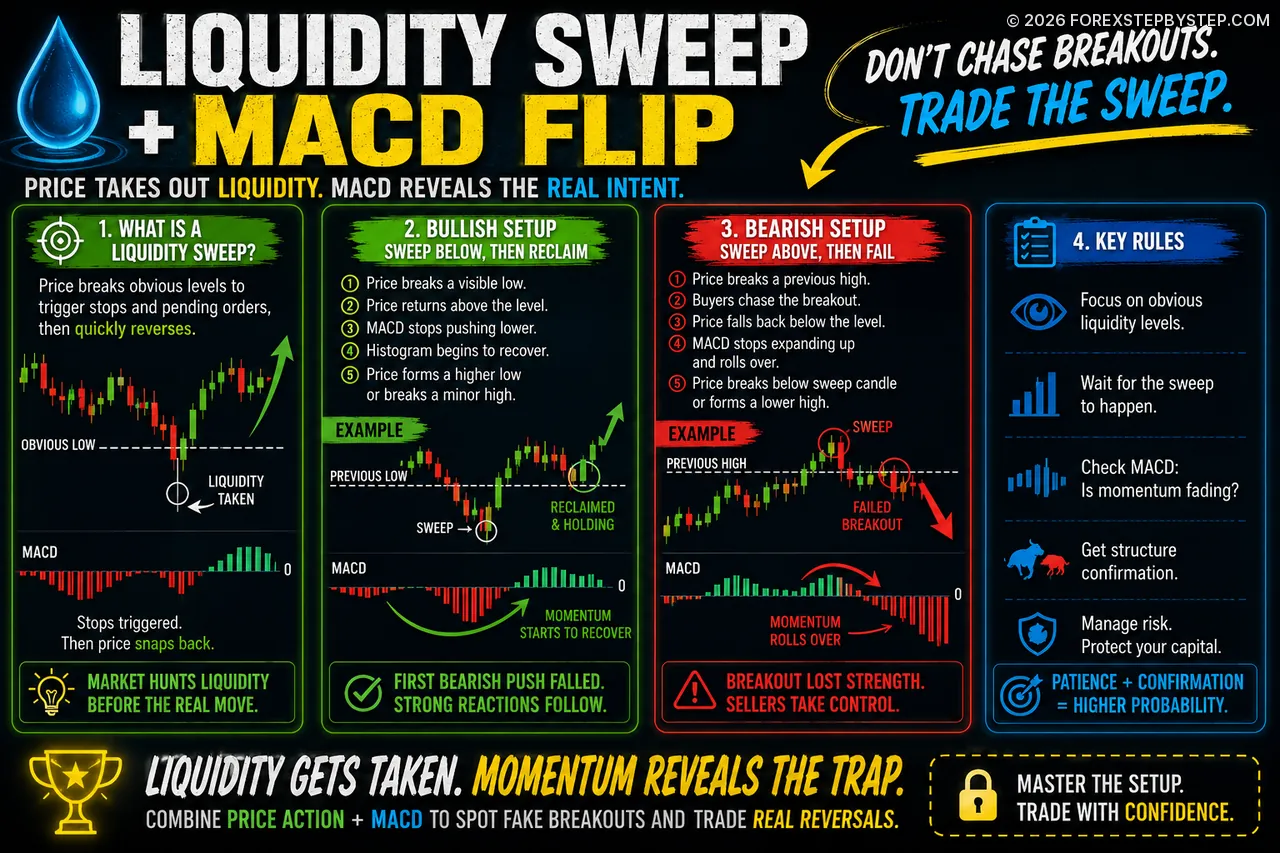
💧 Setup 1: Liquidity Sweep + MACD Flip
Forex markets often move beyond obvious highs or lows before reversing. This happens because visible levels attract orders: stop-losses, breakout entries, and pending orders.
A clean low gets broken. Sellers jump in. Stops are triggered. Then price snaps back above the level.
To a beginner, it looks like confusion. To a more experienced trader, it may be a liquidity sweep.
MACD can help judge whether that break had real momentum or whether the market was simply clearing orders before reversing.
🟢 Bullish Version
Look for price to break below a recent low and then quickly reclaim that same level.
At the moment of the break, many traders will assume the market is turning bearish. But if the MACD histogram stops expanding downward and starts to contract, it can suggest that selling pressure is already fading.
The cleaner version of this setup appears when:
Price breaks a visible low.
Price returns above the broken level.
MACD stops pushing lower.
The histogram begins to recover.
Price forms a higher low or breaks a minor structure high.
That does not mean the trader should buy blindly. It means the first bearish push may have failed.
And failed moves often create strong reactions.
🔴 Bearish Version
The bearish version appears above resistance.
Price breaks above a previous high. Buyers chase the breakout. Then price falls back below the level.
If MACD stops expanding upward and begins to roll over, the breakout may be losing strength. The best confirmation usually comes when price breaks back below the sweep candle or forms a lower high.
The point is simple:
A MACD signal after trapped traders are exposed is often more useful than a MACD signal in the middle of nowhere.
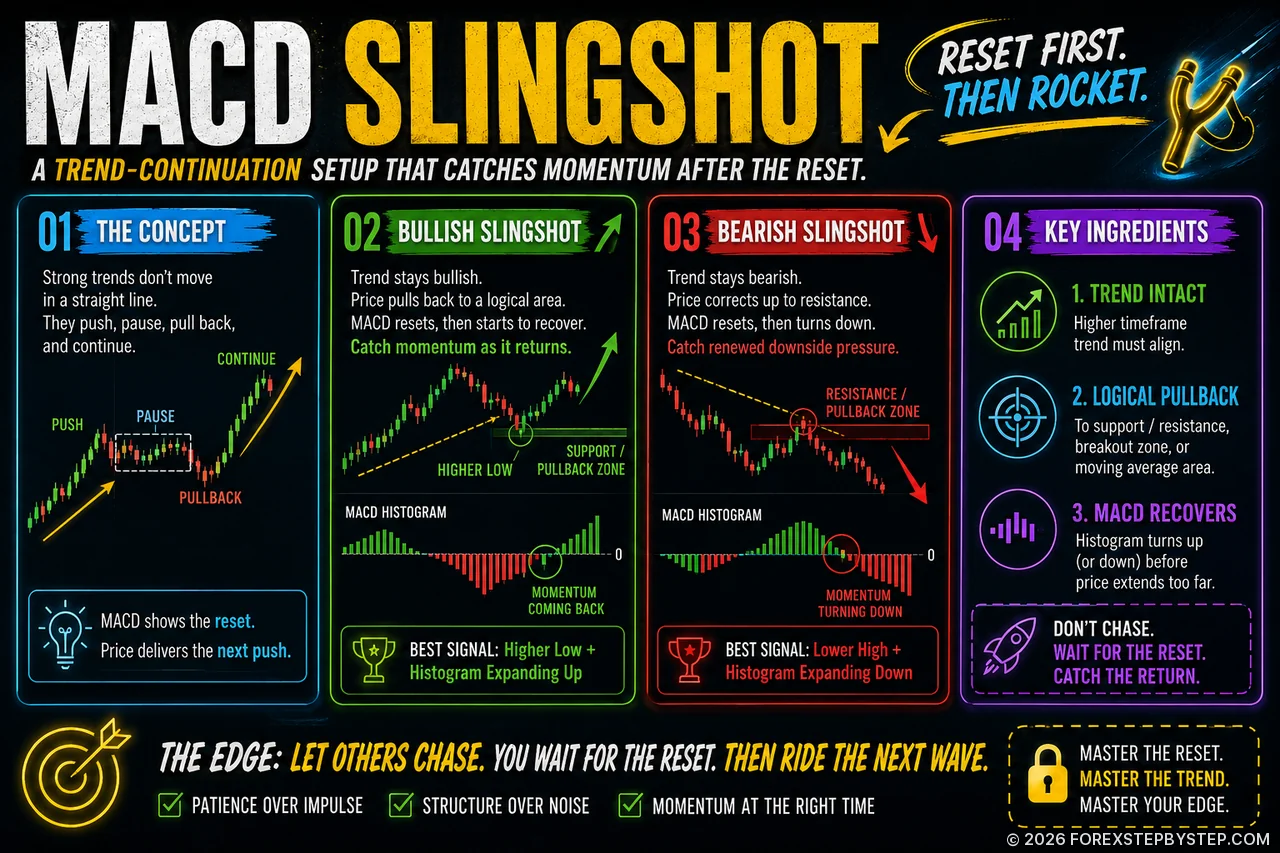
🏹 Setup 2: The MACD Slingshot
Strong trends do not move in straight lines. They push, pause, pull back, and continue.
The MACD Slingshot is a trend-continuation idea built around that rhythm.
In a bullish trend, price pulls back and MACD cools down. The histogram gets smaller. The MACD line may drift toward the signal line or even toward the zero line.
This looks weak at first.
But if price structure remains intact, the market may not be reversing. It may simply be resetting before the next push.
🚀 Bullish Slingshot
A good bullish slingshot usually has three ingredients.
The higher-timeframe trend should still be bullish.
The pullback should land near a logical area, such as support, a prior breakout zone, or a moving average region.
MACD should begin to recover before price extends too far.
The strongest version appears when price forms a higher low and the histogram starts expanding upward again.
The goal is not to enter while momentum is dead. The goal is to catch the moment momentum starts returning.
🧲 Bearish Slingshot
The bearish version works the same way in reverse.
Price is in a downtrend. It corrects upward into resistance. MACD resets, but the recovery looks weak. The histogram starts turning lower again, and price breaks the correction structure.
This setup is useful because it discourages chasing.
Instead of selling after the move is already obvious, the trader waits for the market to pull back, reset, and show renewed downside pressure.
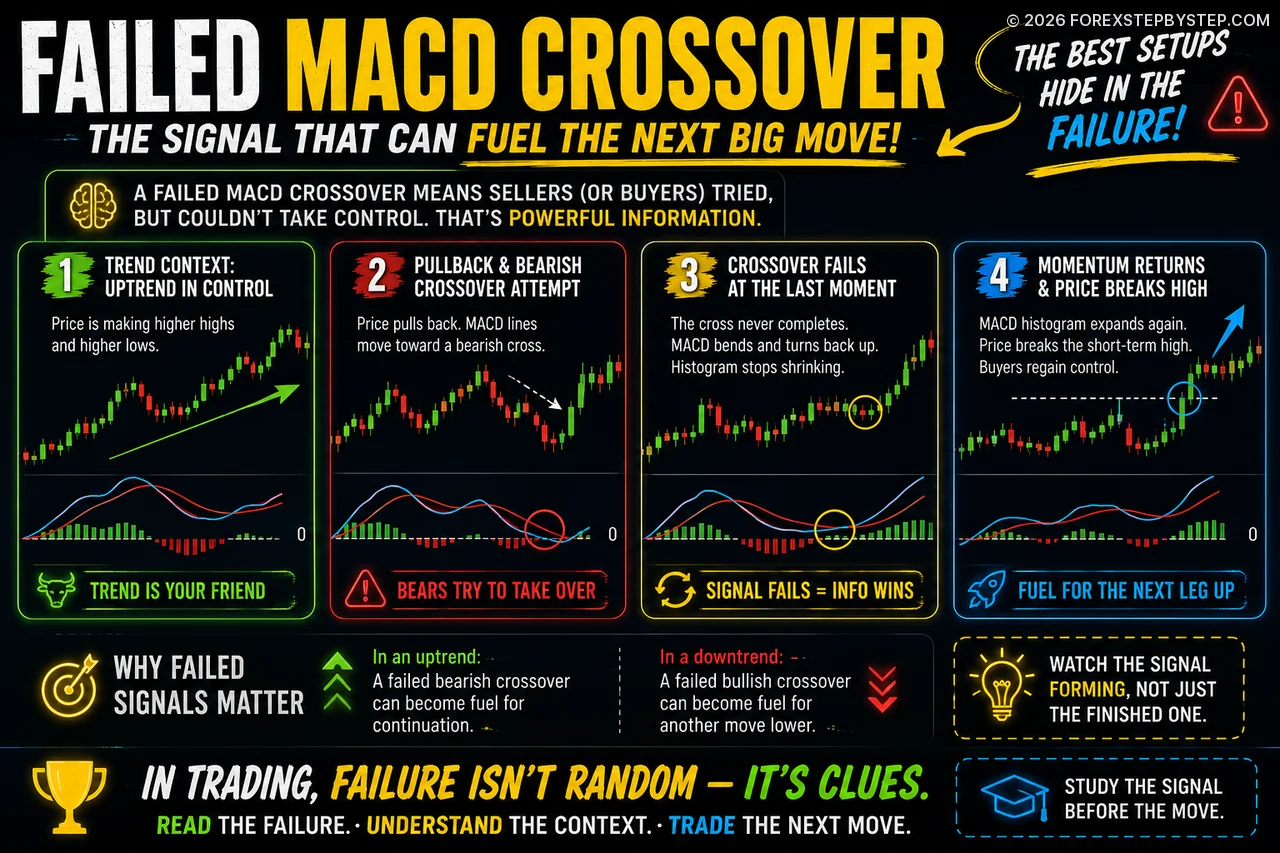
⚠️ Setup 3: The Failed MACD Crossover
A failed MACD signal can be more interesting than a completed one.
Imagine EUR/USD is trending higher. Price pulls back. MACD starts moving toward a bearish crossover. At that moment, traders who rely only on indicators may expect the trend to reverse.
But the crossover never completes.
The MACD line bends, hesitates, and turns back up. The histogram starts expanding again. Price breaks a short-term high.
That tells a useful story:
Sellers had a chance to take control, but they could not finish the job.
🧠 Why Failed Signals Matter
Markets often accelerate after failed countertrend signals because traders on the wrong side need to exit.
In an uptrend, a failed bearish crossover can become fuel for continuation.
In a downtrend, a failed bullish crossover can become fuel for another move lower.
This is why watching MACD while the signal is forming can be more useful than waiting only for finished crossovers.
The failure itself is information.
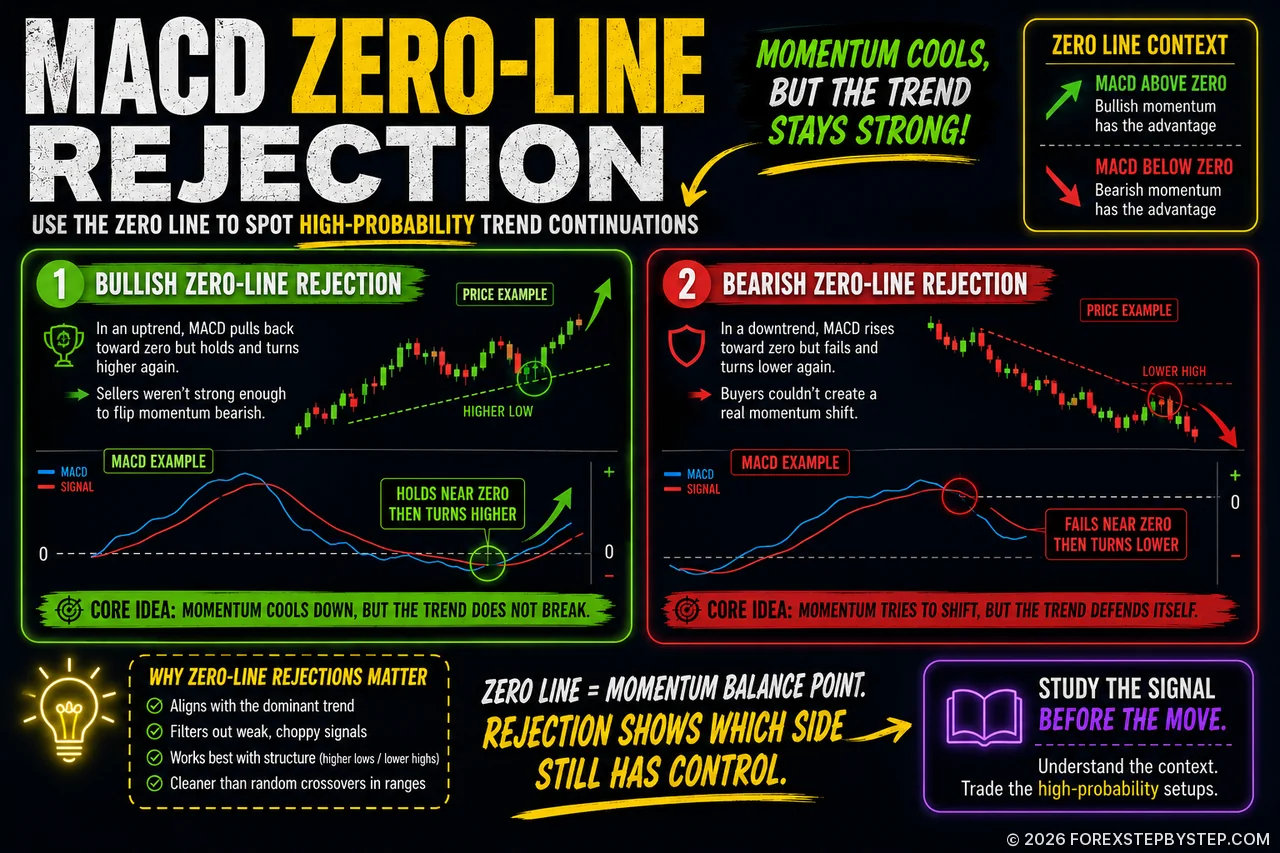
➖ Setup 4: Zero-Line Rejection
The zero line is one of the most overlooked parts of MACD.
Many traders focus only on the MACD line and the signal line. But the zero line gives useful information about the broader momentum environment.
When MACD is above zero, bullish momentum has the advantage.
When MACD is below zero, bearish momentum has the advantage.
The interesting part is what happens when MACD returns to that line.
📈 Bullish Zero-Line Rejection
In an uptrend, MACD may pull back toward the zero line during a correction.
If it holds near zero and turns higher again, it can suggest that sellers were not strong enough to shift momentum fully bearish.
This setup becomes more relevant when price is also holding a higher low or rejecting a support zone.
The idea is not complicated:
Momentum cools down, but the trend does not break.
That is often where continuation setups form.
📉 Bearish Zero-Line Rejection
In a downtrend, MACD may rise toward zero during a correction.
If it fails near the zero line and turns lower again, it may show that buyers could not create a real momentum shift.
This is especially useful when price is rejecting resistance or failing to break a prior swing high.
A zero-line rejection in the direction of the main trend is usually cleaner than a random crossover inside a range.
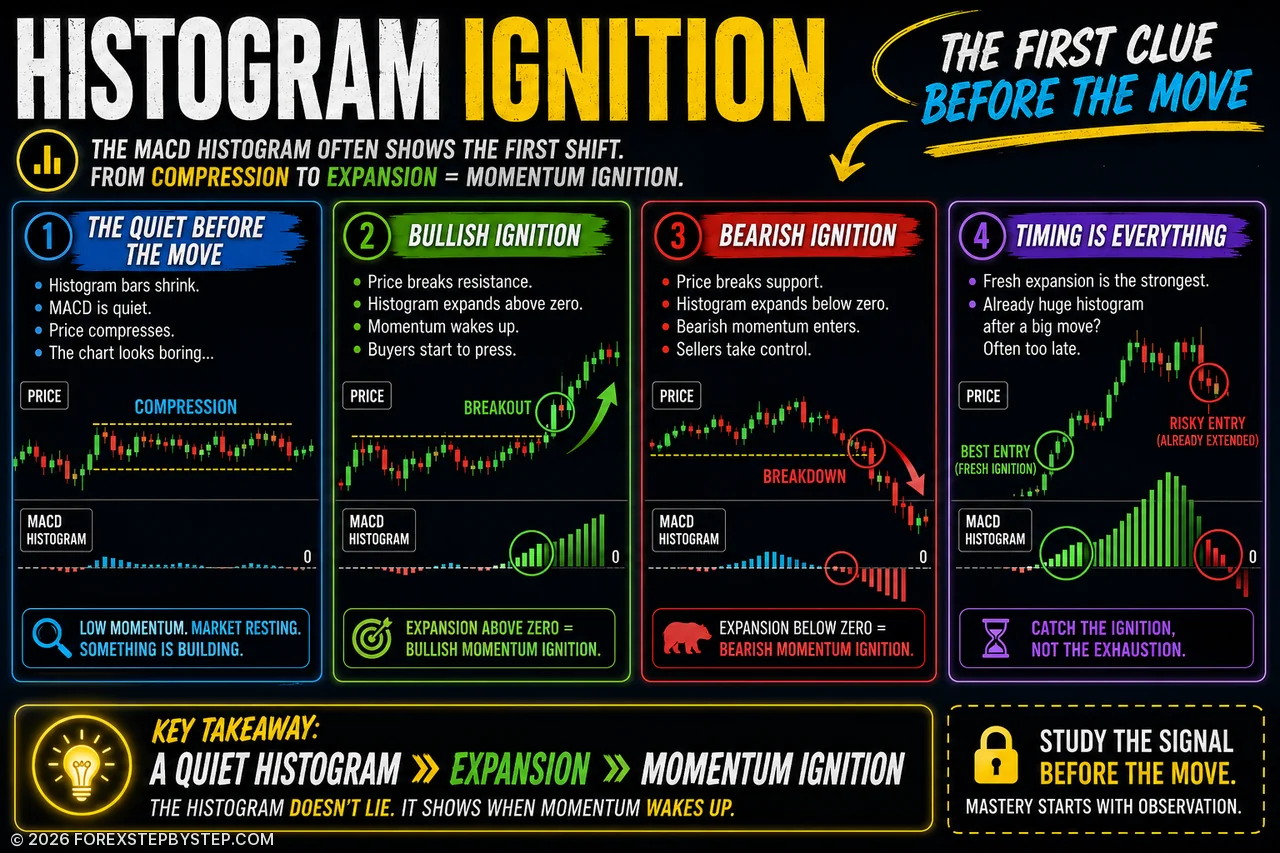
🔥 Setup 5: Histogram Ignition
The MACD histogram is often where the first useful clue appears.
Before a strong move, the histogram may become quiet. The bars shrink. Price tightens. The chart looks boring.
Then momentum wakes up.
That shift from compression to expansion is what makes the histogram useful.
🟢 Bullish Ignition
A bullish ignition setup may appear when price is consolidating below resistance.
The histogram is small. MACD is quiet. Price is not moving much.
Then price breaks resistance and the histogram expands above zero.
This suggests that momentum is no longer flat. Buyers are starting to press.
The best version appears when the breakout candle has a solid body and closes above the level, not just a quick wick through it.
🔴 Bearish Ignition
A bearish ignition setup appears when price is consolidating above support.
The histogram is flat. Price compresses. Then support breaks and the histogram expands below zero.
This can confirm that bearish momentum is entering the market.
The important part is timing.
A fresh histogram expansion is usually more interesting than an already huge histogram after price has travelled too far.
⏰ The Late-Entry Warning
A large MACD histogram looks attractive, but it can also be dangerous.
By the time the histogram is extremely extended, the move may already be mature. Price may be far from its average value. The pair may also be approaching a major support or resistance level.
That is where many traders enter late. They see strength and assume continuation.
But professionals often ask a different question: Is this momentum still early, or is it already crowded?
MACD is most useful when momentum starts expanding. It becomes less useful when the whole market can already see the move.
Fresh momentum is opportunity. Obvious momentum can be a trap.
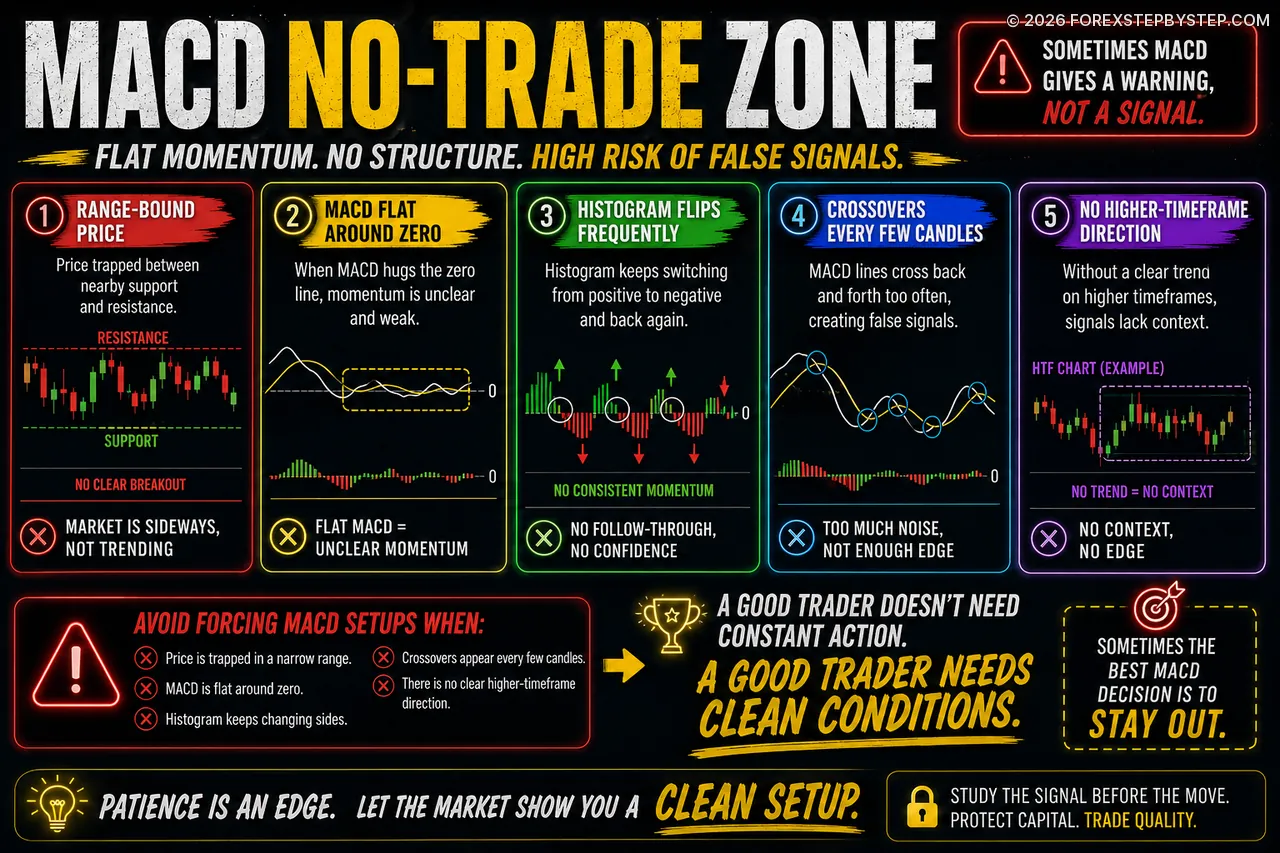
🚫 The MACD No-Trade Zone
Sometimes MACD does not give a trade signal. It gives a warning.
A flat MACD around the zero line usually means momentum is unclear. If the histogram keeps flipping from positive to negative and price is stuck between nearby support and resistance, the indicator becomes noisy.
This is where many traders give back profits.
The chart looks active. Signals appear often. But there is no clean structure behind them.
Avoid forcing MACD setups when:
Price is trapped in a narrow range.
MACD is flat around zero.
The histogram keeps changing sides.
Crossovers appear every few candles.
There is no clear higher-timeframe direction.
A good trader does not need constant action. A good trader needs clean conditions.
Sometimes the best MACD decision is to stay out.
🧭 How Experienced Traders Actually Use MACD
A beginner might say: MACD crossed, so I entered.
A more structured trader would say: Price swept liquidity below support, reclaimed the level, formed a higher low, and MACD confirmed that bearish momentum was fading.
That second sentence is a trading idea. The first one is just an indicator reaction.
MACD should not be the whole strategy. It should be part of a wider reading of the market.
The strongest MACD signals often appear after:
Liquidity sweeps
Failed breakouts
Trend pullbacks
Zero-line rejections
Momentum compression
Hidden divergence
Failed countertrend crossovers
The common thread is context.
MACD works best when it confirms something that price action already made visible.
🧩 A Practical MACD Checklist
Before using MACD in a Forex trade, ask a few direct questions:
Is the market trending or ranging?
Is the signal near a meaningful level?
Is MACD aligned with the higher timeframe?
Is the histogram expanding early or already stretched?
Did price sweep liquidity before reversing?
Has price confirmed the idea with structure?
Is the trade location good, or is the entry late?
Where is the invalidation level?
Does the risk-to-reward make sense?
This kind of checklist keeps MACD in its proper role.
It is not there to make the decision alone. It is there to support a decision that already makes sense.
🏁 Final Thoughts
The MACD is not powerful because it gives perfect signals. It does not.
Its value comes from showing changes in momentum: when pressure is building, when it is fading, and when one side of the market is losing control.
Most traders use MACD too mechanically. They wait for crossovers and ignore price location, liquidity, structure, and higher-timeframe direction.
That is why the same indicator can produce very different results in different hands.
Used badly, MACD is late and noisy. Used well, it becomes a useful momentum filter.
The edge is not in the indicator itself.
The edge is in knowing when the indicator actually matters.
Editorial Note
This article is for educational purposes only and does not constitute financial advice. Forex trading involves risk, and every strategy should be tested before being used with real capital.