MT5 Momentum Indicators with Histogram, Squeeze or Smoothed

MT5 Momentum Indicators with Histogram, Squeeze or Smoothed

by The Specialist -
Number of replies: 7

Squeeze Momentum Indicator

Squeeze Momentum Indicator for MT5

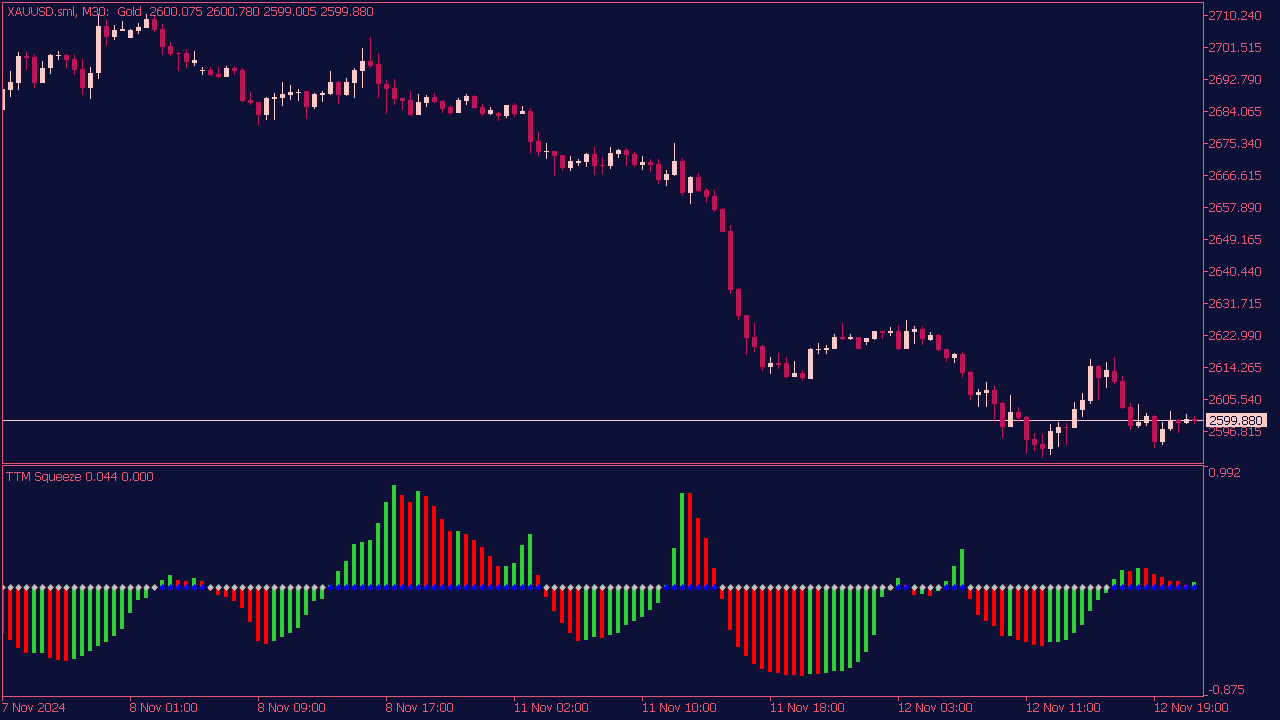
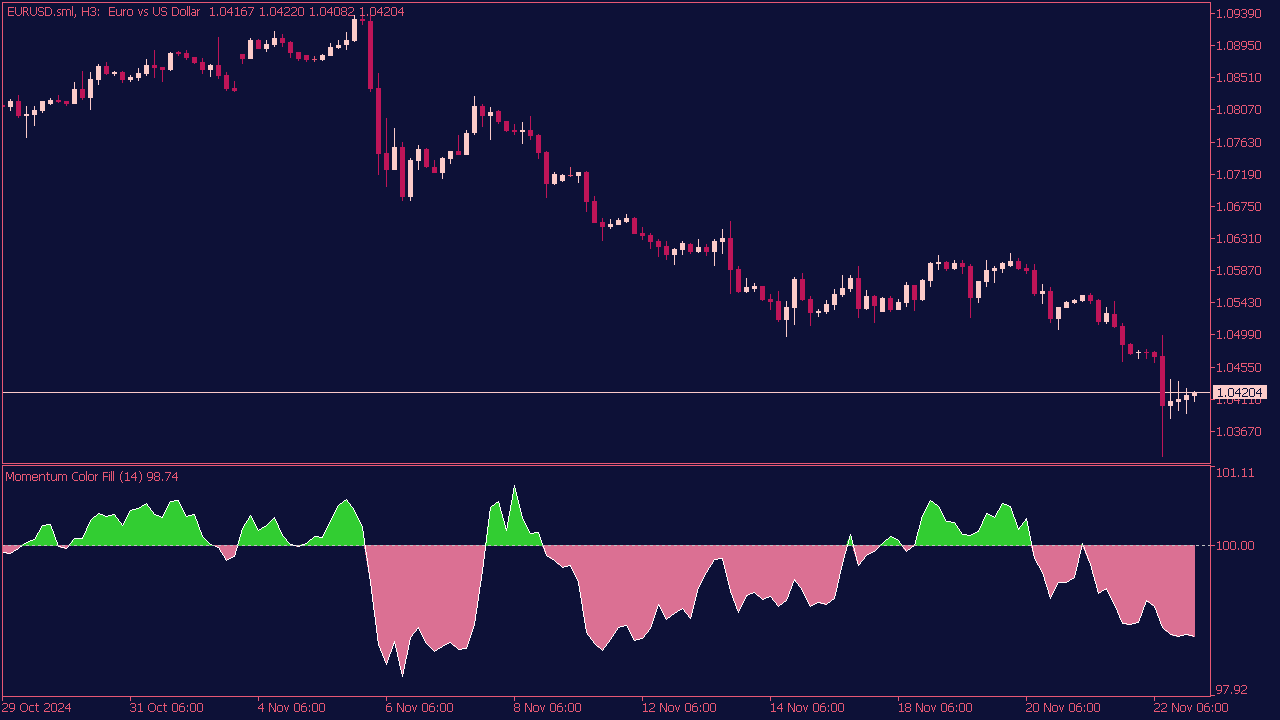
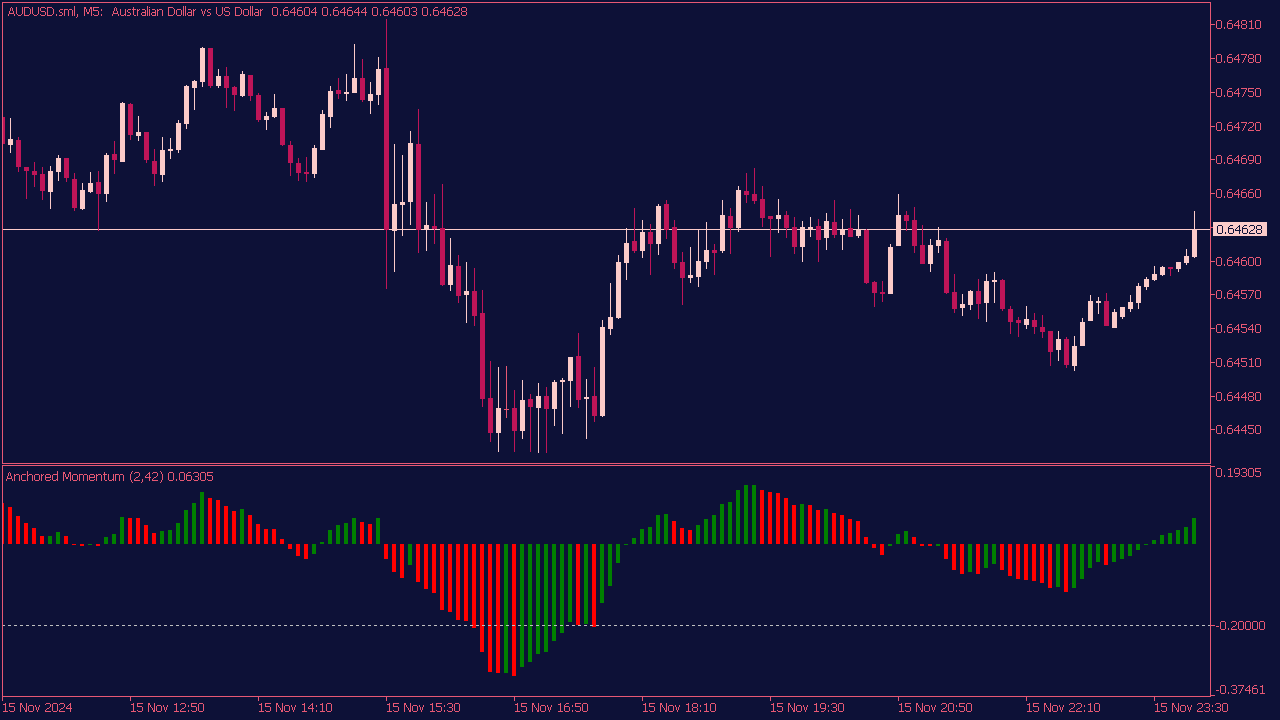
The Squeeze Momentum Indicator is used to identify potential breakout opportunities in the market. Entry signals typically occur when the indicator shows a squeeze, indicated by the Bollinger Bands constricting, followed by a breakout when the price moves outside of the bands. A bullish entry signal can be confirmed when the momentum histogram turns from red to green, suggesting a potential upward price movement, while a bearish entry signal occurs when the histogram transitions from green to red, indicating potential downward pressure. Traders often combine these signals with other technical analysis tools for validated entries.

Momentum Indicators for MT5

by The Specialist -

Momentum Cloud Indicator

Momentum Cloud Indicator for MT5

The Momentum Cloud indicator is a technical analysis tool designed to visualize price momentum by creating envelopes around a Momentum oscillator, which reflects the rate of price changes. These envelopes are derived from the oscillator values calculated based on the High and Low prices of a specified period. Traders use this indicator to identify potential trend reversals or continuations by observing the relationship between the price action and the oscillating cloud, interpreting movements above or below the envelopes as signals of bullish or bearish momentum.

Momentum Indicators for MT5

by The Specialist -

Momentum Color Fill Indicator

Momentum Color Fill Indicator for MT5

The Momentum Color Fill Indicator is a technical analysis tool used in trading that visually represents momentum strength and direction through color-coded fills on a price chart. Typically, the indicator measures the rate of price changes over a specified period, filling the area between an upper and lower threshold with different colors based on whether momentum is bullish or bearish. For example, a green fill might indicate strong upward momentum, while a red fill could signal declining momentum. Traders use this indicator to identify potential entry and exit points in their trading strategies, seeking to capitalize on changes in market sentiment.

Momentum Indicators for MT5

by The Specialist -

Smoother Momentum Indicator

Smoother Momentum Indicator for MT5

The Smoother Momentum Indicator, an advanced version of the traditional momentum indicator, applies a smoothing technique to reduce noise in price fluctuations and help identify true market trends. To effectively use it in trading, look for divergence between price and the indicator, indicating potential reversals. A rising Smoother Momentum suggests bullish momentum, while a falling one indicates bearish momentum; traders can enter positions in the direction of the prevailing trend. It’s also effective to combine this indicator with other tools, like support and resistance levels or moving averages, for more reliable trade signals. Always implement strict risk management practices to protect your capital.

Momentum Indicators for MT5

by The Specialist -

Anchored Momentum Indicator

Anchored Momentum Indicator for MT5

The Anchored Momentum Indicator, proposed by Rudy Stefenel in the 1998 edition of "Technical Analysis of Stocks and Commodities," provides traders with valuable insight into price momentum relative to a specific anchor point. The indicator is designed to filter out minor price fluctuations using a "buffer area," allowing traders to focus on more significant momentum shifts. When the indicator approaches the zero line or crosses into the buffer area, it signals potential entry points. Additionally, traders can utilize divergences between the indicator and price charts to identify possible trend reversals or strengths, enhancing their trading strategies.

Momentum Indicators for MT5

by The Specialist -

Relative Momentum Index Indicator

Relative Momentum Index Indicator for MT5

The Relative Momentum Index (RMI) is a momentum oscillator that combines concepts from both the Relative Strength Index (RSI) and momentum indicators to identify potential entry points in trading. To utilize the RMI for entries, look for oversold conditions (typically below 30) as potential buy signals, while overbought conditions (usually above 70) can signal sell or short opportunities. Traders often look for divergence between the RMI and price action: bullish divergence may suggest a buying opportunity when prices are declining but RMI is increasing, while bearish divergence can indicate a selling point when prices are rising but RMI is falling. It's important to confirm RMI signals with other factors such as trend analysis or volume before making trading decisions.

Momentum Indicators for MT5

by The Specialist -

Momentum Pinball Indicator

Momentum Pinball Indicator for MT5

The Momentum Pinball Indicator is designed to identify strong price movements in markets, signaling potential trade setups based on momentum shifts. Traders typically look for buy signals when the indicator shows rising momentum, suggesting a bullish trend, particularly after a pullback in price. Conversely, sell signals are generated when the indicator indicates declining momentum, often following a rise in price. Key entry points can be confirmed with additional technical analysis, such as support/resistance levels or volume spikes, to enhance trade reliability and reduce risk. Always apply proper risk management and consider market conditions before executing trades.

Momentum Indicators for MT5

by The Specialist -

Smoother Momentum MACD Indicator

Smoother Momentum MACD Indicator for MT5

The Smoother Momentum MACD Indicator typically features a single color line that represents the difference between two smoothed moving averages, often helping to identify momentum trends. For trading tips, consider using this indicator to spot potential buy signals when the line crosses above the zero line, indicating bullish momentum, and sell signals when it crosses below, suggesting bearish momentum. Additionally, look for divergence between the indicator and price action; for instance, if prices are making new highs but the line isn’t, this can signal a potential reversal. Finally, confirm trades with other indicators or price action for improved accuracy.