MT5 RSI Indicators with Divergence, Histogram or MTF

MT5 RSI Indicators with Divergence, Histogram or MTF

by Specialist ®️ -
Number of replies: 11

RSI Divergence Indicator

RSI Divergence Indicator for MT5

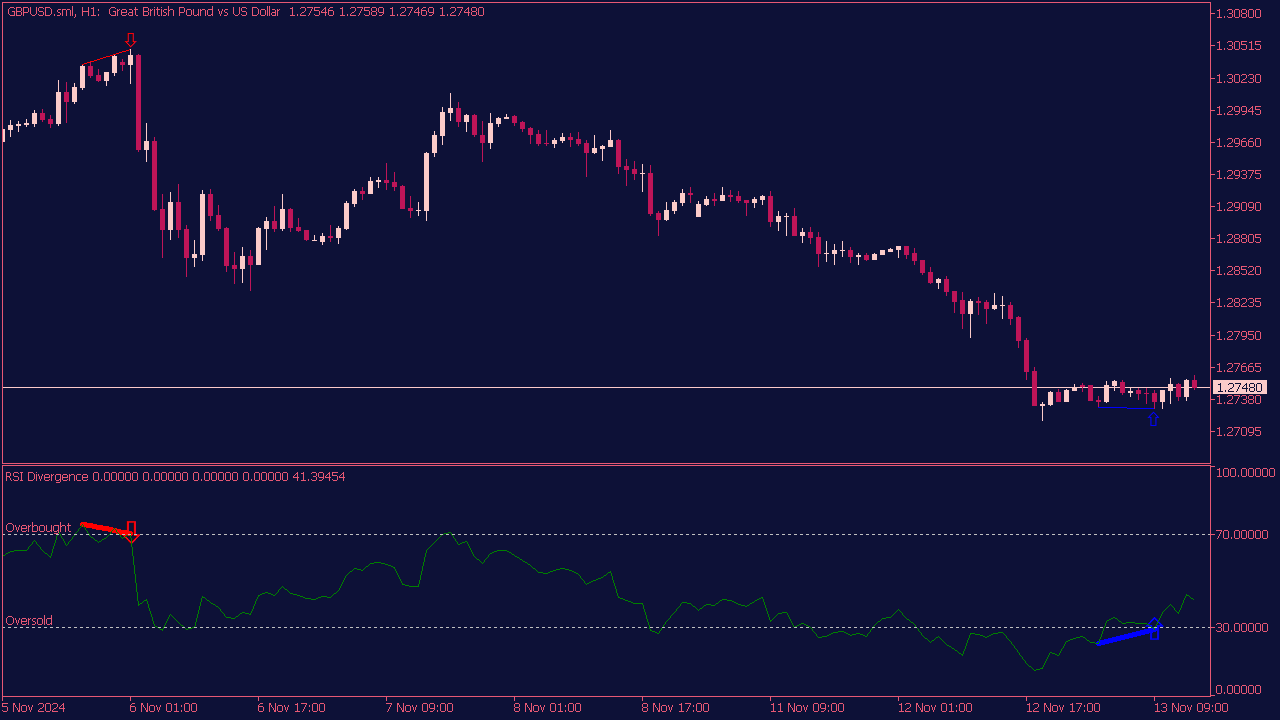
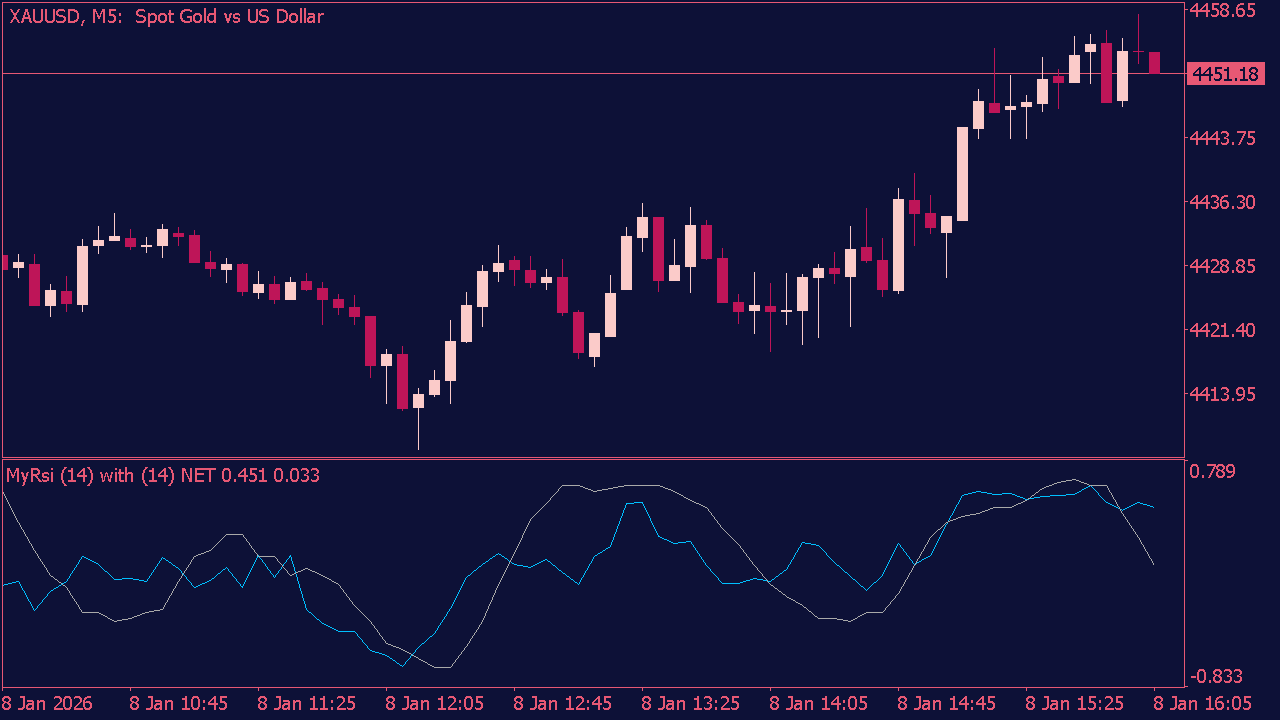
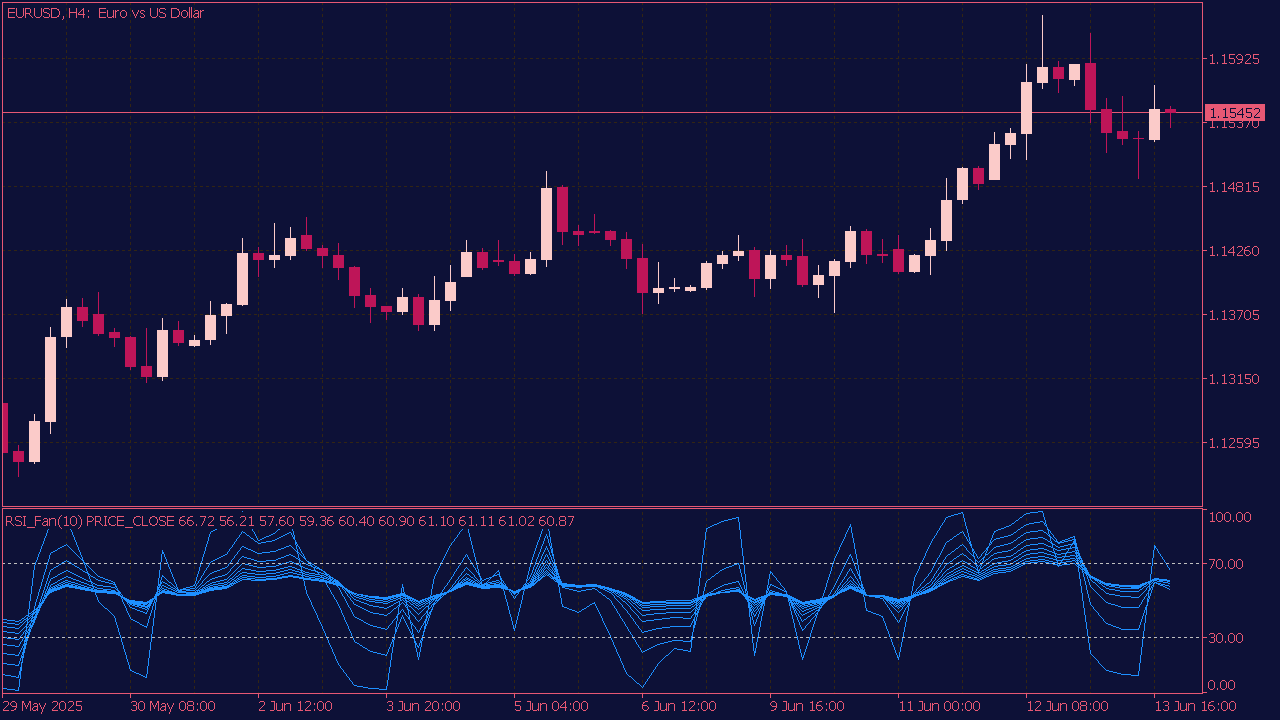
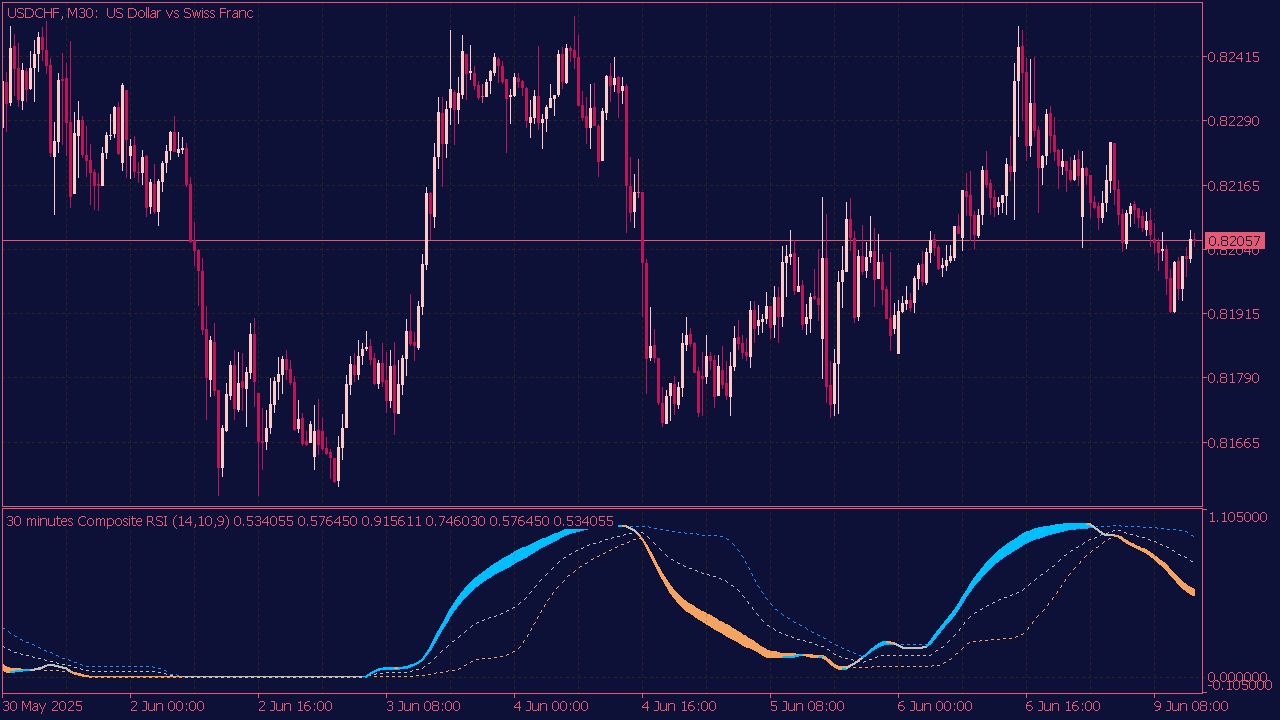
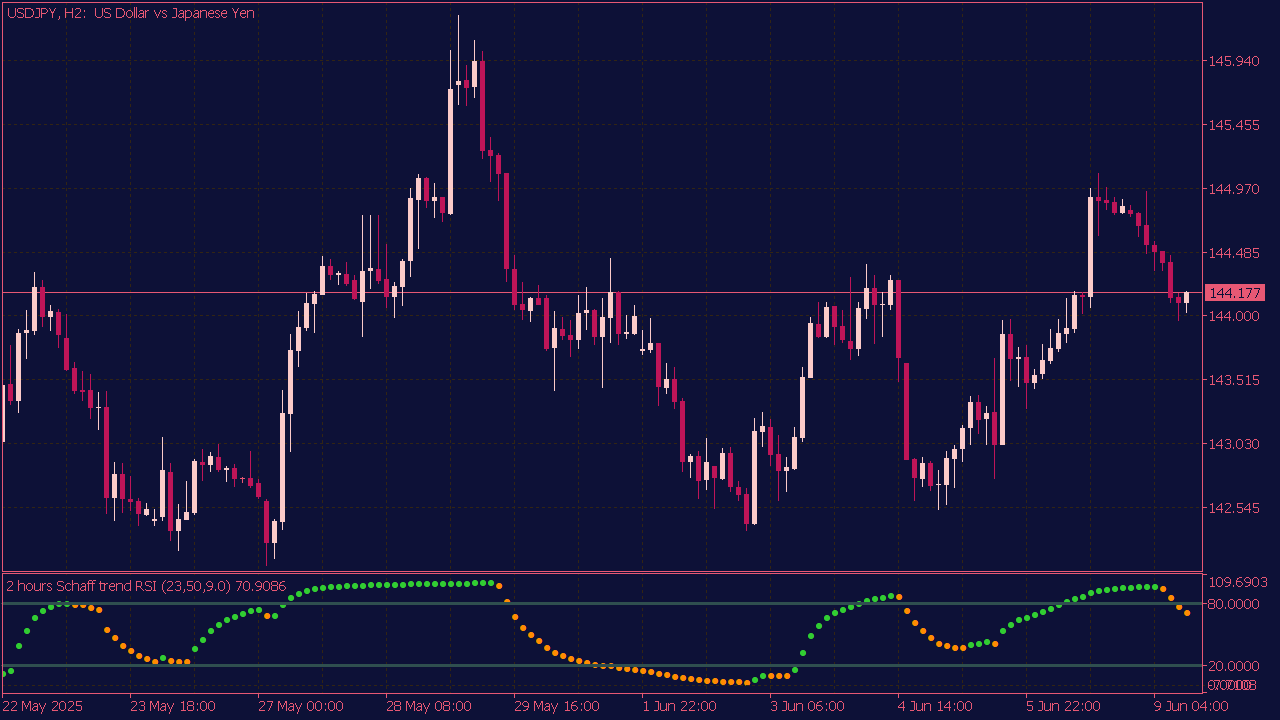
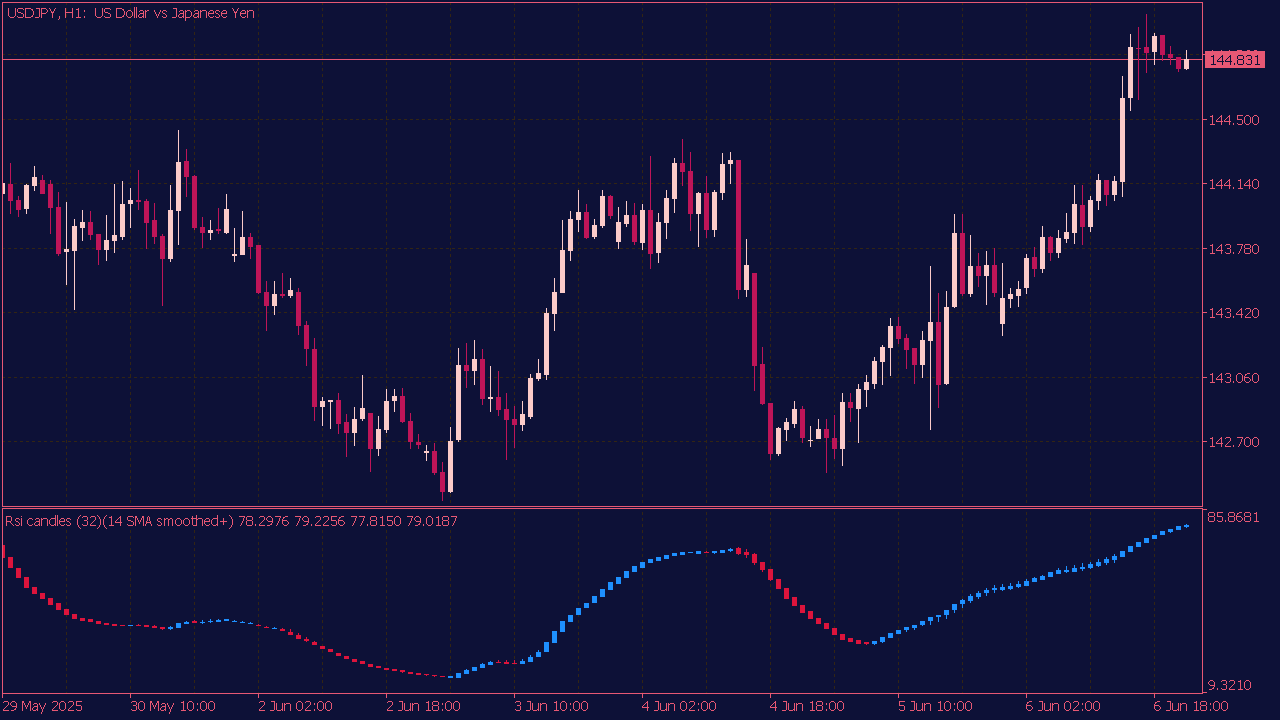
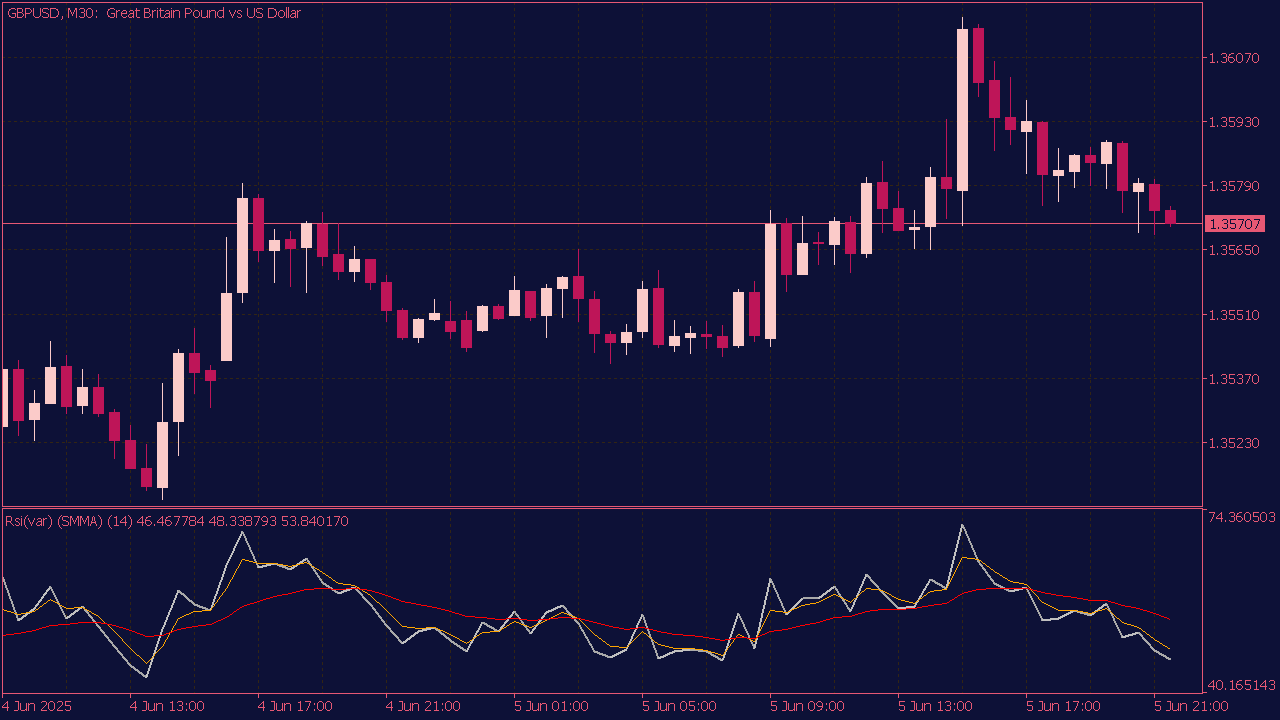
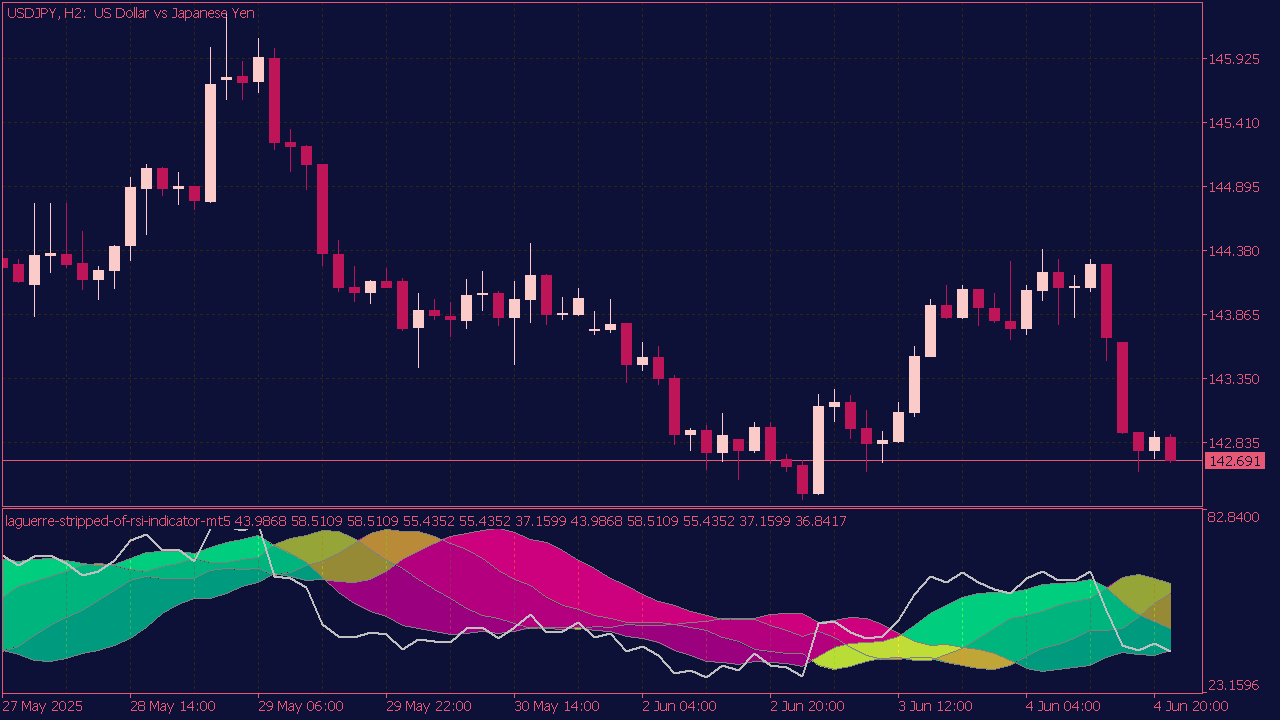
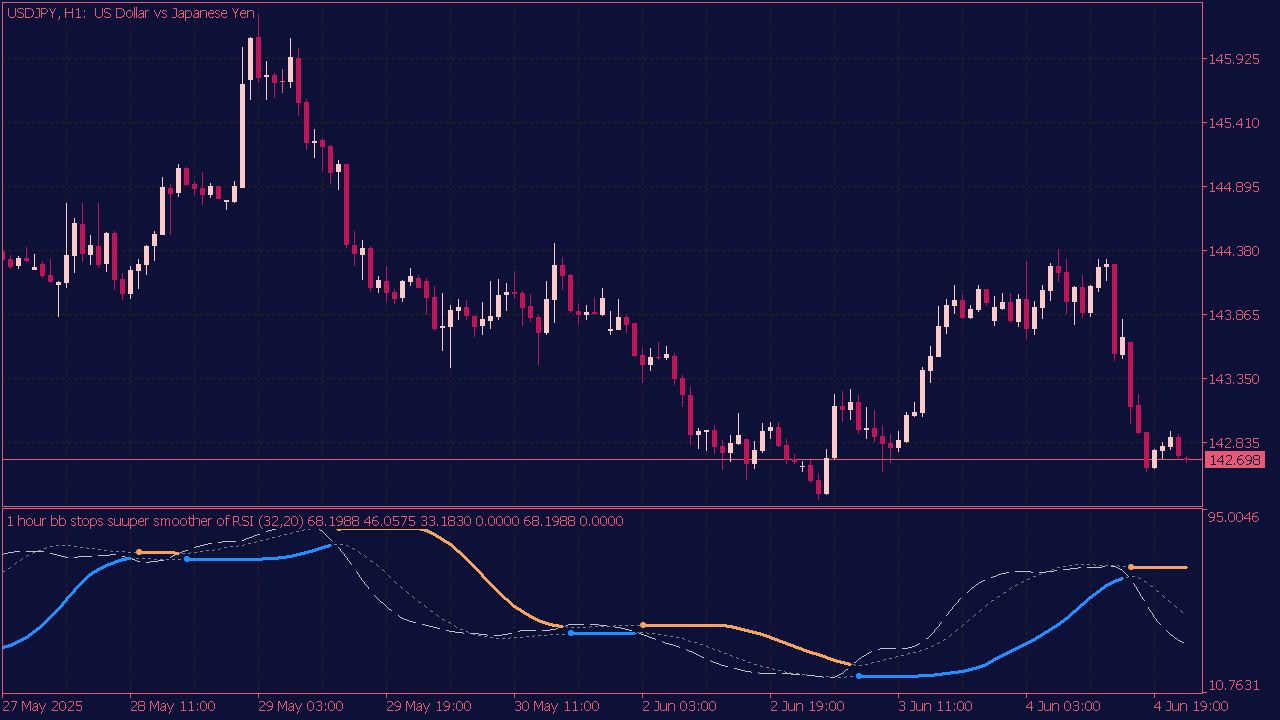
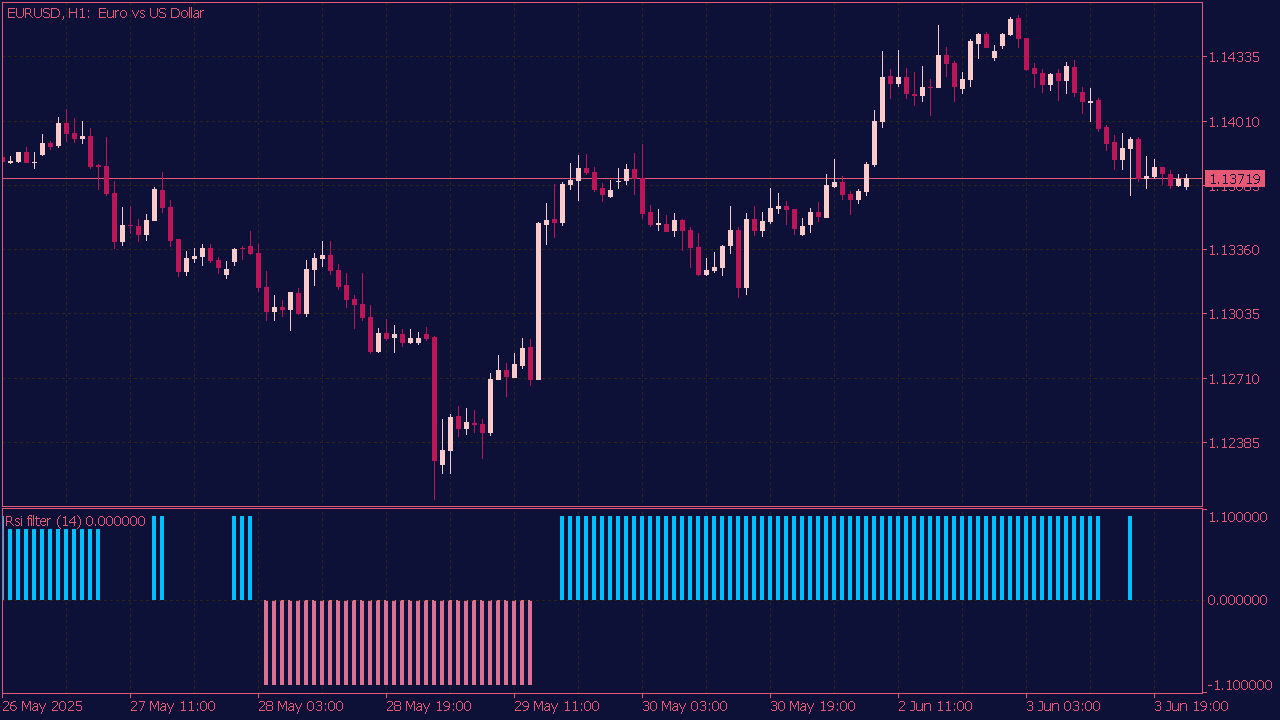
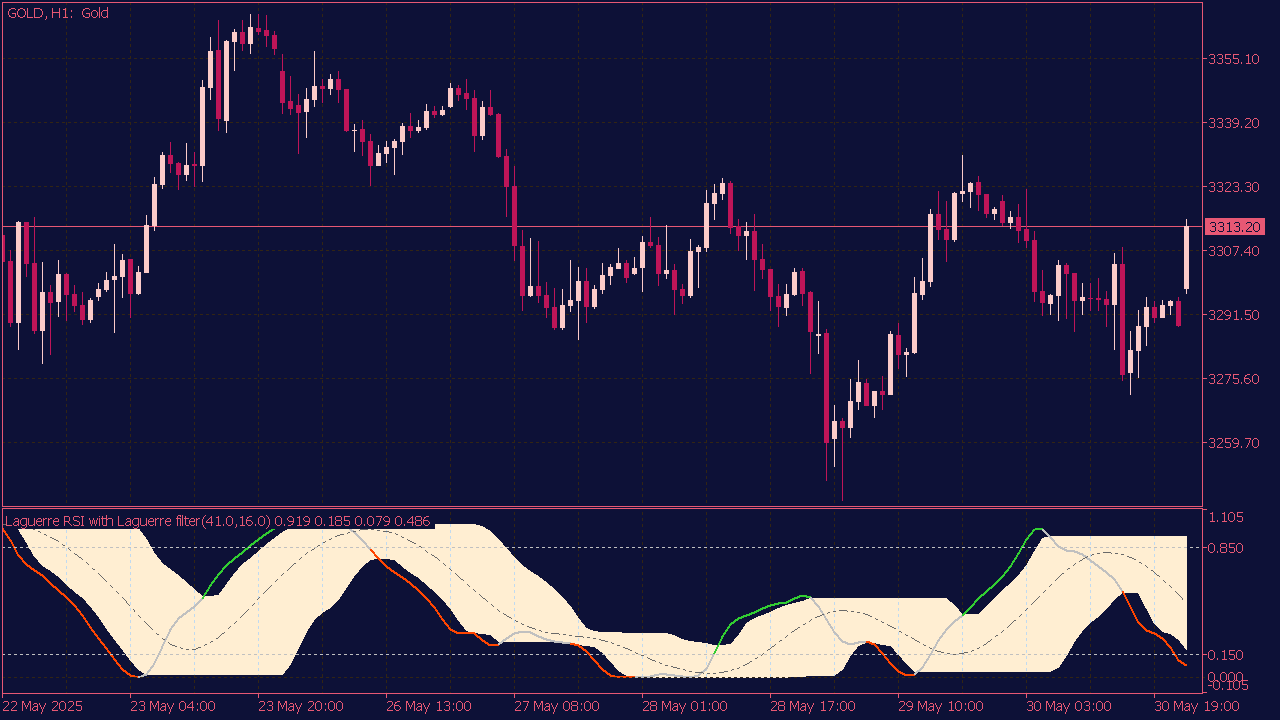
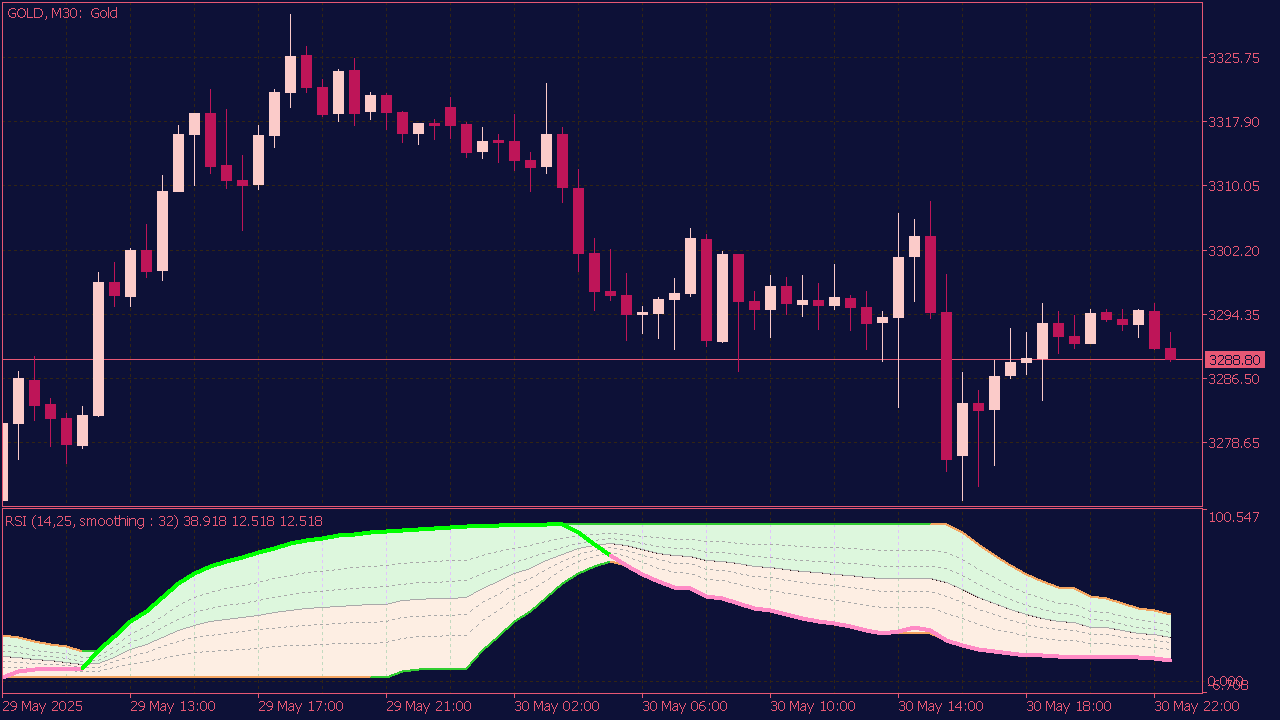
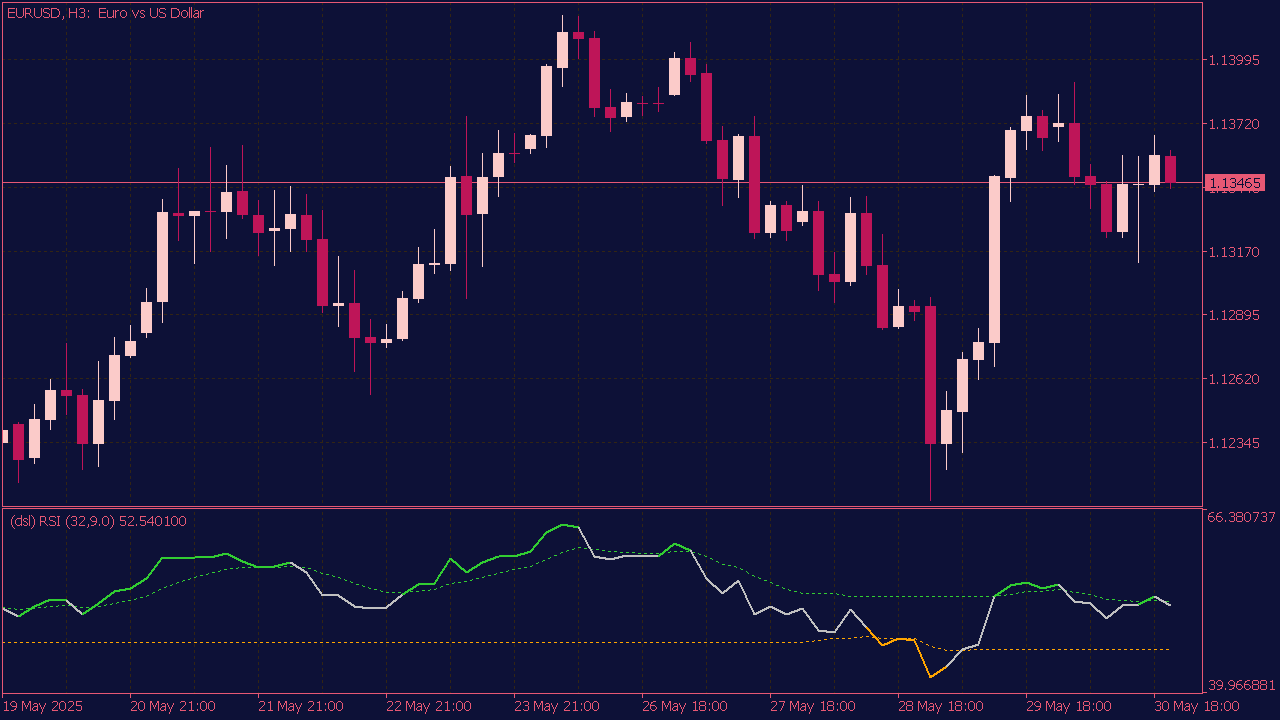
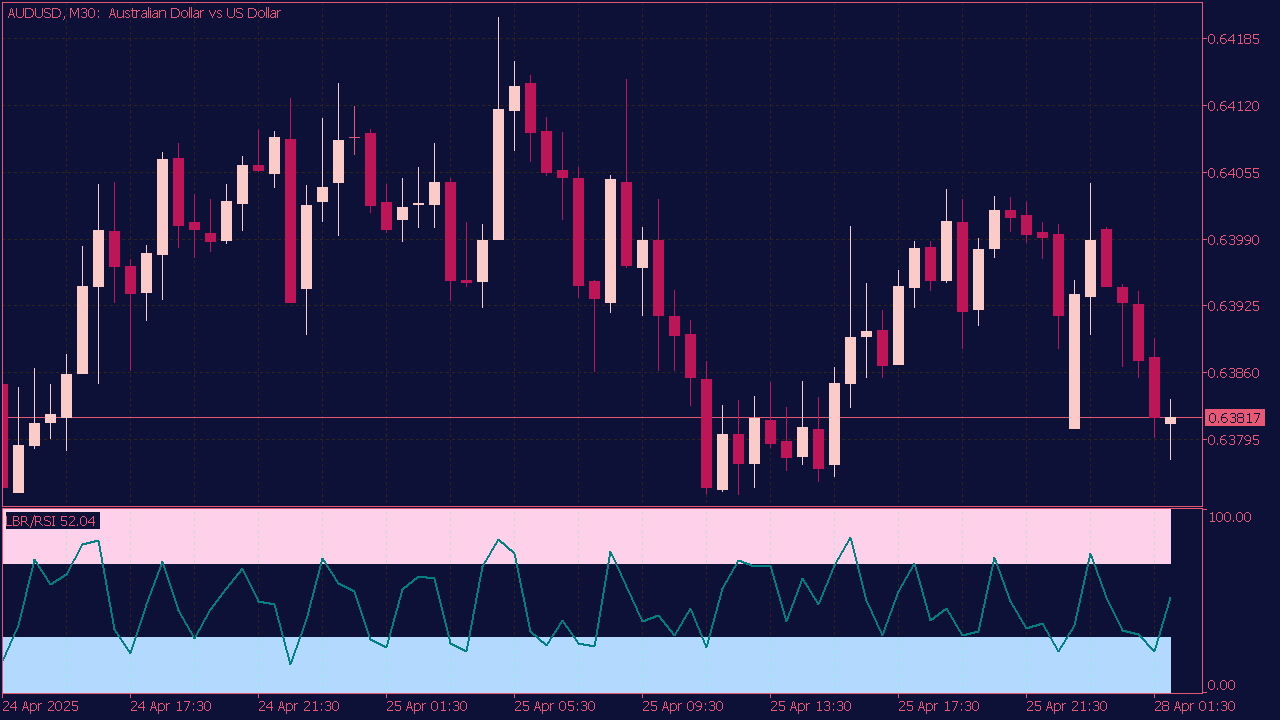
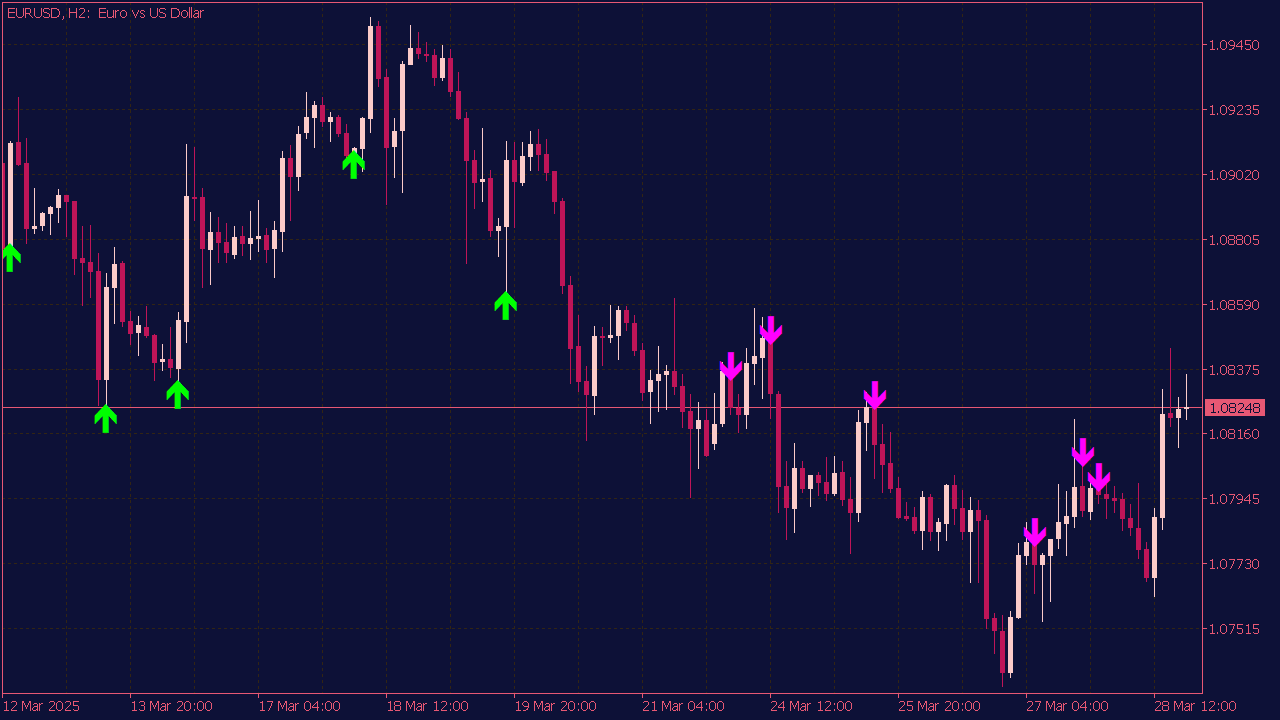
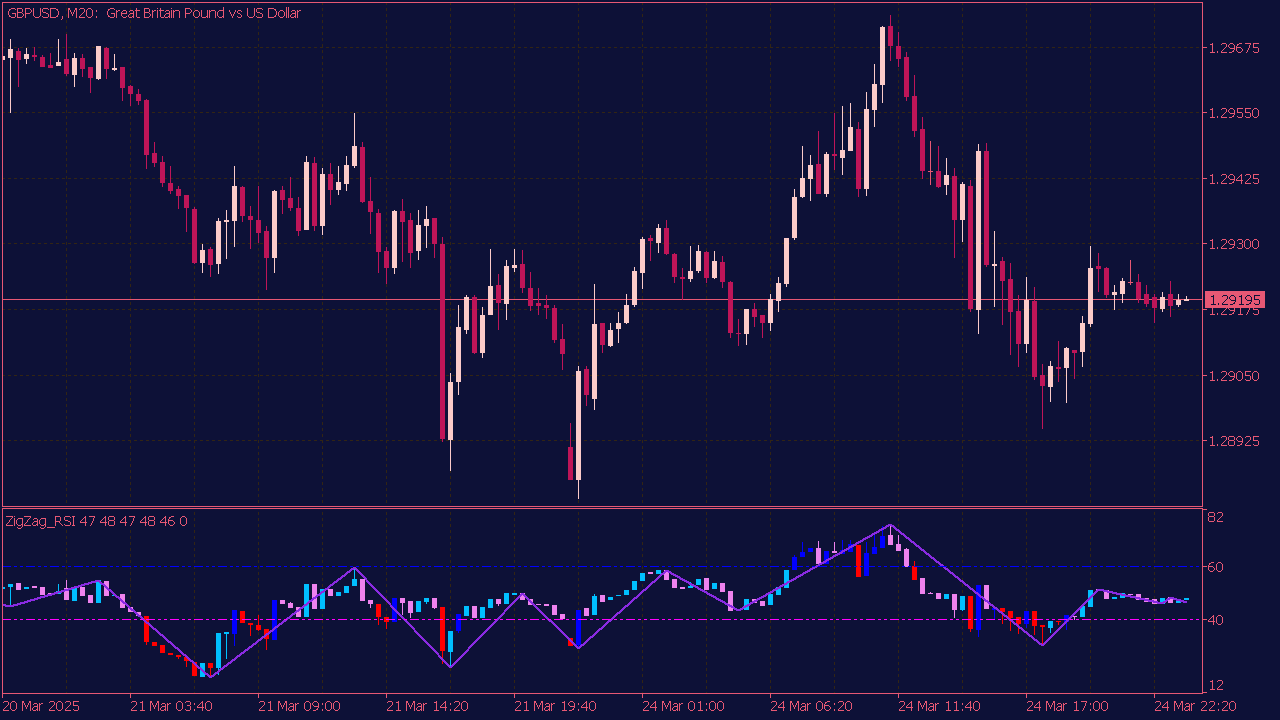
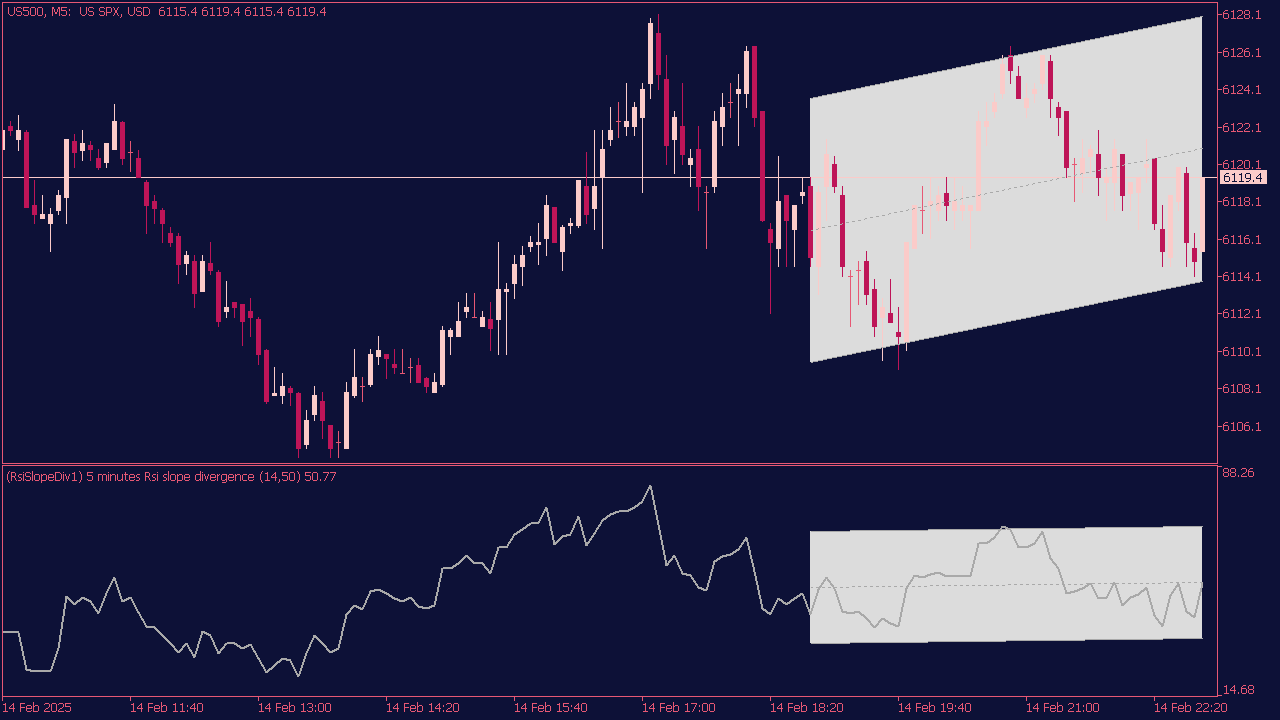
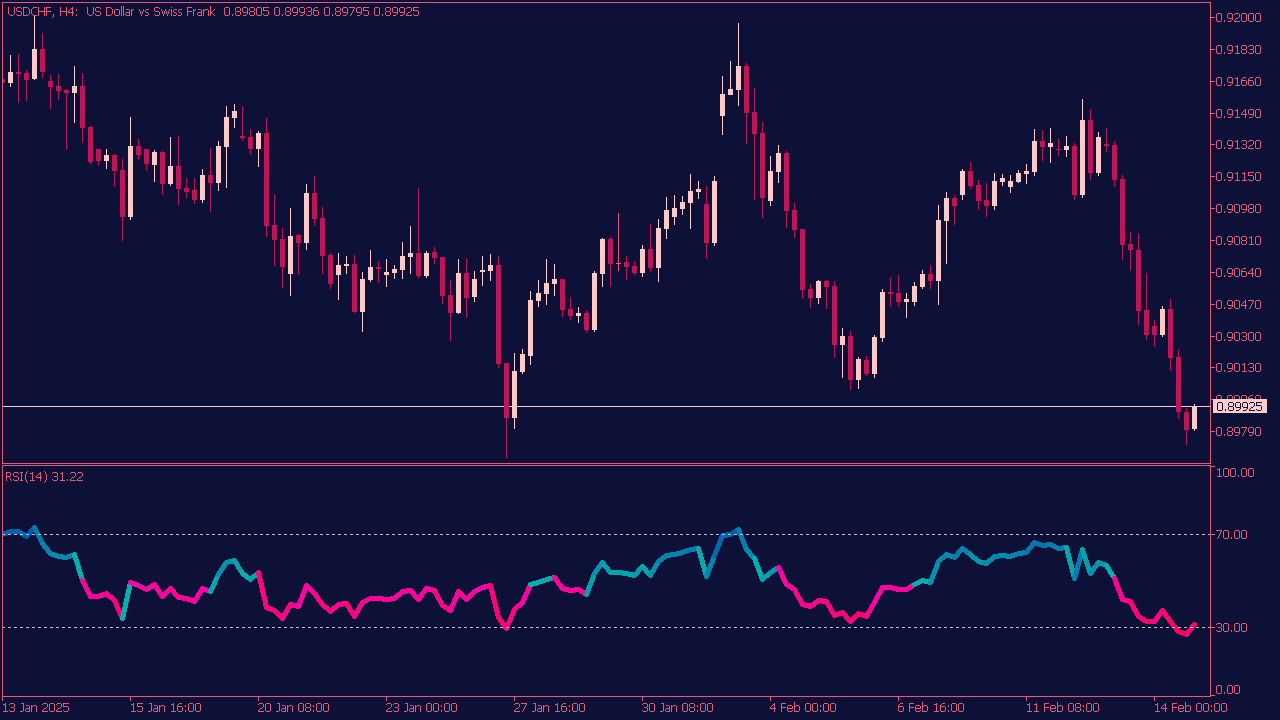
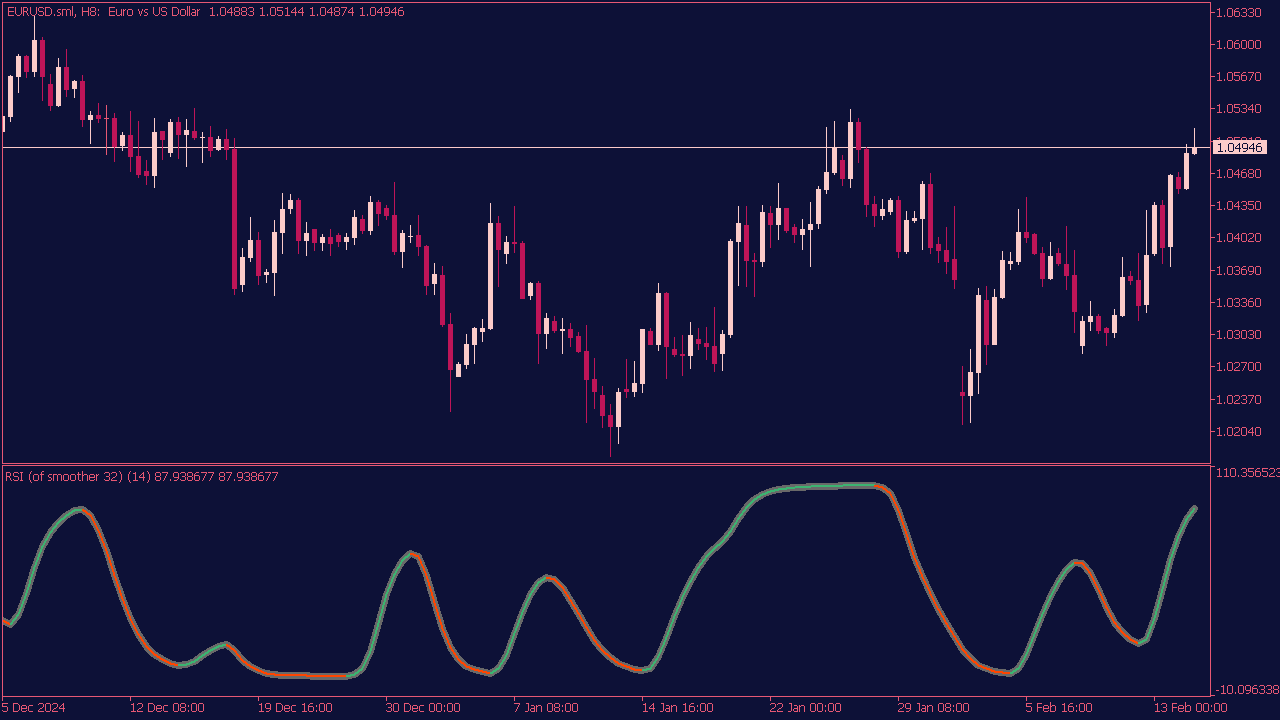
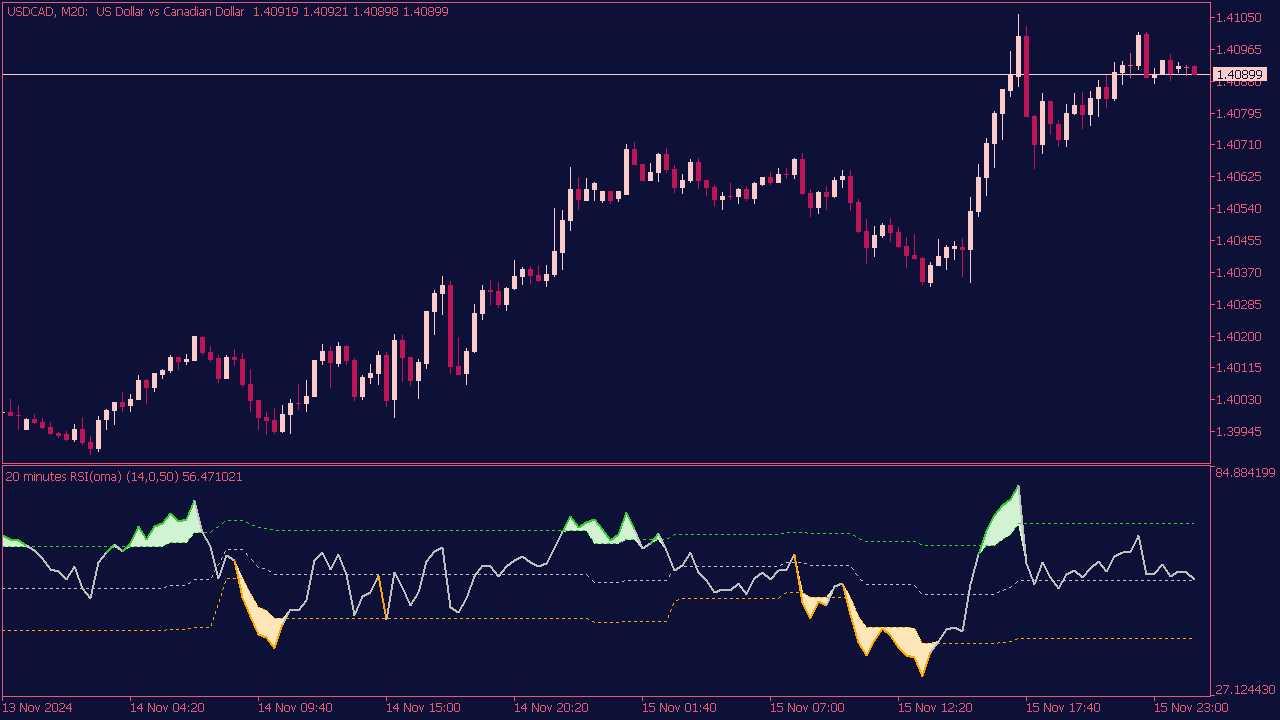
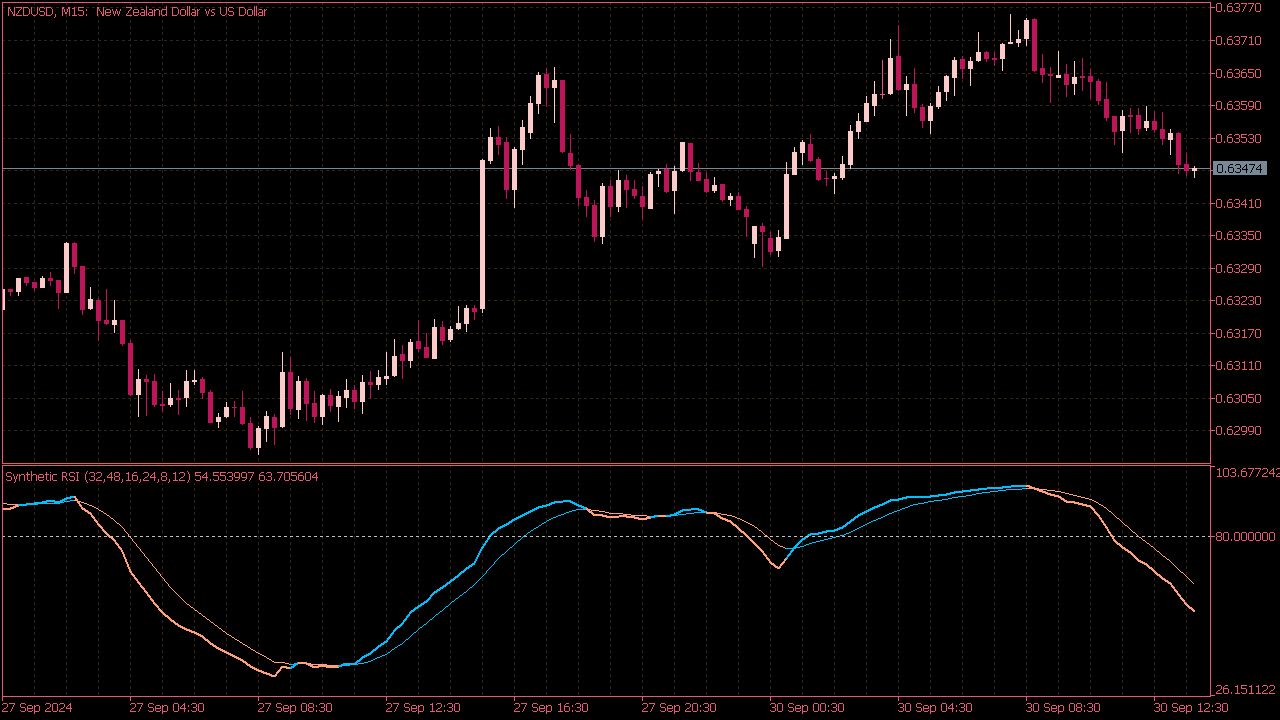
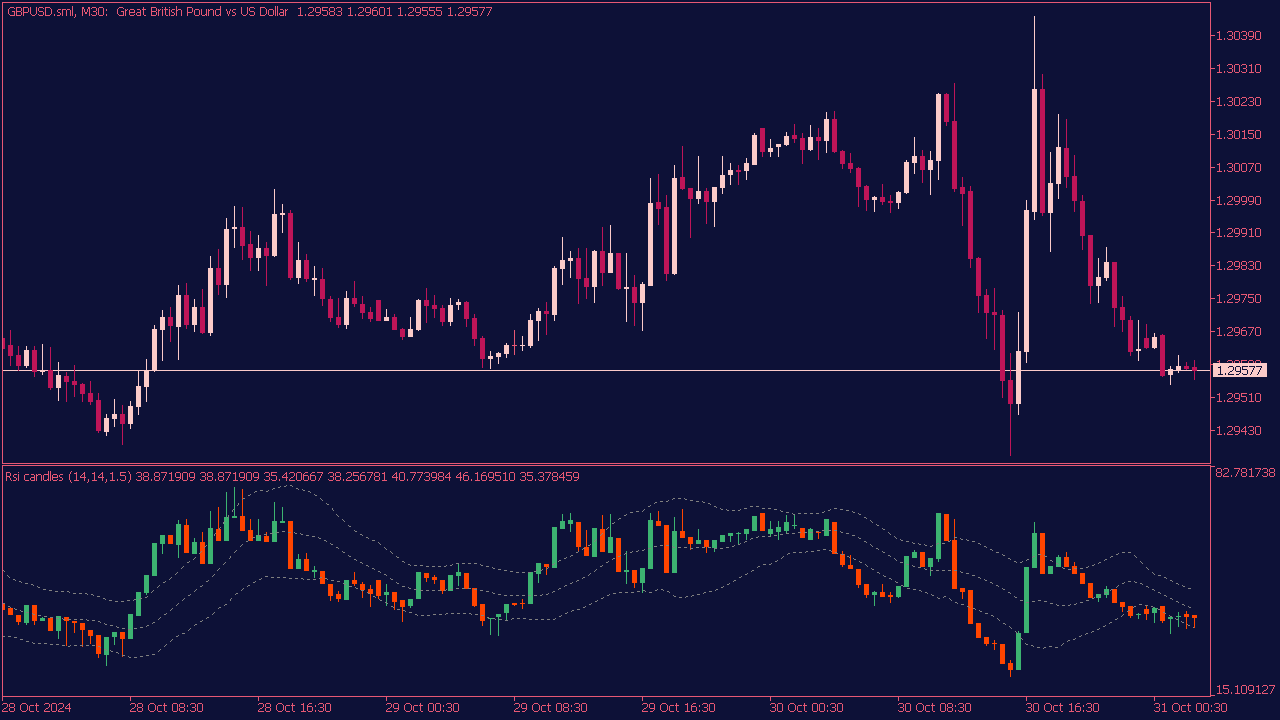
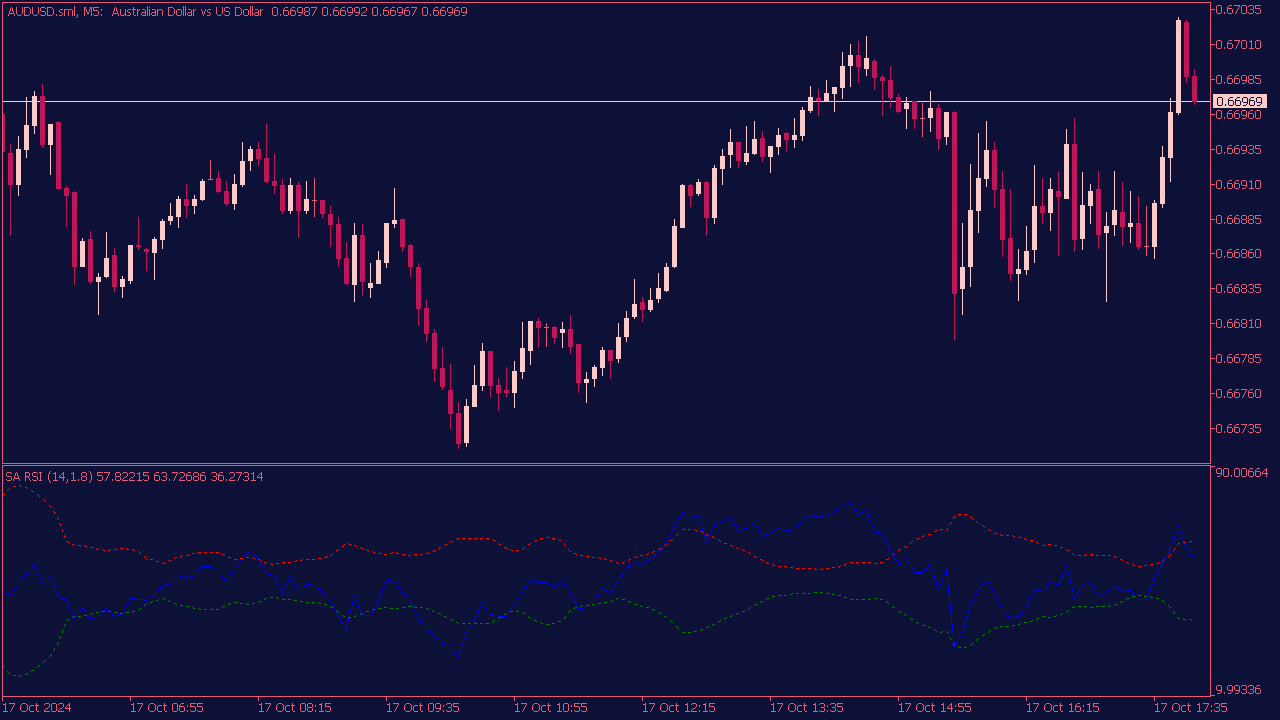
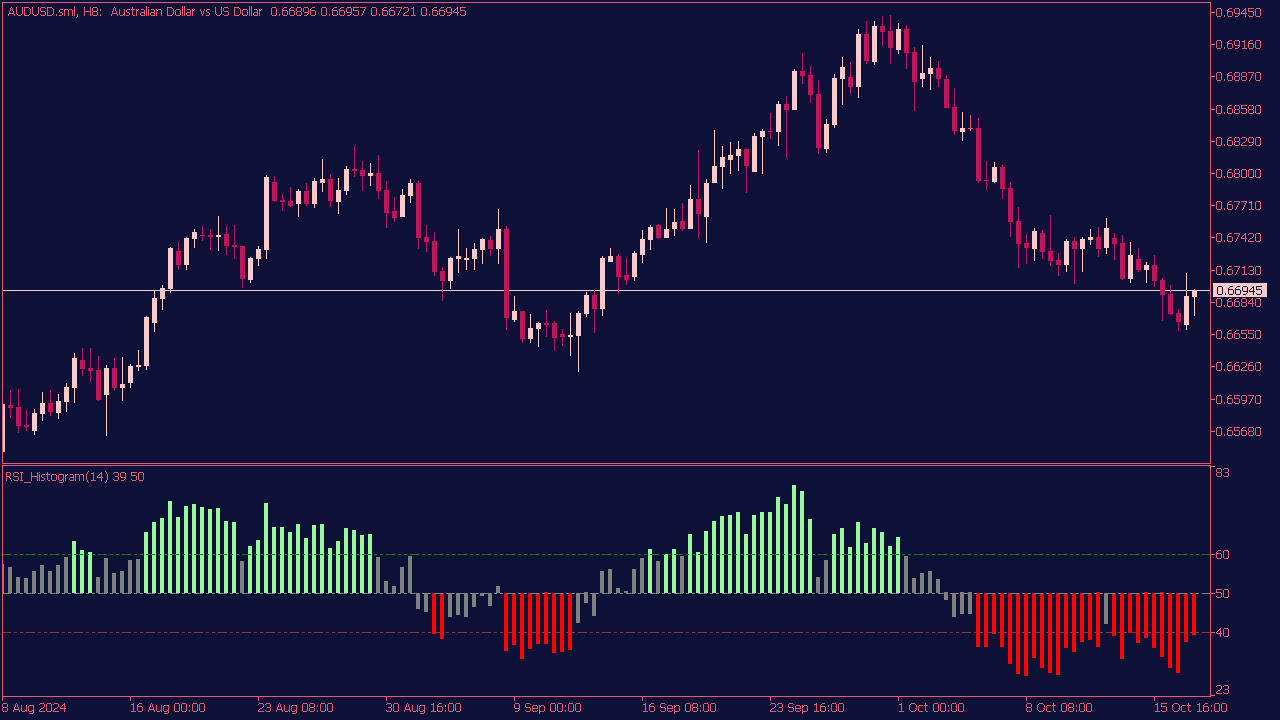
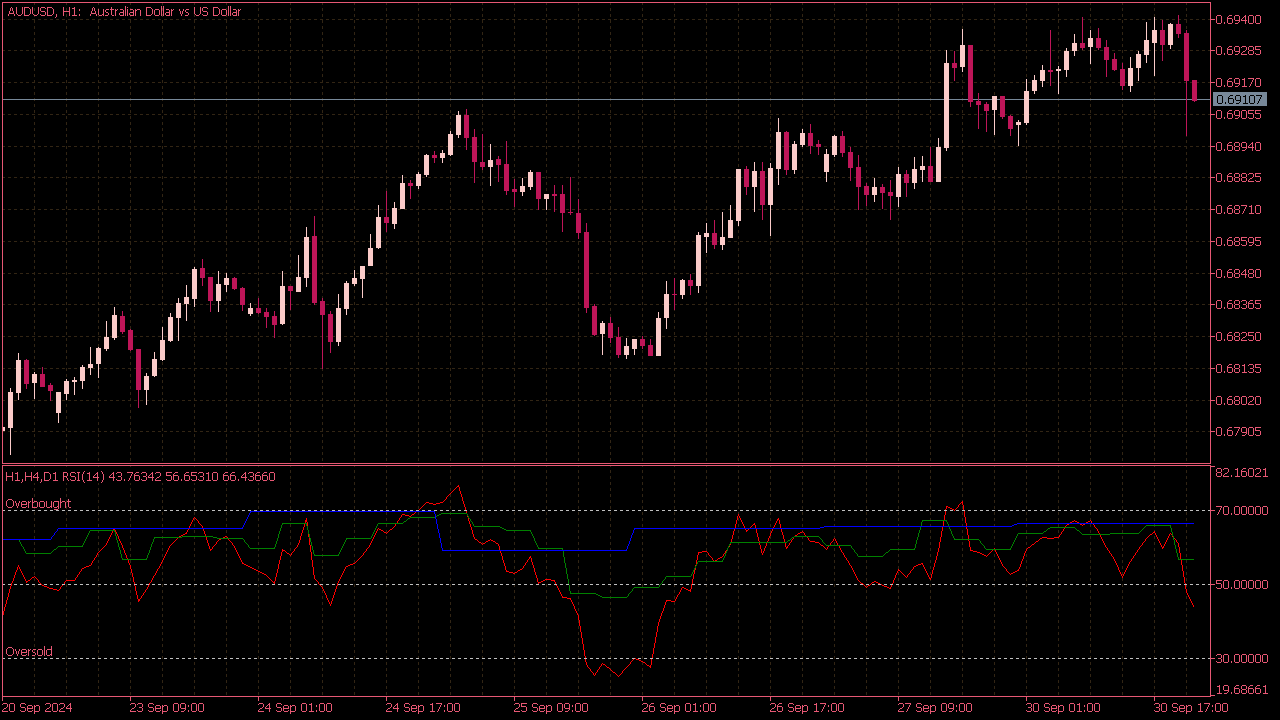
The RSI Divergence Indicator is a technical analysis tool used to identify potential reversals in the price movement of an asset by comparing the Relative Strength Index (RSI) with the price action. Divergence occurs when the price makes a new high or low, but the RSI does not, indicating a possible weakening trend. A bullish divergence occurs when prices decline to a new low while the RSI rises, suggesting a potential price increase ahead, while a bearish divergence occurs when prices increase to a new high while the RSI decreases, signaling a potential downturn. Traders often use this indicator in conjunction with other analysis methods to improve their decision-making.

RSI Indicators for MT5

by Specialist ®️ -

RSI Improved Indicator

RSI Improved Indicator for MT5

The RSI Improved Indicator combines the original RSI calculation with an additional layer of analysis. It calculates the difference between the first RSI and the inverted second RSI (100-RSI2), and then computes the rate of change (ROC) of this difference. This can provide a more nuanced view of the market's momentum and trend, potentially helping traders identify more accurate buy and sell signals.

RSI Indicators for MT5

by Specialist ®️ -

RSI Slope Divergence Indicator

RSI Slope Divergence Indicator for MT5

The RSI Slope Divergence Indicator generates trading signals based on divergences between the Relative Strength Index slope and price movement. A bullish signal occurs when the price makes a new low while the RSI slope shows a higher low, indicating potential upward momentum. Conversely, a bearish signal occurs when the price achieves a new high while the RSI slope forms a lower high, suggesting impending downward pressure. Traders often confirm these signals with additional technical analysis or price action to enhance their decision-making.

RSI Indicators for MT5

by Specialist ®️ -

Multi-RSI Indicator

Multi-RSI Indicator for MT5

The Multi-RSI Indicator allows traders to analyze the momentum of an asset by using multiple RSI values calculated over different periods simultaneously. This approach provides a comprehensive view of market conditions, as it enables the identification of divergences and overbought or oversold conditions across various timeframes. By comparing short, medium, and long-term RSI readings, traders can gain insights into potential trend reversals or confirmations and make more informed trading decisions. To implement this, traders typically overlay several RSI indicators on their charts, each set to distinct periods such as 14, 28, and 7 days, allowing for a nuanced analysis of price action.

RSI Indicators for MT5

by Specialist ®️ -

RSI OMA with Alert Indicator

RSI OMA with Alert Indicator for MT5

The RSI OMA with Alert Indicator is a variation of the traditional RSI that incorporates a moving average to smooth out the RSI values, potentially providing clearer signals regarding market momentum. This indicator tracks the RSI levels while applying a moving average to identify trends and reversals more effectively. The alert feature notifies traders of significant shifts, such as when the RSI crosses specific thresholds or the moving average, suggesting potential buying or selling opportunities. By combining the strengths of both the RSI and moving average, this tool aims to enhance trading accuracy and responsiveness to market conditions.

RSI Indicators for MT5

by Specialist ®️ -

Synthetic RSI Indicator

Synthetic RSI Indicator for MT5

The Synthetic RSI Indicator is a momentum oscillator used to measure the speed and change of price movements, typically oscillating between 0 and 100. To trade using the Synthetic RSI, look for overbought and oversold levels: an RSI value above 80 may indicate an overbought market (a potential sell signal), while a value below 30 suggests an oversold market (a potential buy signal). Additionally, traders can use divergence between the RSI and price action to spot potential reversals. Always incorporate additional analysis and risk management strategies to enhance your trading effectiveness.

RSI Indicators for MT5

by Specialist ®️ -

RSI Candles with Keltner Channel

RSI Candles with Keltner Channel for MT5

When trading with RSI candles combined with Keltner Channels in a subwindow, focus on identifying overbought or oversold conditions indicated by the RSI (typically above 70 or below 30) and observe the position of price relative to the Keltner Channels. A price that touches or breaks the upper channel while the RSI shows overbought conditions could suggest a potential reversal, while a price hitting the lower channel with an oversold RSI might indicate a buying opportunity. Additionally, look for divergence between the RSI and price action for further confirmation before entering trades. Always use risk management strategies to safeguard your capital.

RSI Indicators for MT5

by Specialist ®️ -

Self Adjusting RSI Indicator

Self Adjusting RSI Indicator for MT5

The Self Adjusting RSI Indicator is a dynamic version of the traditional RSI, designed to adapt its sensitivity based on market conditions. To effectively utilize this indicator, consider the following tips: first, use varying time frames to identify trends, as a shorter time-frame may provide more responsive signals while a longer one offers stability; second, look for divergence between price action and the Self Adjusting RSI to spot potential reversals; third, combine the indicator with other tools such as moving averages or trend lines to confirm signals and reduce false positives; finally, always practice sound risk management by setting stop-loss orders and determining position sizes based on your risk tolerance.

RSI Indicators for MT5

by Specialist ®️ -

RSI Histogram Indicator

RSI Histogram Indicator for MT5

The RSI Histogram Indicator is used to gauge momentum and potential trend reversals. When the histogram is above zero, it indicates bullish momentum, and traders may look for buy signals, especially when the RSI crosses above a threshold of 60. Conversely, when the histogram is below zero, it signals bearish momentum, and traders may consider selling when the RSI crosses below 40. A bullish divergence occurs when the price makes a lower low while the RSI makes a higher low, suggesting a potential reversal to the upside. Conversely, a bearish divergence, where the price makes a higher high while the RSI makes a lower high, indicates a potential reversal to the downside. Always combine these signals with other technical indicators and risk management practices for better decision-making.

Relative Strength Index (RSI) Indicators for MT5

by Specialist ®️ -

MTF RSI Indicator

MTF RSI Indicator for MT5

The MTF RSI Indicator helps traders analyze market conditions across different time frames to make informed trading decisions. Signals are typically generated based on RSI levels: an RSI above 70 might indicate an overbought condition (suggesting a potential sell signal), while an RSI below 30 indicates an oversold condition (suggesting a potential buy signal). Traders often look for convergence between time frames, such as a bullish signal on a lower time frame coinciding with a bullish trend on a higher time frame, to enhance the reliability of the signals. Always consider combining MTF RSI insights with other technical analysis tools for confirmation before executing trades.