MT5 Auto Fibonacci, Pivot Points and Murrey Math Indicators

MT5 Auto Fibonacci, Pivot Points and Murrey Math Indicators

by Specialist 🫡 -
Number of replies: 12

Auto Pivot Point Indicator

Auto Pivot Point Indicator for MT5

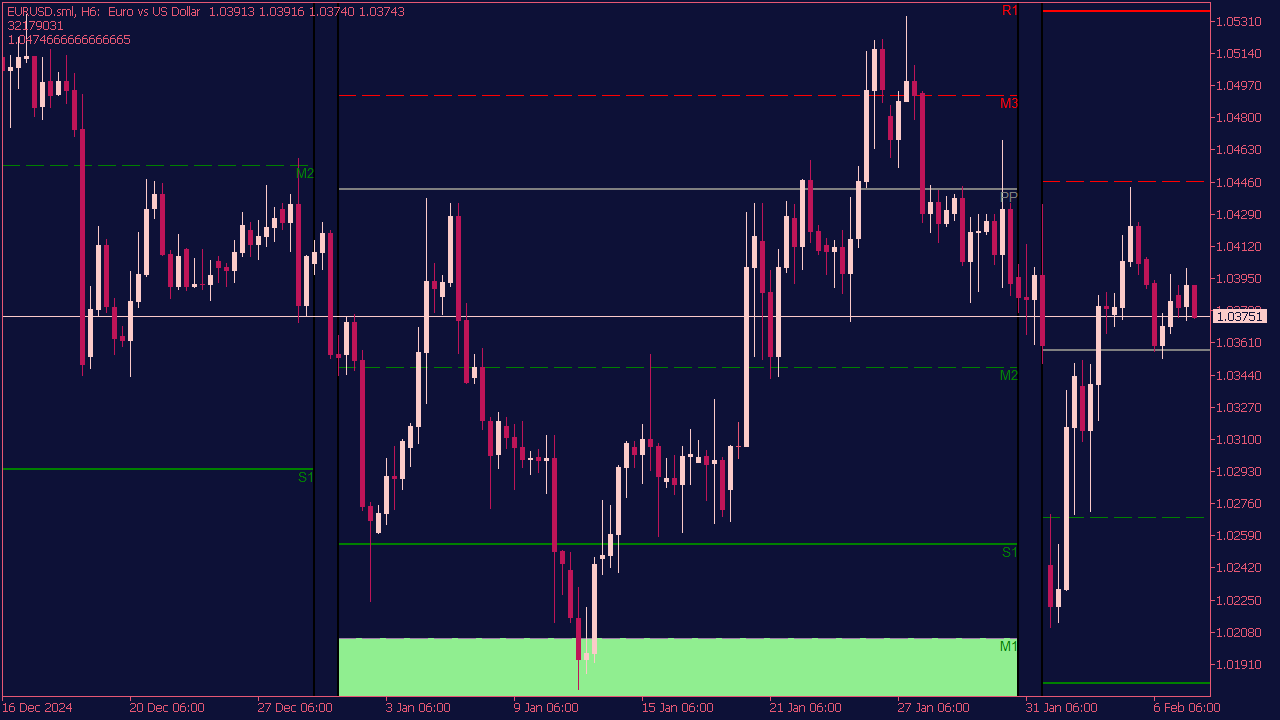
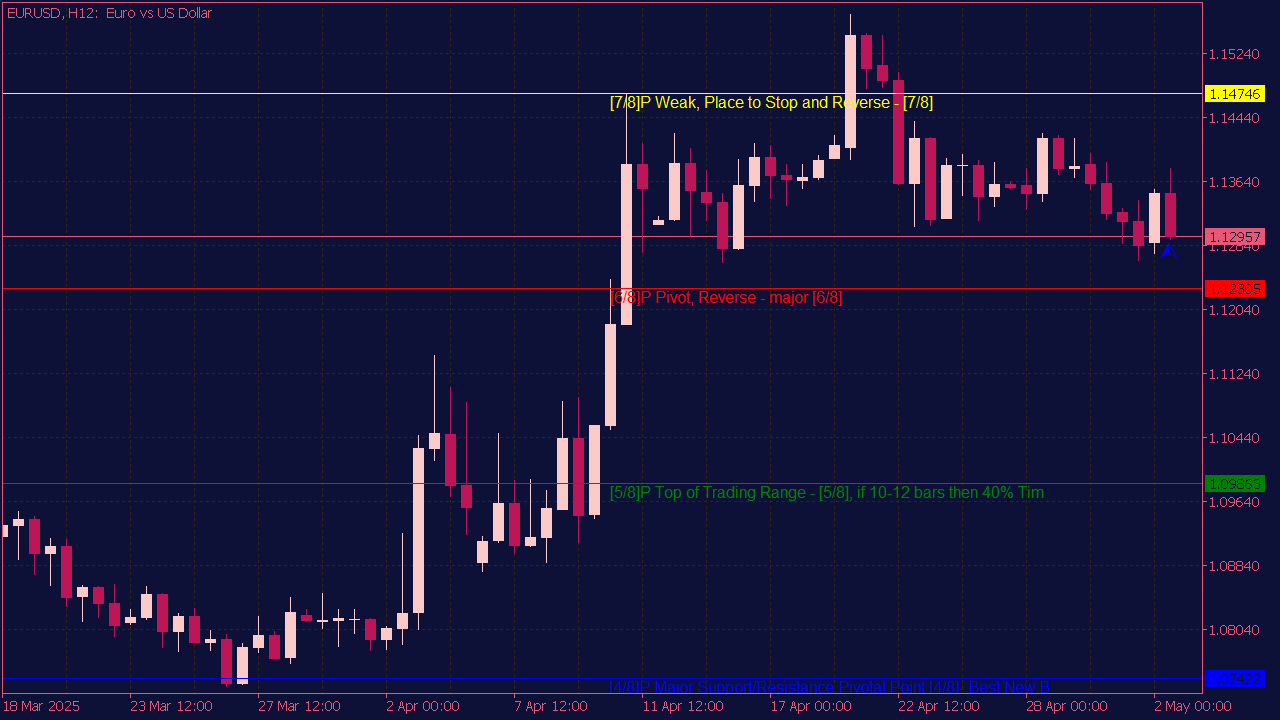
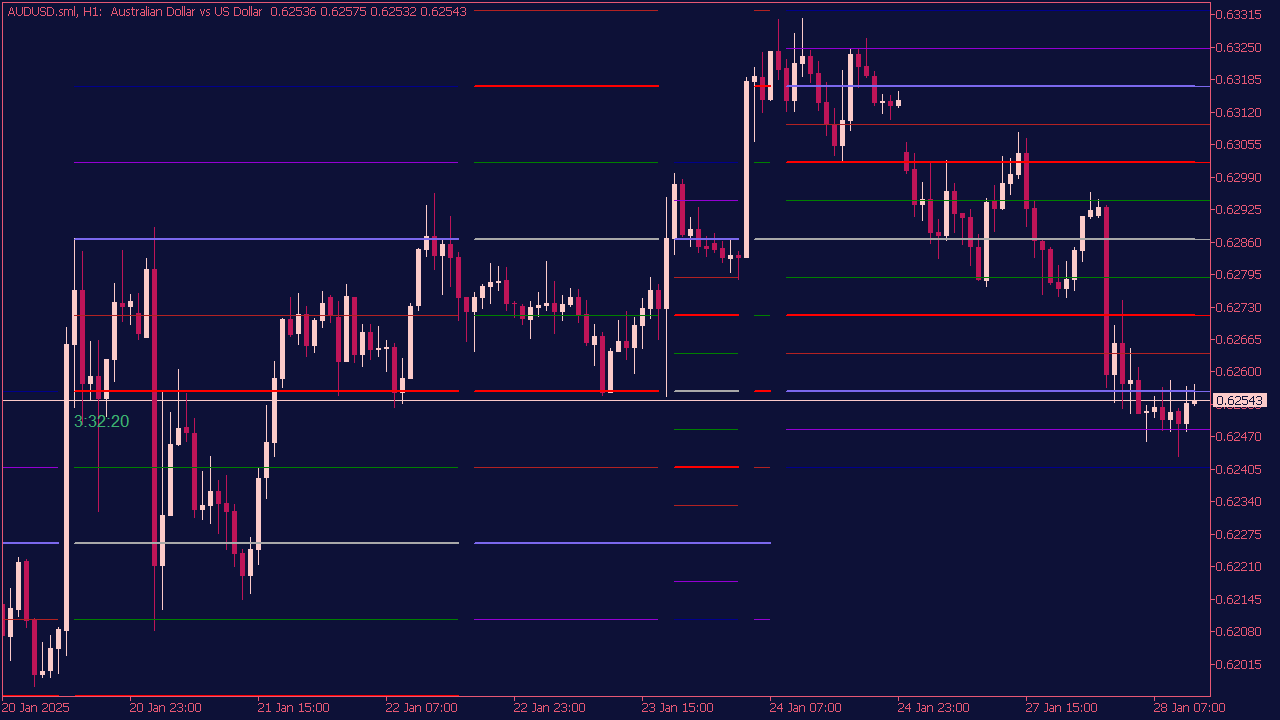
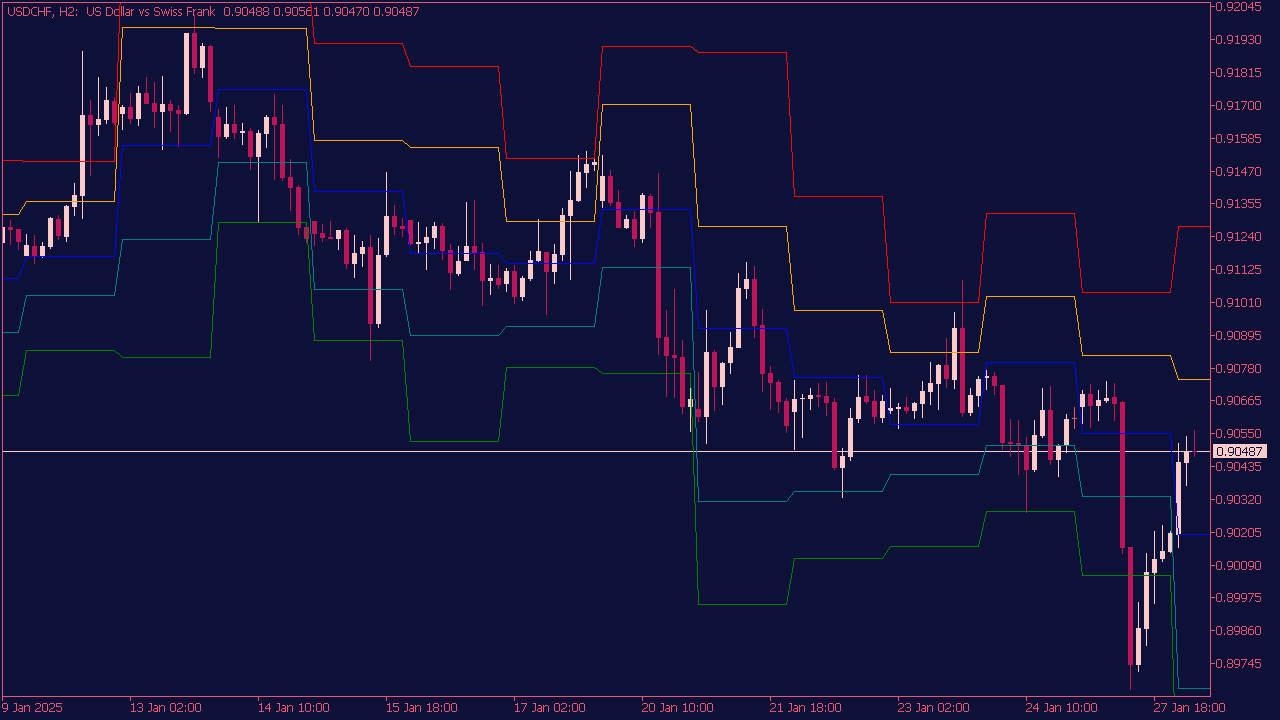
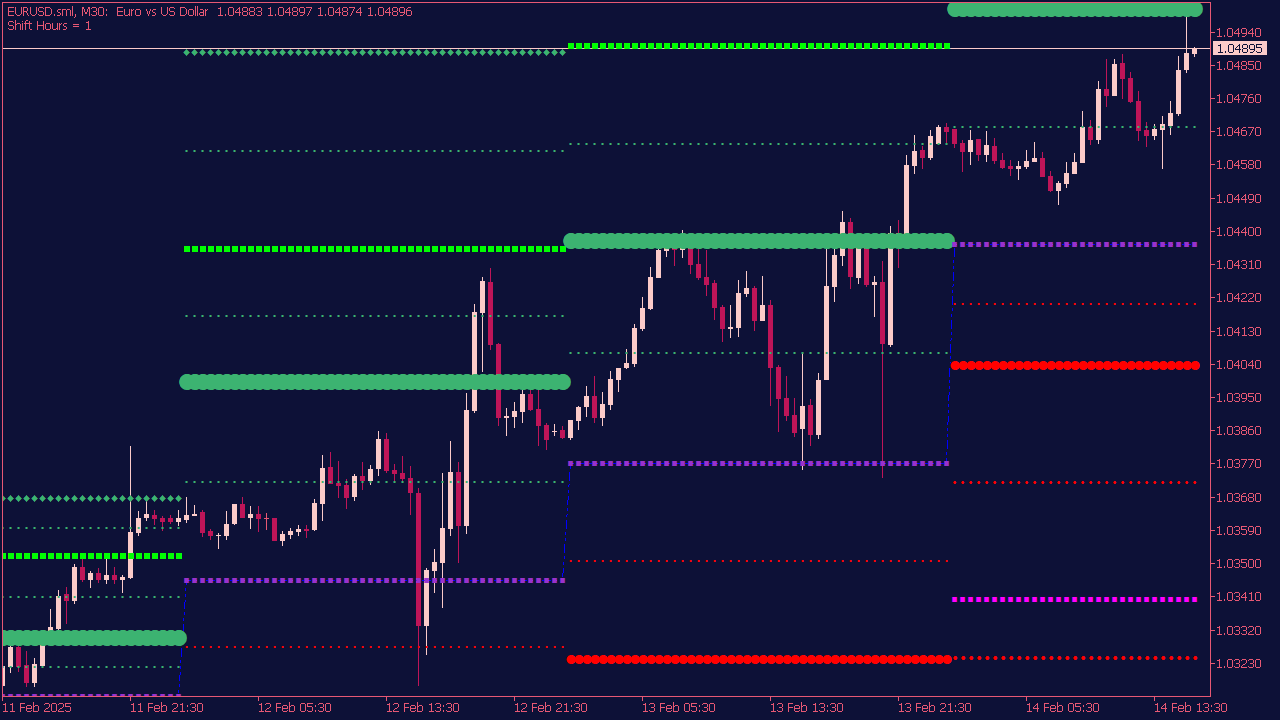
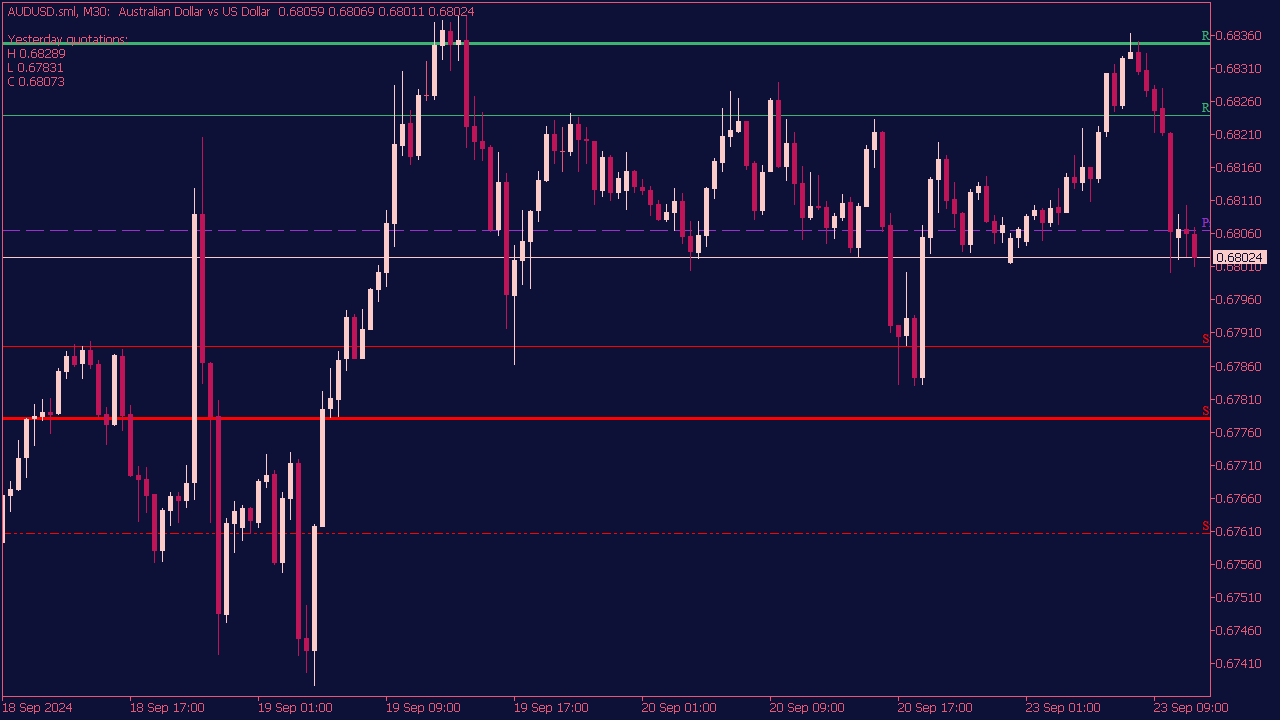
The Auto Pivot Point Indicator is a technical analysis tool used by traders to identify potential support and resistance levels in the financial markets. It automatically calculates pivot points based on historical price data, typically using the previous day's high, low, and close prices. These pivot levels can help traders determine entry and exit points for trades, as well as identify market trends and reversals. The indicator typically displays multiple levels, including the main pivot point, support levels below it, and resistance levels above, facilitating informed decision-making in trading strategies.

Auto Fibonacci, Pivot Points and Murrey Math Indicators for MT5

by Specialist 🫡 -

Auto Fibonacci Indicator

Auto Fibonacci Indicator for MT5

The Auto Fibonacci Indicator helps traders identify potential entry points by plotting Fibonacci retracement levels automatically based on the price action of a particular asset. Traders often look for entry signals when the price approaches key Fibonacci levels (such as 23.6%, 38.2%, 50%, 61.8%, and 78.6%) which may act as support or resistance. A common strategy is to enter a long position when the price bounces off a retracement level accompanied by bullish signals (like candlestick patterns or indicators) or a short position if it fails at a Fibonacci resistance level. Always consider incorporating additional technical analysis and risk management techniques for more effective trading.

Auto Fibonacci, Pivot Points and Murrey Math Indicators for MT5

by Specialist 🫡 -

Auto Fibonacci Retracement Indicator

Auto Fibonacci Retracement Indicator for MT5

To trade using an Auto Fibonacci Retracement Indicator, first identify a significant price movement (uptrend or downtrend) on your chart. The indicator will automatically plot Fibonacci levels based on this movement, typically between the swing high and swing low. Wait for the price to retrace to one of the key Fibonacci levels (such as 23.6%, 38.2%, 50%, 61.8%, or 78.6%) and look for confirmation signals, such as candlestick patterns or other technical indicators (e.g., RSI or MACD), to determine potential reversal points. Enter a trade when you have confirmation, setting your stop loss below the relevant Fibonacci level, and aim for a target near the next significant resistance or support level. Always manage risk effectively by adhering to your trading plan.

Auto Fibonacci, Pivot Points and Murrey Math Indicators for MT5

by Specialist 🫡 -

Daily Pivot Shift Full Indicator

Daily Pivot Shift Full Indicator for MT5

The DailyPivot_Shift_Full Indicator is a modified version of the standard DailyPivot indicator, designed to provide more flexibility and accuracy. It allows users to shift the calculation of pivot levels based on a specified time zone, enabling calculations based on local time rather than server time. It also excludes weekend data when calculating Monday's levels. Its "Full" designation suggests it can calculate levels for every bar on a chart, making it a powerful tool for backtesting and analyzing market behavior relative to pivot points in offline mode.

Auto Fibonacci, Pivot Points and Murrey Math Indicators for MT5

by Specialist 🫡 -

Fibo Pivot Indicator

Fibo Pivot Indicator for MT5

The Fibo Pivot Indicator combines Fibonacci retracement levels with pivot points to identify potential support and resistance areas in trading. Typical trading setups include entering long positions when the price bounces off a key Fibonacci support level and pivot point in a bullish trend, or entering short when it encounters resistance at Fibonacci levels and pivot points in a bearish trend. Traders often look for additional confirmation through candlestick patterns, volume spikes, or oscillators like the RSI to enhance the reliability of their entries and exits. Always consider risk management practices, such as stop-loss orders and position sizing, to mitigate potential losses.

Auto Fibonacci, Pivot Points and Murrey Math Indicators for MT5

by Specialist 🫡 -

Pivot Point Universal Indicator

Pivot Point Universal Indicator for MT5

The Pivot Point Universal Indicator is a tool that displays historical pivot levels on a chart without using objects, supporting five pivot level variants and three calculation periods: daily, weekly, and monthly. For daily pivots, users can adjust the calculation based on a specified GMT time shift.

Auto Fibonacci, Pivot Points and Murrey Math Indicators for MT5

by Specialist 🫡 -

Pivot Fibs Custom Indicator

Pivot Fibs Custom Indicator for MT5

The Pivot Fibs Custom Indicator plots Fibonacci retracement levels based on pivot points calculated from candles within a user-defined timeframe. This allows traders to analyze potential support and resistance areas on a chosen timeframe, offering insights into price movements and potential trading opportunities based on Fibonacci ratios applied to these pivotal levels.

Auto Fibonacci, Pivot Points and Murrey Math Indicators for MT5

by Specialist 🫡 -

Pivot Lines Indicator with Time Zones

Pivot Lines Indicator with Time Zones for MT5

The Pivot Lines Indicator with Time Zones is a tool used in trading to identify potential support and resistance levels based on pivot points, while also considering specific market time zones. This indicator typically plots horizontal lines on the chart representing the pivot point and its support and resistance levels, which traders use to make buy or sell decisions. When the price approaches these pivot lines, traders may look for buy signals (when prices bounce off support levels) or sell signals (when prices reverse at resistance levels). Additionally, integrating time zones can help traders understand the best times to enter or exit trades based on market activity and volatility during specific trading sessions. This can enhance the effectiveness of trading strategies, especially for those who trade during different market hours.

Auto Fibonacci, Pivot Points and Murrey Math Indicators for MT5

by Specialist 🫡 -

Pivot Point Indicator

Pivot Point Indicator for MT5

Pivot Point Indicators are commonly used in trading to identify potential support and resistance levels, allowing traders to make informed decisions on entry and exit points. A basic trading setup includes determining the daily pivot point by calculating the average of the high, low, and close prices from the previous day. Traders often look for buy signals when the price is above the pivot point, especially if it bounces off support levels, while sell signals are considered when it is below the pivot point, particularly if it reacts to resistance levels. Additional confirmation can come from complementary indicators like moving averages or RSI to enhance the reliability of the setups.

Auto Fibonacci, Pivot Points and Murrey Math Indicators for MT5

by Specialist 🫡 -

Fibonacci Pivot Point Indicator

Fibonacci Pivot Point Indicator for MT5

The Fibonacci Pivot Point Indicator uses Fibonacci retracement levels combined with traditional pivot points to identify potential support and resistance levels in trading. Traders can look for entries when the price approaches these Fibonacci levels, signaling potential reversals. For buy entries, traders might look for price bounces off key Fibonacci support levels, while sell entries might be identified near resistance levels. Combining this indicator with other tools, such as candlestick patterns or momentum indicators, can enhance entry timing and improve trading decisions. It’s important to implement proper risk management and test strategies in a demo environment before trading live.

Auto Fibonacci, Pivot Points and Murrey Math Indicators for MT5

by Specialist 🫡 -

Daily Fibo Piv DK Indicator

Daily Fibo Piv DK Indicator for MT5

The Daily Fibo Piv DK Indicator is used to identify key support and resistance levels based on Fibonacci retracement levels alongside traditional pivot points. To trade using this indicator, look for price actions at these levels: when the price approaches a resistance level, consider potential short positions or scaling back on long positions, and vice versa for support levels. Confirm signals with additional tools, such as candlestick patterns or momentum indicators, to increase the reliability of your trades. Always set appropriate stop-loss orders and maintain a risk management strategy.