MT5 Volume Indicators with Market Profile, OBV and Divergence

MT5 Volume Indicators with Market Profile, OBV and Divergence

by Specialist 🫡 -
Number of replies: 13

OBV Extended Indicator

OBV Extended Indicator for MT5

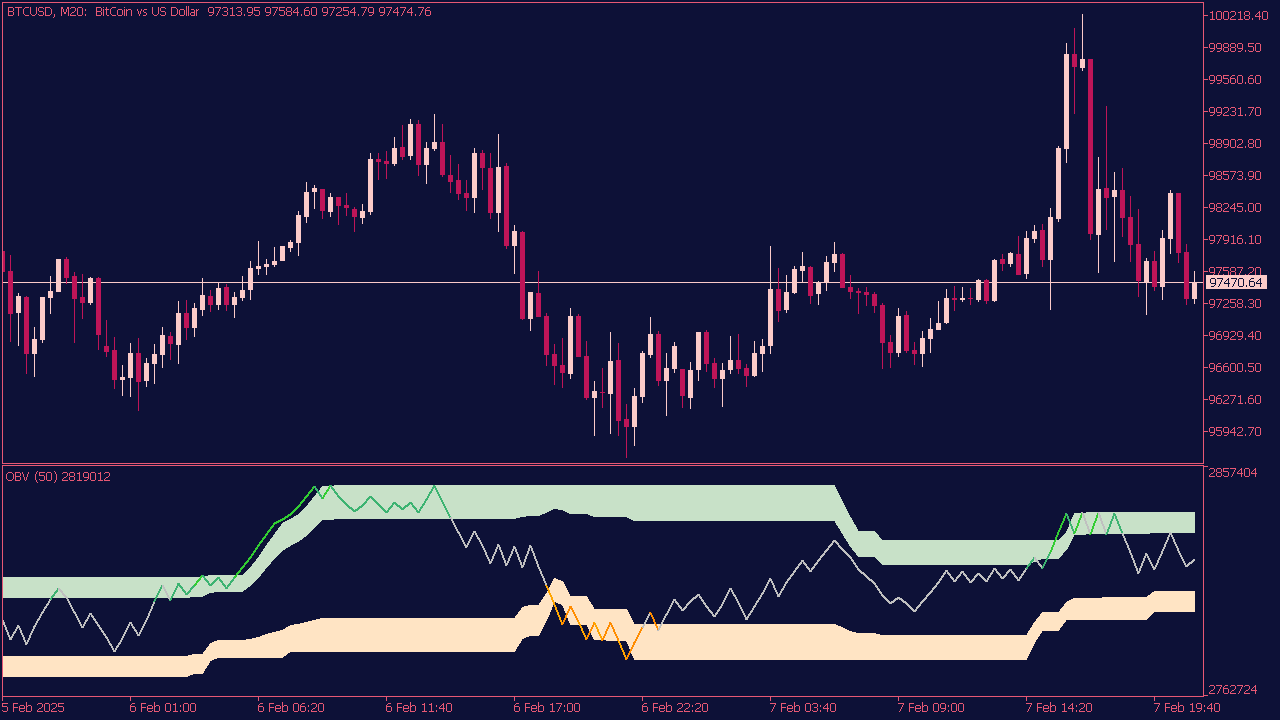
On-Balance Volume (OBV) is a momentum indicator that leverages volume flow to forecast stock price movements, introduced by Joseph Granville in his 1963 book. While traditional OBV can be too sensitive and lacking in actionable signals, this modified version incorporates Donchian channels to improve its utility by providing clearer indications of potential breaks and retracements. It is recommended to utilize this enhanced OBV similarly to the original, while also monitoring color changes for potential trading signals.

Volume Indicators for MT5

by Specialist 🫡 -

Volume Profile (VP) on Time Range V6 Indicator

Volume Profile (VP) on Time Range V6 Indicator for MT5

The Volume Profile Indicator is a technical analysis tool that displays trading volume at various price levels, helping traders identify key support and resistance areas. A buy signal may occur when the price approaches a low-volume node after a price drop, indicating potential support, while a sell signal may arise when the price reaches a high-volume node after an upswing, suggesting resistance. Traders often use the Volume Profile in conjunction with other indicators to confirm buy or sell decisions, ensuring a more comprehensive analysis of market conditions.

Volume Indicators for MT5

by Specialist 🫡 -

Cumulative Volume Indicator

Cumulative Volume Indicator for MT5

The Cumulative Volume Indicator is a useful tool for analyzing volume data. It displays the total volume over a selected period, providing various ways to represent the data: combined or separated, and in relative or absolute values. This indicator has three input parameters: Period for setting the calculation period, Combined to choose between combined and separated display, and Relative to select between relative and absolute values.

Volume Indicators for MT5

by Specialist 🫡 -

Bulls Bears Volume Indicator

Bulls Bears Volume Indicator for MT5

The Bulls Bears Volume Indicator aims to visualize the strength and direction of market movement based on bull and bear volumes. It calculates a "Bull-Bear Index" by subtracting bear volume from bull volume when both are positive, subtracting bull volume from bear volume when both are negative, and summing them when they have opposite signs. This index is then multiplied by a volume coefficient (either tick or real volume). Finally, a delta filter is applied, setting any index values below zero to zero, effectively removing flat noise and highlighting significant bullish or bearish volume activity.

Volume Indicators for MT5

by Specialist 🫡 -

Rainbow Volume Indicator

Rainbow Volume Indicator for MT5

The indicator displays a colored tick-volume histogram based on five criteria: volume and price increases (green), volume and price decreases (sky blue), increasing volume with falling price (red), decreasing volume with rising price (golden), and no change in either volume or price (pale gray), with comparisons made between current data and data from N periods prior.

Volume Indicators for MT5

by Specialist 🫡 -

Volume Zone Oscillator with Floating Levels

Volume Zone Oscillator with Floating Levels for MT5

The Volume Zone Oscillator (VZO), based on the principles articulated in the "In The Volume Zone" article by Walid Khalil and David Steckler, integrates the strengths of both trending and oscillating indicators in technical analysis. As highlighted by John J. Murphy in "Technical Analysis of the Financial Markets," oscillators help identify overbought and oversold conditions, uncover divergences that indicate potential market strength or weakness, and provide critical trading signals through zero line crossings. This enhanced version of the VZO incorporates floating levels, offering a more dynamic approach to trend determination.

Volume Indicators for MT5

by Specialist 🫡 -

Buy Sell Volume Pressure Indicator

Buy Sell Volume Pressure Indicator for MT5

The Buy Sell Volume Pressure Indicator is a technical analysis tool used in trading to gauge the strength of buying and selling pressure in the market. It analyzes volume data to determine whether the volume supports upward or downward price movements, providing traders with insights into potential market reversals or continuations. Typically, a high buying volume compared to selling volume may indicate bullish sentiment, while higher selling volume can signify bearish sentiment. This indicator can be particularly useful for confirming trends and making informed trading decisions in conjunction with other technical indicators.

Volume Indicators for MT5

by Specialist 🫡 -

Price Volume Divergence Indicator

Price Volume Divergence Indicator for MT5

The Price Volume Divergence Indicator helps traders identify potential trend reversals by analyzing discrepancies between price movements and trading volume. A bullish entry signal typically occurs when prices are making higher lows while volume is declining, suggesting weakening selling pressure, while a bearish entry signal may arise when prices are making lower highs alongside decreasing volume, indicating weakening buying momentum. Traders often use these signals in conjunction with other technical analysis tools to confirm entries and manage risk effectively.

Volume Indicators for MT5

by Specialist 🫡 -

Candlestick High/Low Volume Indicator

Candlesticks with High/Low Volume for MT5

The Candlestick High/Low Volume Indicator combines candlestick patterns with volume analysis to provide insights into potential price reversals or continuations. When a candlestick closes at a significant high or low with accompanying high volume, it often signals strong momentum, suggesting that the price direction is likely to continue. Conversely, a high-volume candlestick at a peak may indicate distribution, while one at a trough can suggest accumulation. This indicator helps traders gauge market sentiment, reinforcing the strategy of trading based on price action while considering the strength indicated by volume.

Volume Indicators for MT5

by Specialist 🫡 -

Volume Average Percent Indicator

Volume Average Percent Indicator for MT5

The Volume Average Percent Indicator (VAP) aims to identify potential trading entries by analyzing the relationship between current volume and historical averages. Traders look for signals when the current trading volume exceeds a specified percentage of the average volume over a given period, which may suggest increased interest and potential price movement. For bullish entries, traders may seek moments when volume exceeds the average by a certain threshold, indicating strong buying interest, while bearish entries might focus on volume spikes during price declines. Integrating VAP with other indicators and market context can improve trade decision accuracy.

Volume Indicators for MT5

by Specialist 🫡 -

Laguerre Volume Indicator

Laguerre Volume Indicator for MT5

The Laguerre Volume Indicator is used in trading to analyze market momentum by smoothing out volume fluctuations. To set up trading strategies with this indicator, traders can look for crossovers: a buy signal may occur when the Laguerre Volume Indicator crosses above a certain threshold, indicating increasing buying pressure, while a sell signal might be triggered when it dips below a threshold, suggesting bearish momentum. Additionally, incorporating other technical indicators such as the Relative Strength Index (RSI) or Moving Averages can help confirm trends and improve entry and exit points. It is essential to backtest these setups and use proper risk management to ensure an effective trading approach.

Volume Indicators for MT5

by Specialist 🫡 -

Normalized Volume Indicator

Normalized Volume Indicator for MT5

The Normalized Volume Indicator provides insights into trading activity relative to historical averages, helping traders identify potential trends and reversals. To effectively use this indicator, monitor for spikes in normalized volume, which can signal increased interest in an asset, potentially preceding price movements. Combine the indicator with other tools, such as moving averages or momentum indicators, to confirm signals and avoid false breakouts. Additionally, watch for divergences where price moves contrary to volume trends, as these can hint at upcoming reversals. Always manage risk with appropriate stop-loss orders to protect against unexpected market changes.