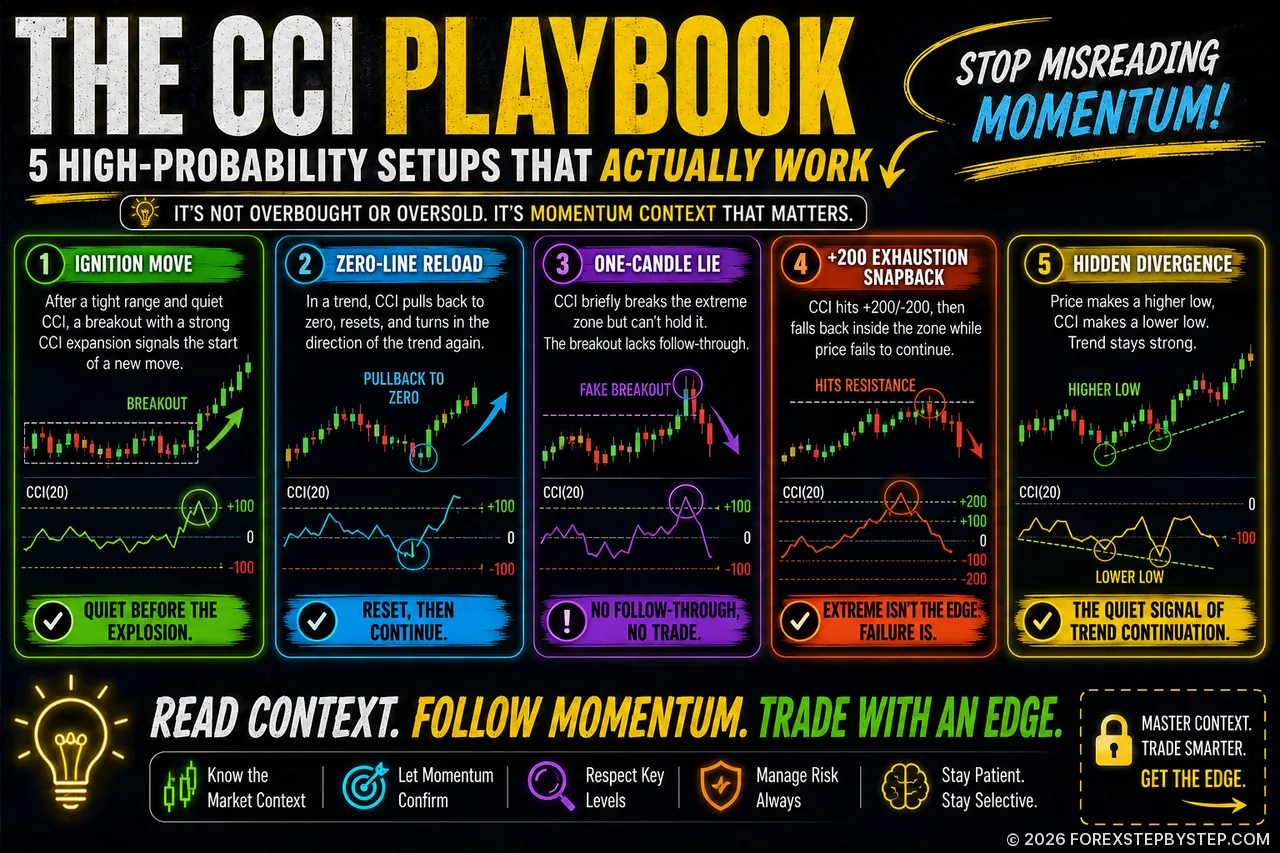
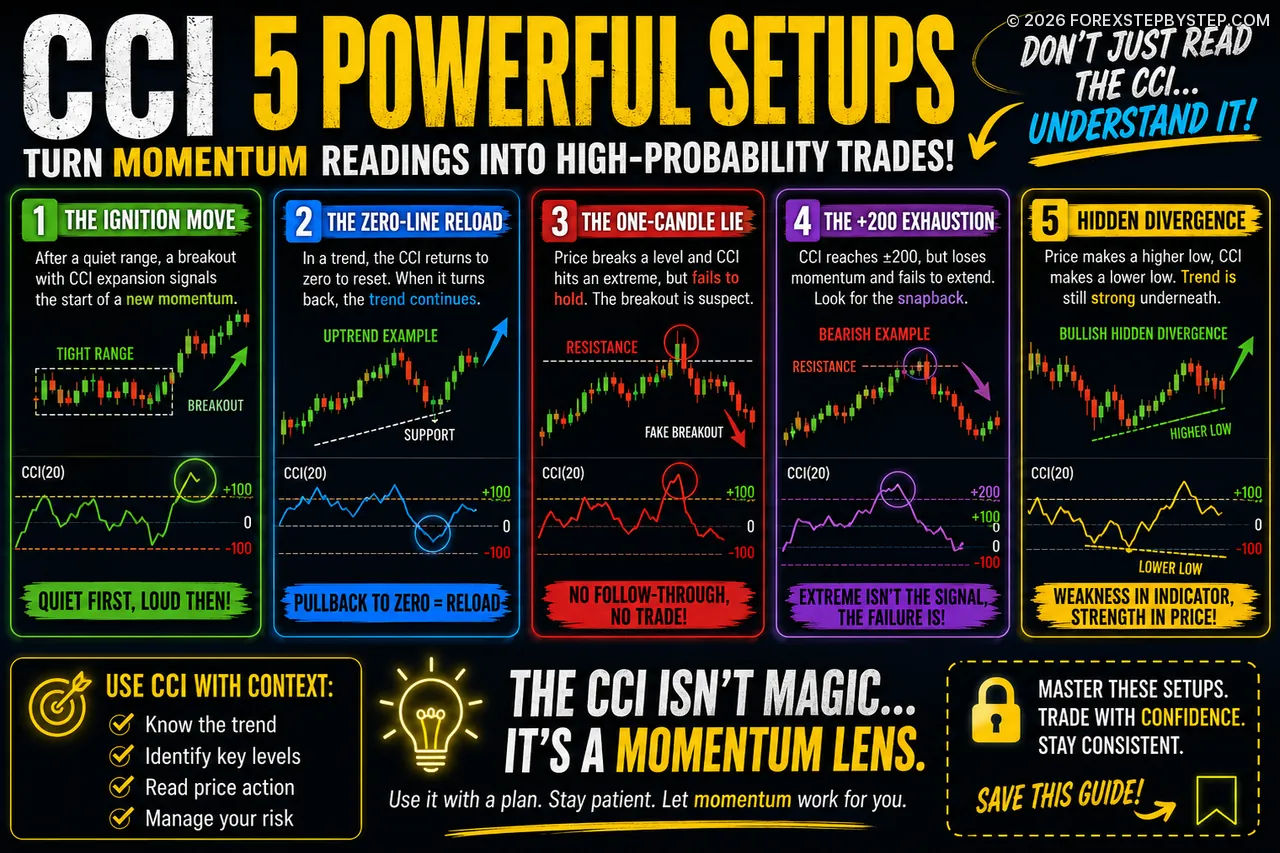
Momentum or trap? This visual breakdown shows how CCI extremes, zero-line reloads, failed breakouts, and hidden divergence can mean very different things.
⚠️ The CCI Trap Most Traders Notice Too Late
Many traders read the CCI in a very simple way: above +100 looks overbought, below -100 looks oversold. That shortcut is easy to understand, but it can be dangerous on a live forex chart.
A strong CCI reading does not always mean price is ready to reverse. Sometimes it shows that momentum is only starting to build. What looks “too high” can become the beginning of a breakout. What looks “too low” can mean sellers are still firmly in control.
This guide takes a closer look at the CCI beyond basic buy-and-sell signals. It covers momentum ignition, zero-line reloads, hidden divergence, failed breakouts, liquidity sweeps, and +200 exhaustion zones.
The real value of the CCI is not just where the line is now. It is what momentum may be warning you before the chart makes it obvious.
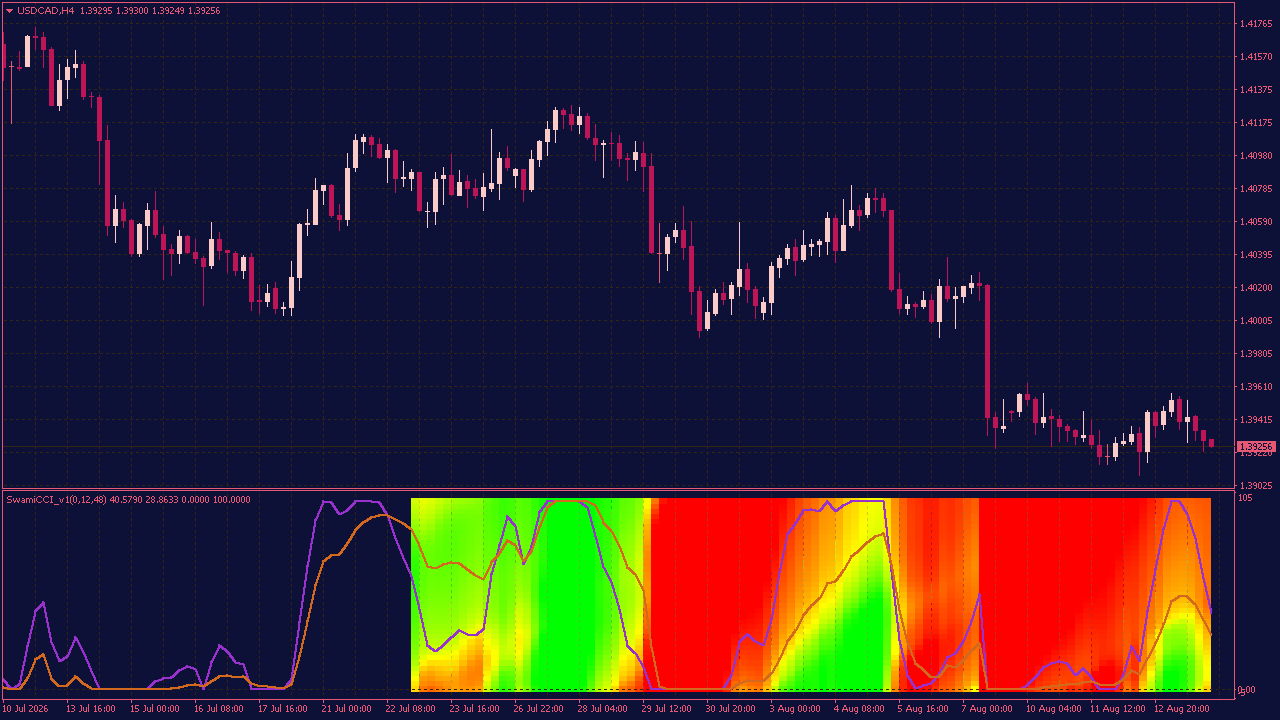
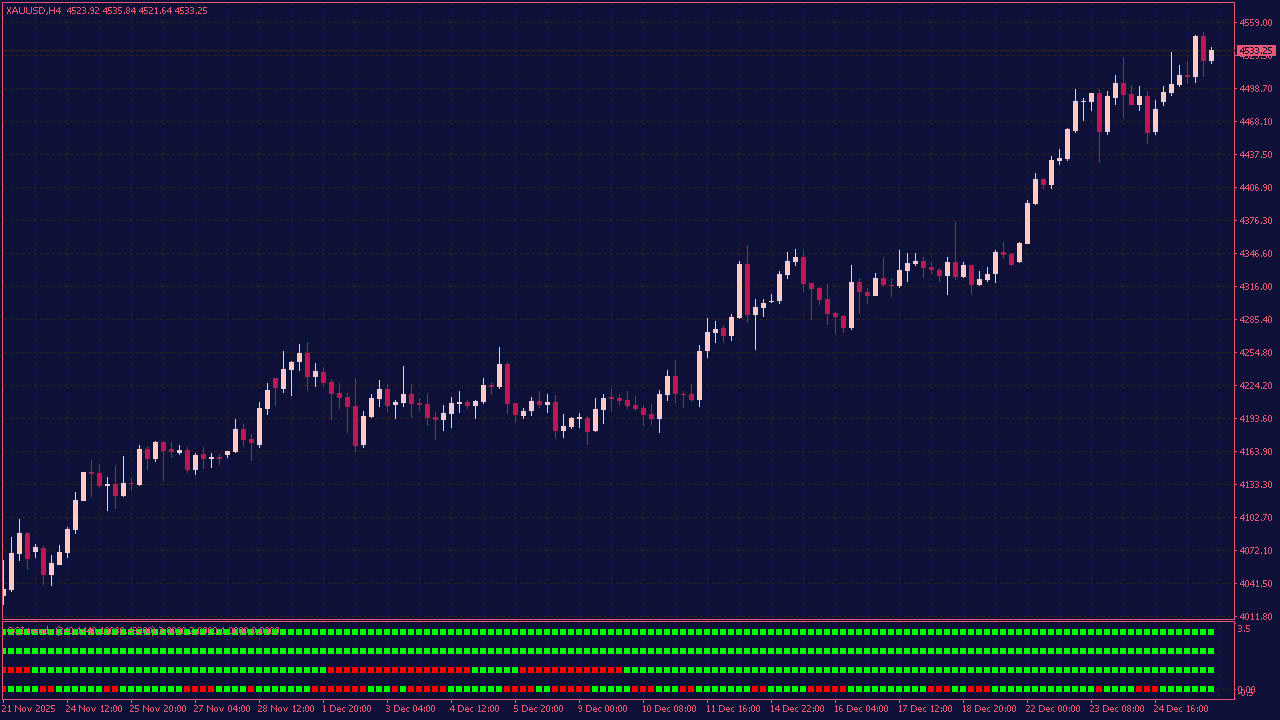
The Swami CCI Indicator takes a different approach to momentum. Instead of showing just one CCI line, it looks at several CCI periods at once and turns them into a visual map. This gives you a much better feel for what is actually happening behind the current price movement. What I find most useful is watching the colors change before everything lines up in the same direction. Sometimes the faster periods react first, while the slower ones are still holding their ground. That little disagreement can tell you more than a simple crossover ever could. It is not about finding a magic buy or sell signal. The interesting part is seeing momentum develop step by step — especially during those quiet moments when the chart itself does not seem to be saying much yet.
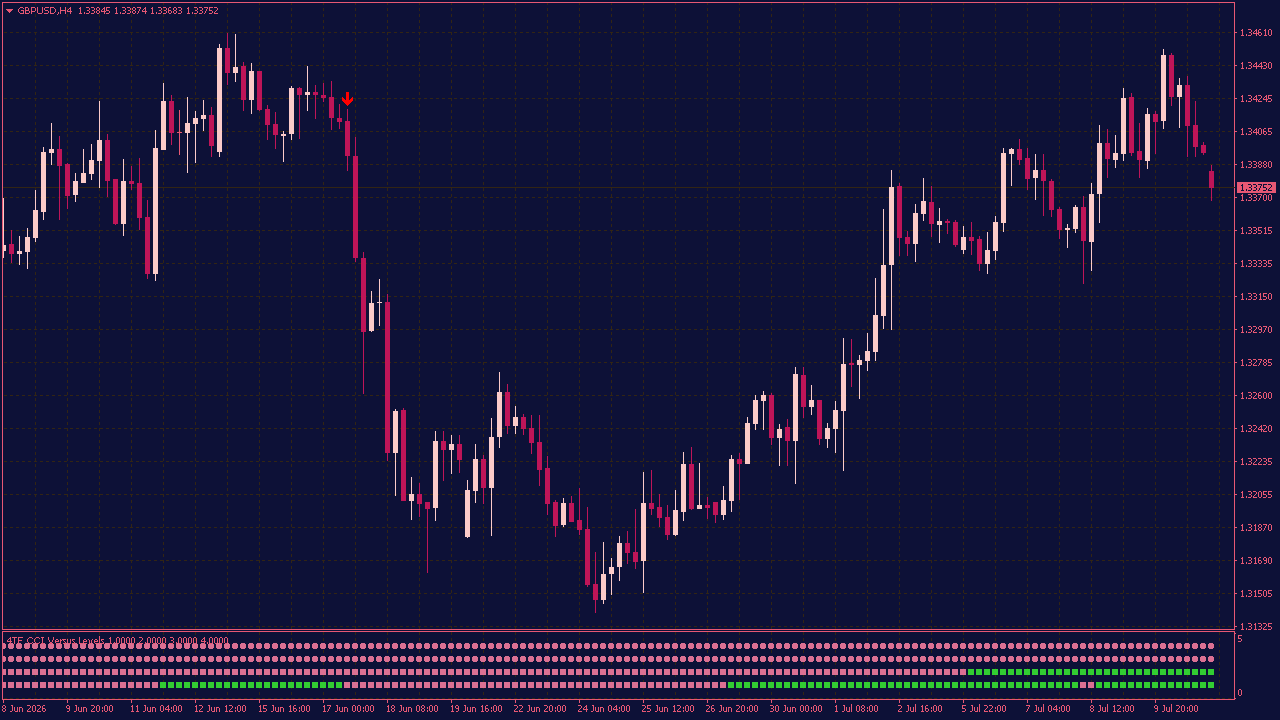
4TF CCI Versus Levels Indicator with Alerts & Arrows
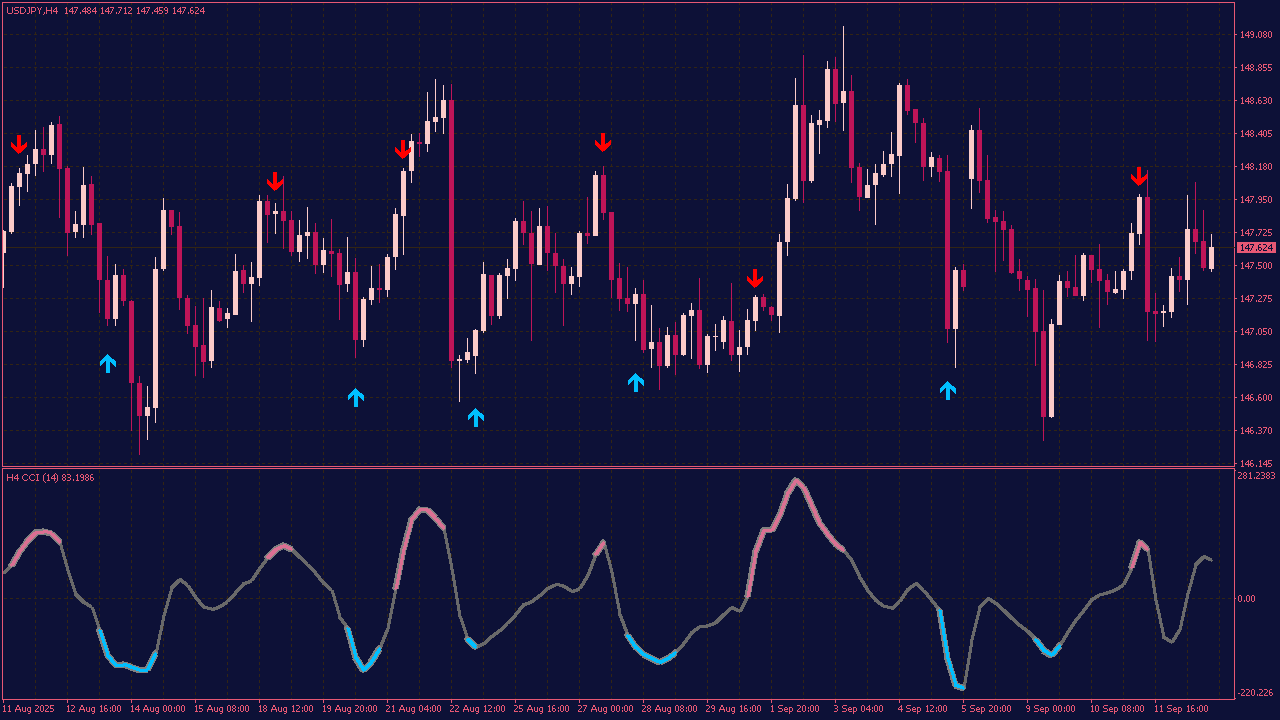
The 4TF CCI Versus Levels Indicator was designed for traders who do not want to rely on a single timeframe. It displays CCI conditions from four timeframes together, making it easier to understand whether momentum is mixed or moving in one direction. Sometimes the lower timeframe reacts first. Sometimes the larger timeframe quietly confirms the move later. By watching them together, you may notice changes that are easy to miss when each chart is analysed separately. You can adjust the CCI period, levels, timeframes, arrows, and alerts to match your own approach. The interesting part begins when several independent readings suddenly start telling the same story.
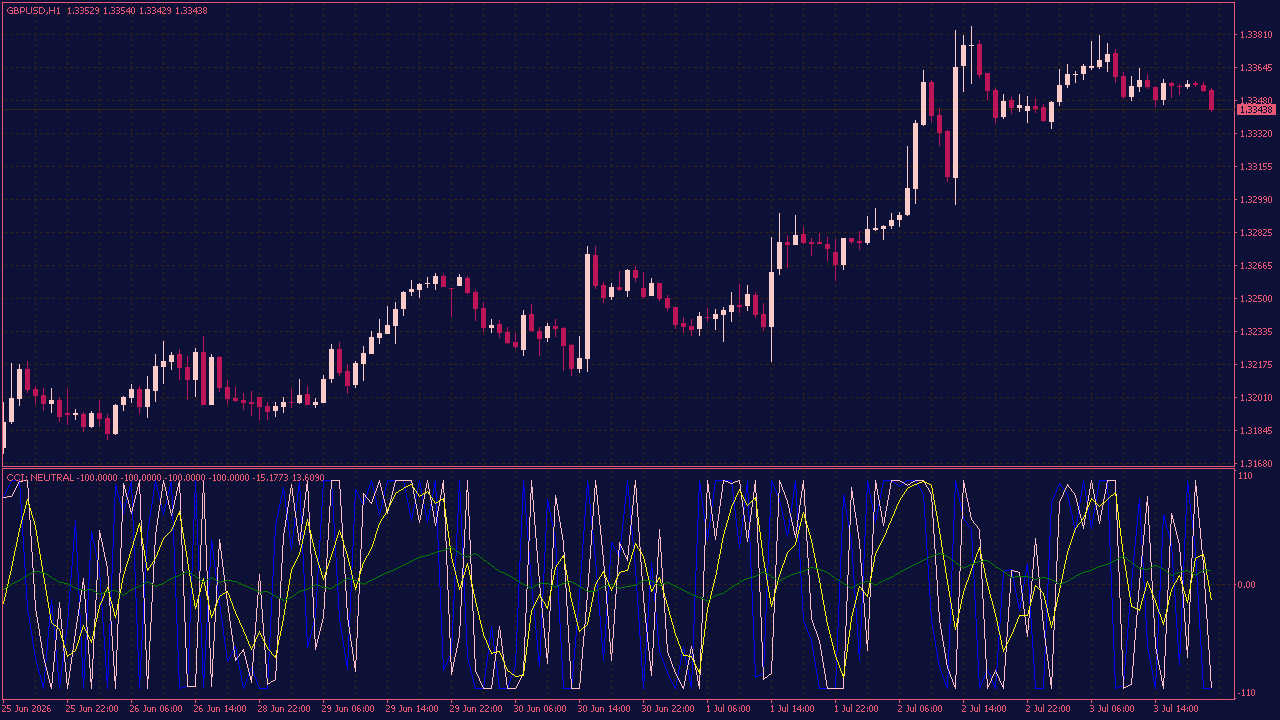
The CCI Trigger is a trading indicator built around the Commodity Channel Index. It is designed to give traders a clearer view of market momentum by combining CCI-based calculations with smoothed trigger and main lines. Instead of relying on raw CCI values alone, the indicator helps simplify market reading by showing whether conditions are leaning toward BUY, SELL, or NEUTRAL. This can make it easier to spot possible momentum changes and filter trading ideas before making a decision.
The settings can be adjusted to suit different trading styles. Users can change the CCI period, trigger smoothing period, main smoothing period, and moving average methods depending on how sensitive or smooth they want the indicator to be. The CCI Trigger is best used as an additional confirmation tool, not as a standalone trading system. It can support technical analysis by helping traders better understand momentum shifts, trend direction, and possible entry or exit areas when used together with a complete trading strategy.
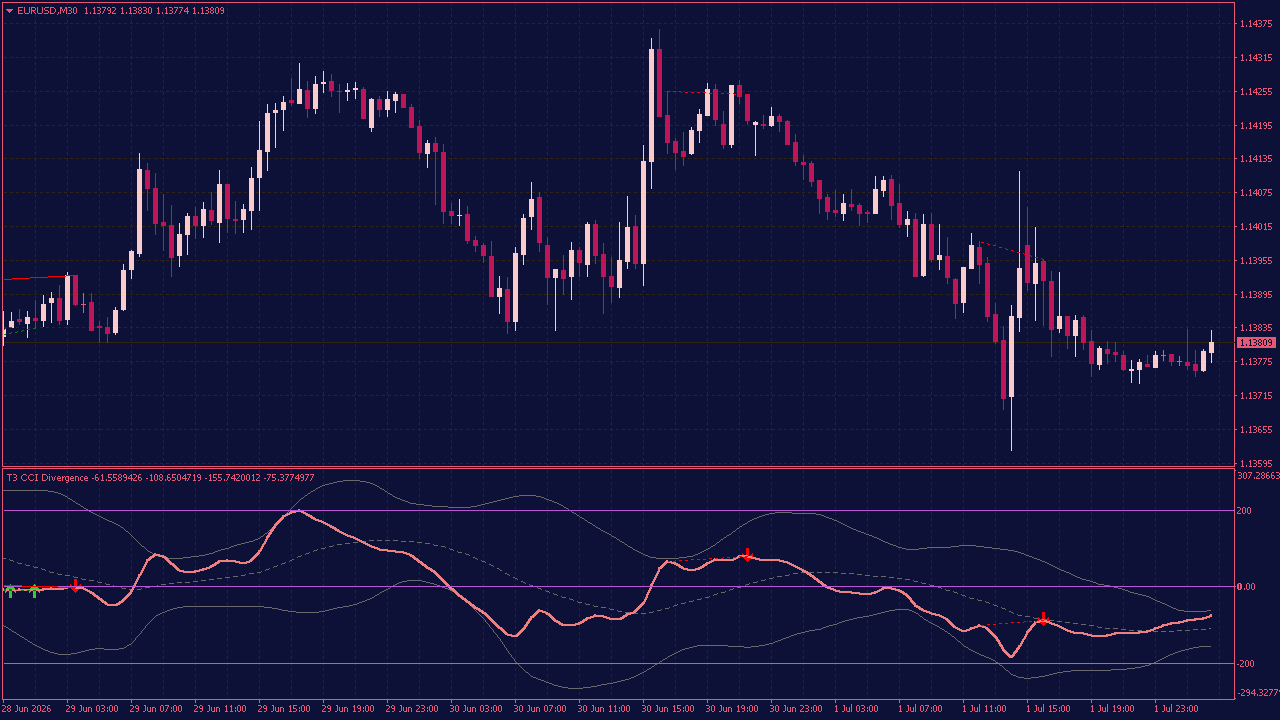
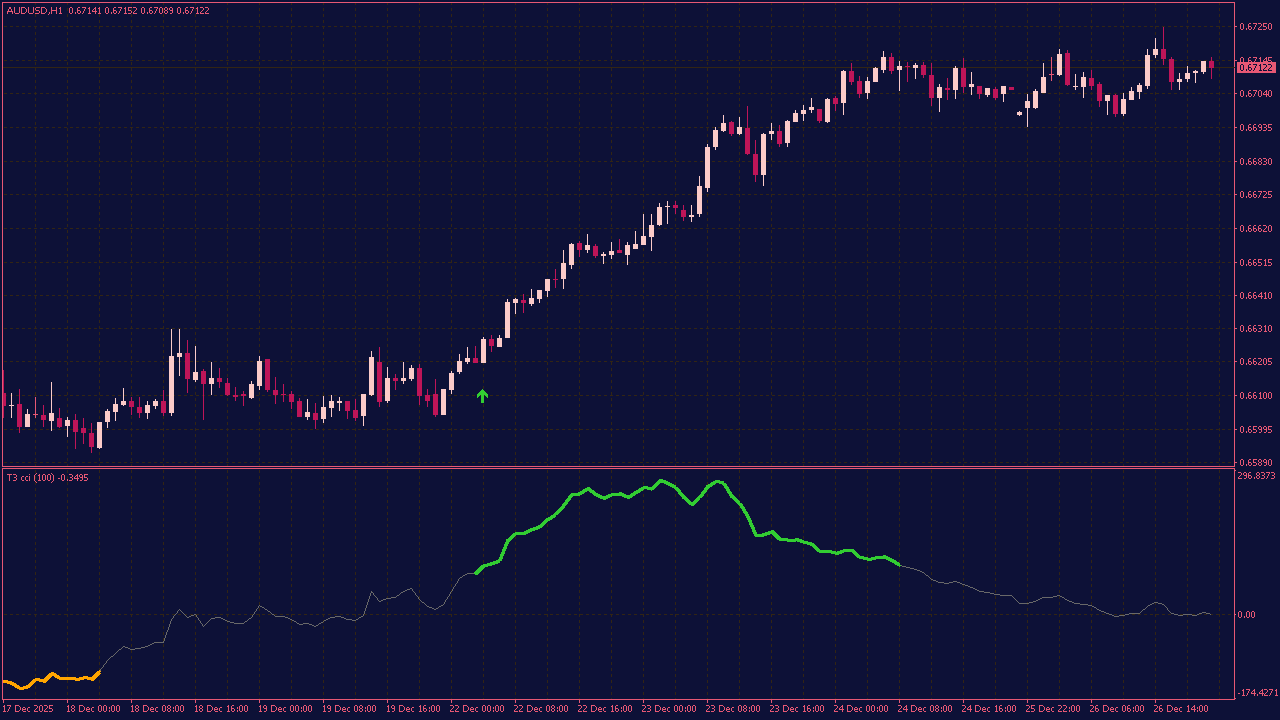
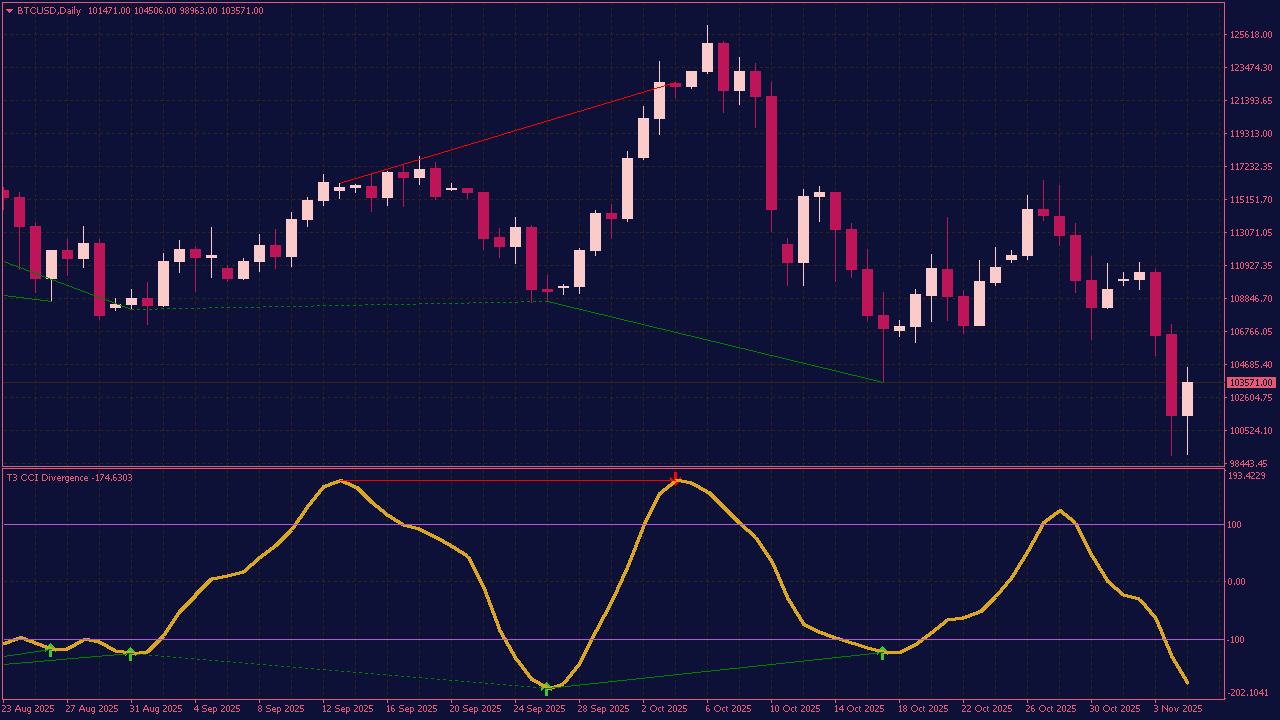
The T3 CCI Divergence MTF Indicator with Bands helps traders analyze momentum more clearly and identify possible reversal areas on the chart. It is based on a T3-smoothed CCI, which reduces noise and makes momentum changes easier to read. The indicator includes volatility bands, overbought and oversold zones, and multi-timeframe functionality for better market context. It can also detect bullish and bearish divergences between price and momentum, then display arrows, lines, and optional alerts when a signal appears. This makes it useful for traders who want to spot trend exhaustion, hidden strength or weakness, and potential turning points. It works best as a confirmation tool together with price action, support and resistance, or an existing trading strategy.
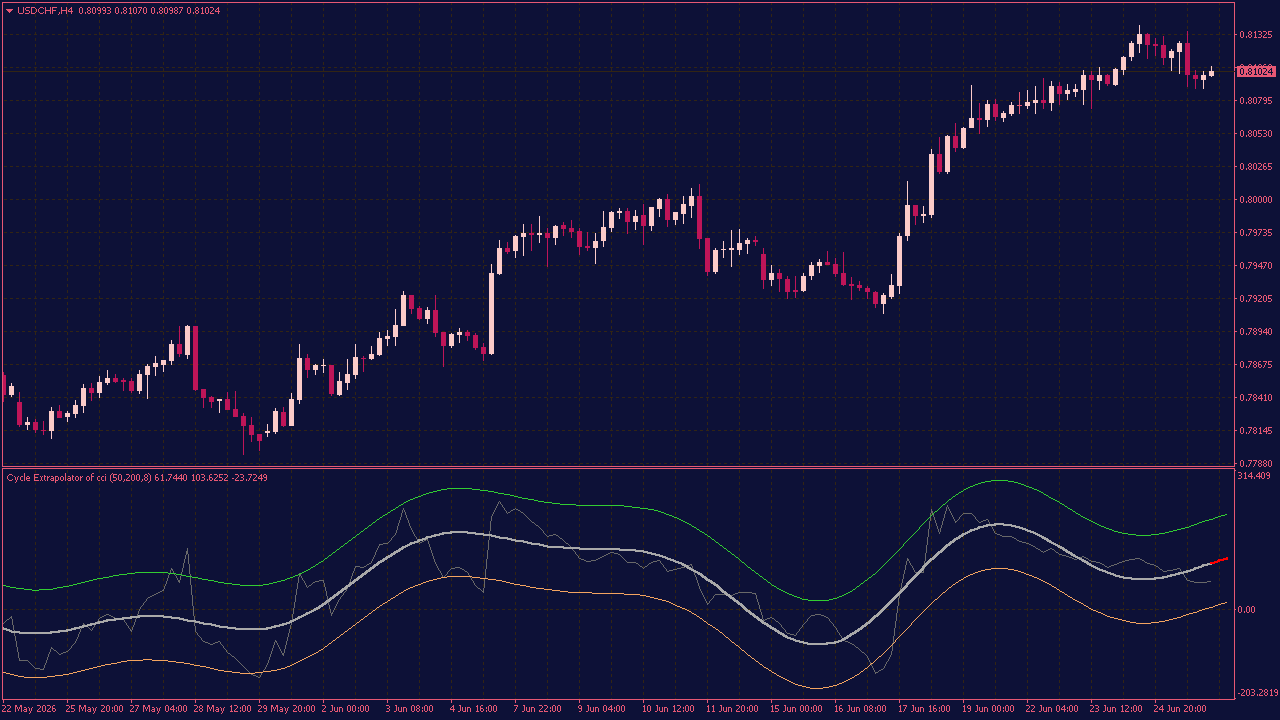
The Cycle Extrapolator (CPO) is an advanced indicator based on the Commodity Channel Index (CCI) that analyzes the dominant market cycle and projects the future path of the CCI. By estimating the current cycle's period, phase, and momentum, it provides a forward-looking view of potential trend changes and market turning points. The CPO is designed to help traders identify emerging opportunities earlier than the standard CCI and is most effective in markets with stable cyclical behavior. Like all predictive indicators, its forecasts become less reliable during strong trends or highly volatile market conditions.
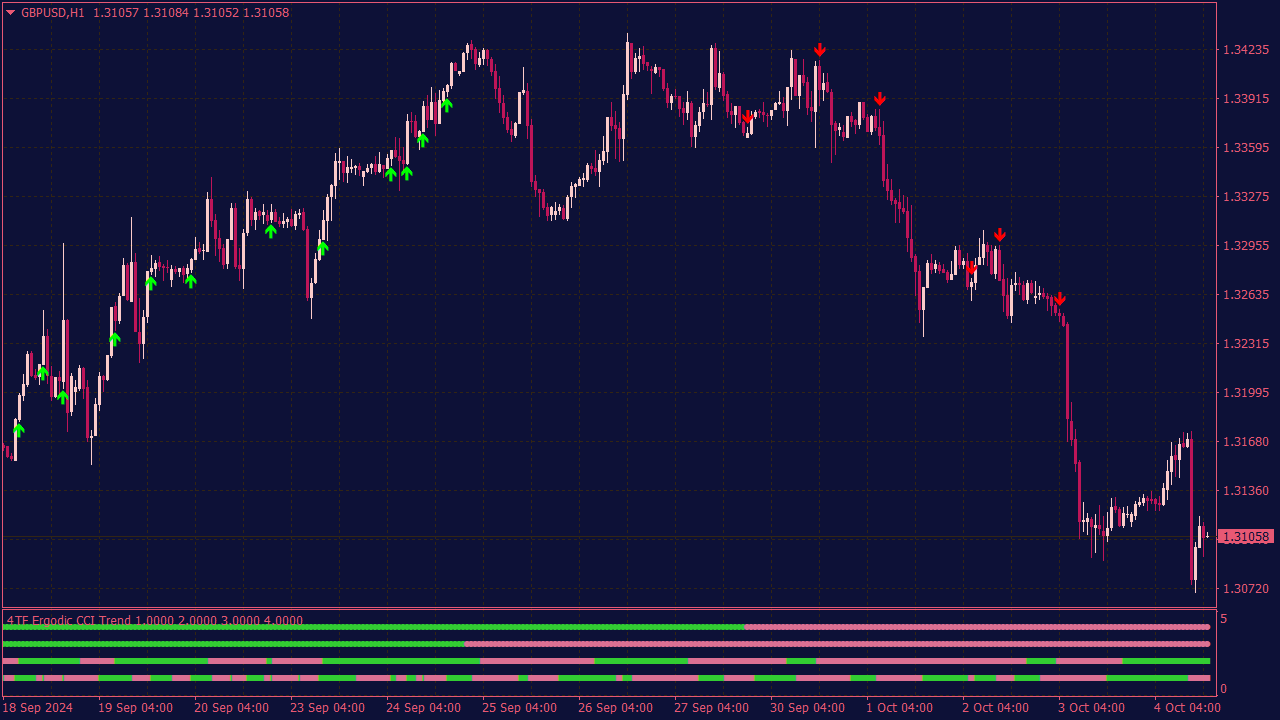
The 4 TF Ergodic CCI trading strategy involves analyzing the Ergodic CCI across four different time frames to generate trading signals, enhanced with arrows and alerts for visual guidance. This approach typically entails identifying overbought or oversold conditions on each time frame, allowing traders to make informed decisions based on the convergence of signals. The arrows serve as easy-to-interpret indicators for entry and exit points, while alerts notify traders when specific conditions are met, creating a systematic framework for more precise trading decisions in various market conditions.
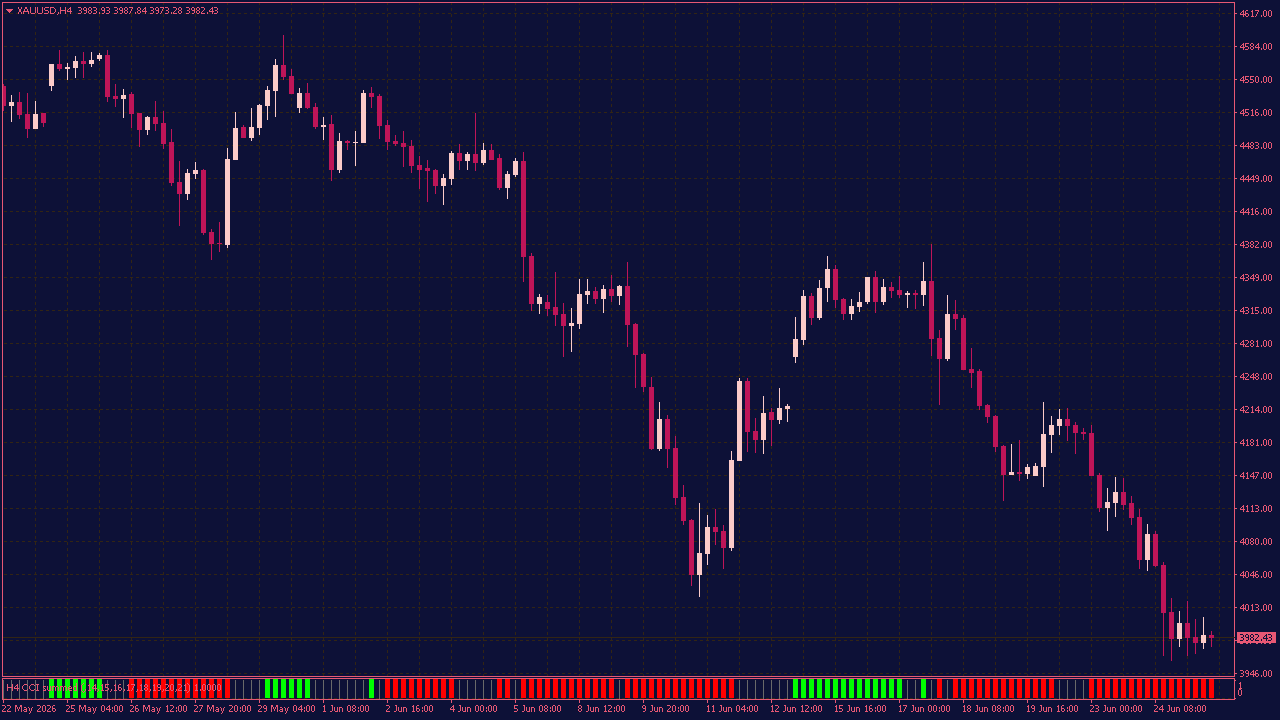
The CCI Summed MTF Indicator with Alerts combines multiple time frame (MTF) CCIs by summing their values to provide a comprehensive view of market momentum across different periods. It offers alert functionalities to notify traders of significant crossovers or trend changes, helping to identify stronger confirmation signals. This indicator enhances multi-timeframe analysis, making it easier to spot potential trading opportunities by aggregating insights from various time frames into a single, alert-enabled display.
The CCI Variation Extended Indicator with Alerts enhances the traditional commodity channel index (CCI) by offering customizable options such as switching between mean absolute deviation, standard deviation, and ATR for calculation, as well as smoothing and color-changing features based on zero crosses and slope direction. While it maintains the zero line crossings consistent with the standard CCI, the levels and slopes differ, providing traders with visual signals through color changes for more dynamic decision-making.
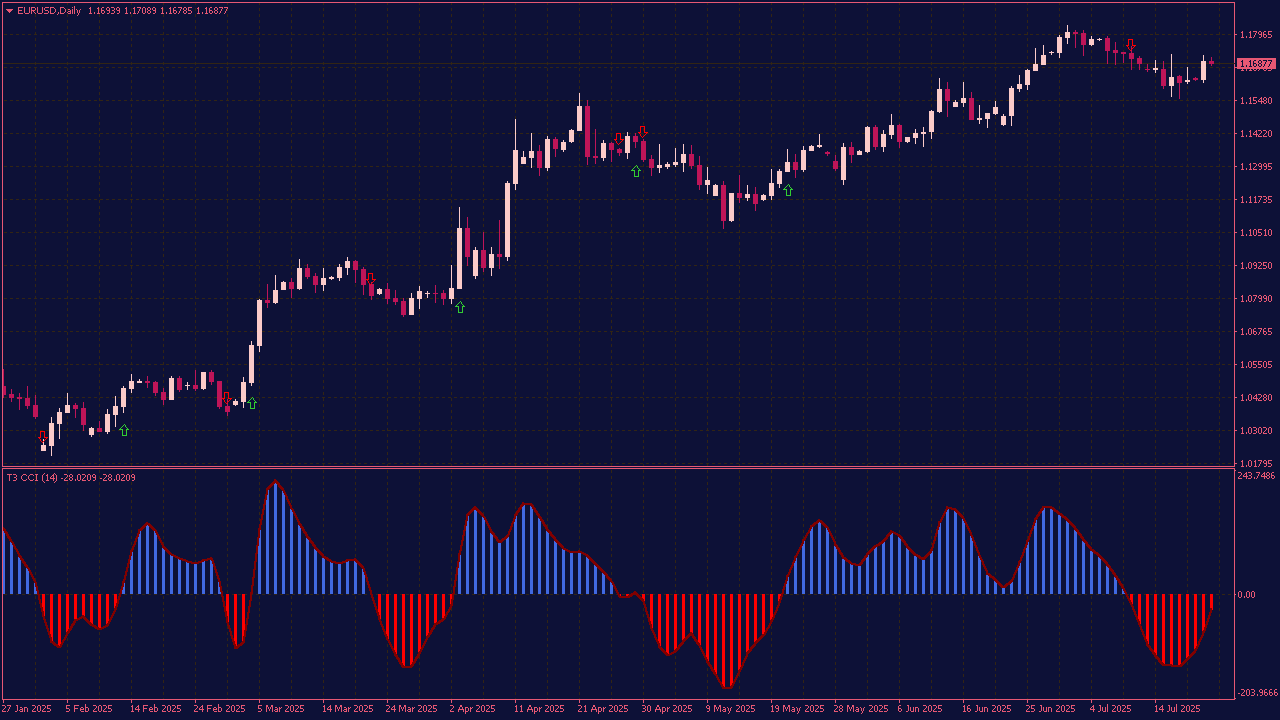
The T3 CCI Histogram with Alerts and Arrows is a technical indicator that combines the Commodity Channel Index with a T3 smoothing algorithm to reduce noise and enhance trend clarity. It displays a histogram showing bullish and bearish momentum and plots arrows on the chart to signal potential buy or sell opportunities. The indicator includes sound alerts to notify traders of crossing signals or trend shifts.
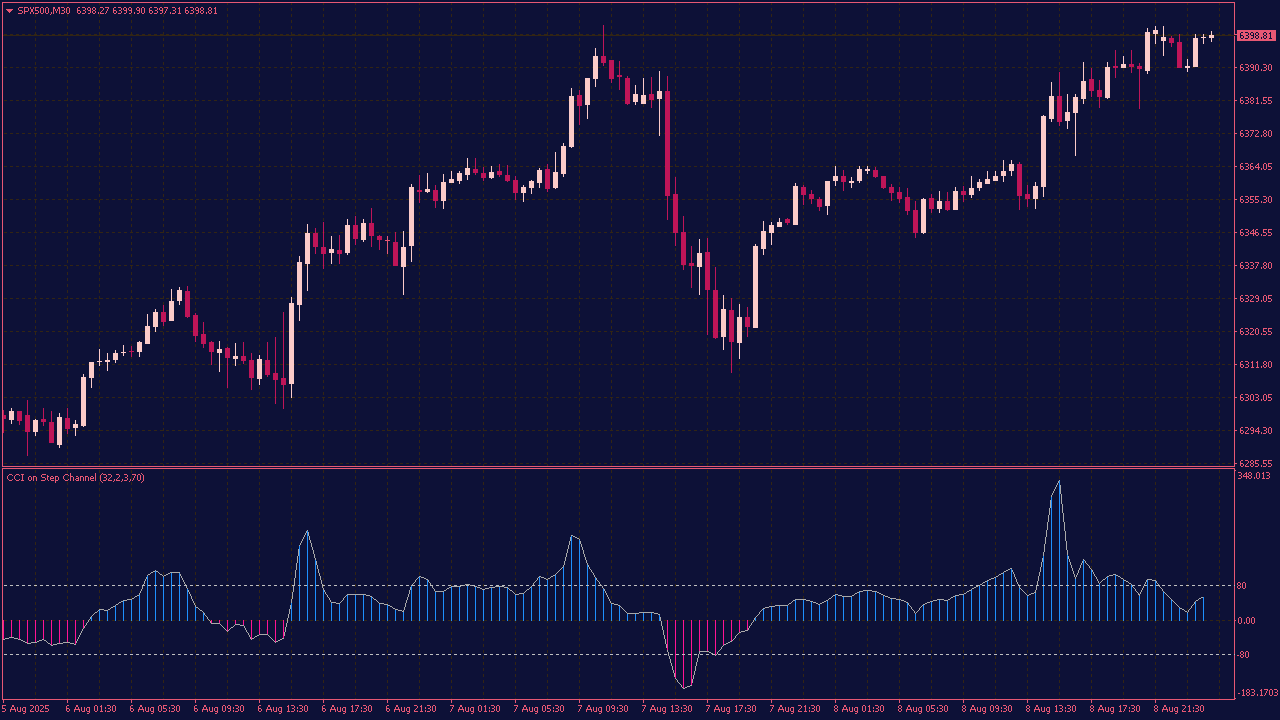
The traditional Commodity Channel Index (CCI) utilizes a Moving Average of the Typical Price, whereas this modified version employs the median line of the Step Channel indicator, which reflects the balance between rising and falling prices. The chart highlights the differences between these approaches, with the blue line representing the Typical SMA(14) and the pink line illustrating the Volatility Step Channel, calculated using a standard deviation of 1.0, a 3-period moving average, and a volatility setting of 70, showcasing how the median-based line can offer a different perspective on price momentum compared to the classic CCI.
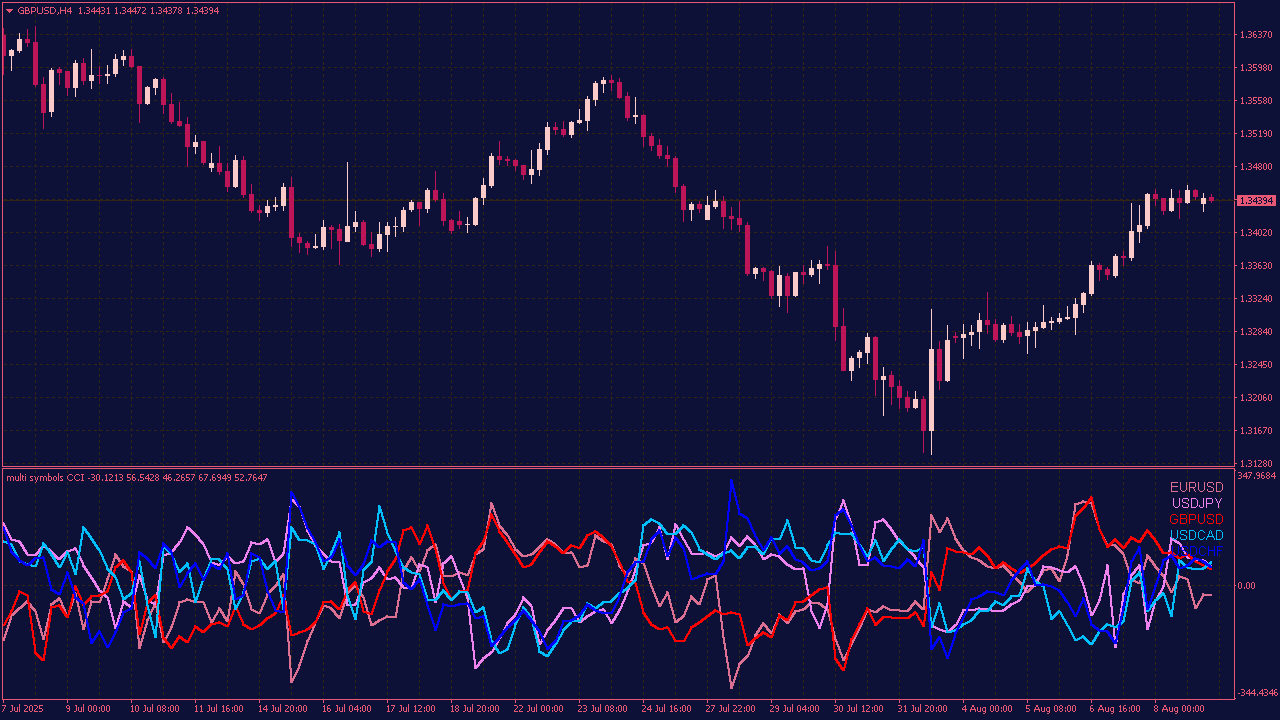
The Multi Symbols CCI Indicator is a technical analysis tool that allows traders to analyze multiple assets simultaneously by displaying their CCI values on a single chart, enabling comparative analysis and efficient identification of overbought or oversold conditions across different markets. This multi-asset approach helps traders diversify their strategies, spot potential trading opportunities, and manage risk more effectively by observing relative momentum and divergence patterns across various symbols.
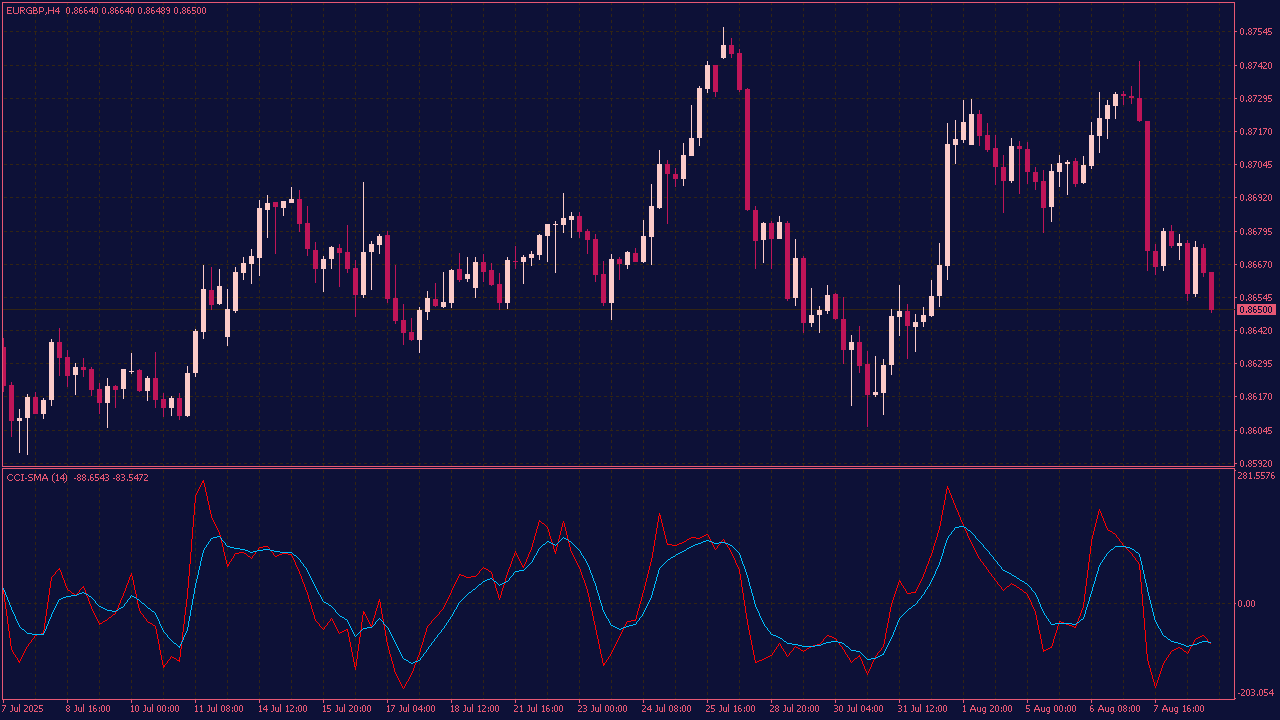
The CCI MA Smoothed with Alerts and Arrows is a technical indicator that combines the Commodity Channel Index with a moving average smoothing technique to reduce noise and enhance trend detection. It provides visual cues such as arrows to indicate potential buy or sell signals based on CCI crossovers or divergence, and includes alert features to notify traders when specific conditions are met, making it a useful tool for timely decision-making. This setup helps traders identify overbought or oversold levels, trend reversals, and momentum shifts more clearly, improving trading accuracy and confidence.
The I-Gentor CCI Indicator is a technical analysis tool used by traders to identify potential trend reversals and market momentum. The Commodity Channel Index measures the deviation of the price from its average over a specified period, highlighting overbought or oversold conditions. When combined with a histogram, the visualization provides a clear, intuitive view of momentum shifts (bars above the zero line indicate bullish momentum, while bars below suggest bearish momentum). This setup helps traders make more informed decisions by analyzing the strength and direction of price movements, and it is often used in conjunction with other indicators to confirm trading signals.
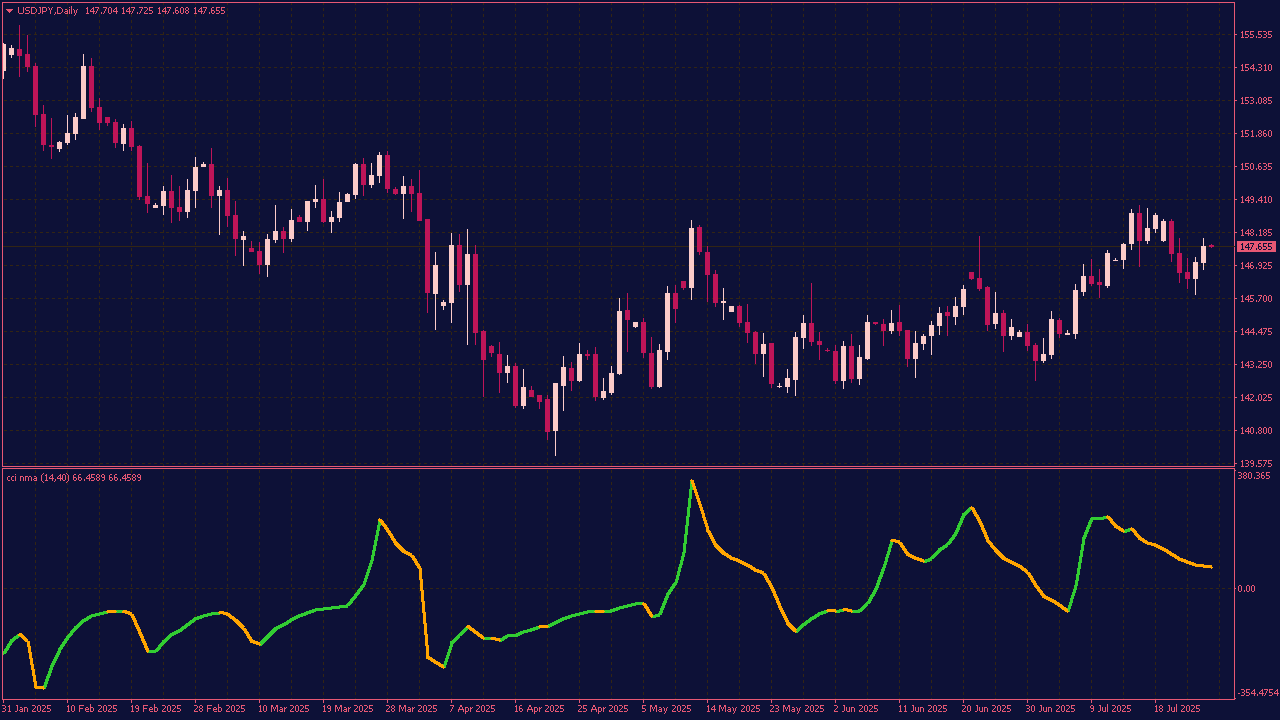
The CCI NMA Crossing Level Indicator combines the Commodity Channel Index with a Natural Moving Average to identify potential overbought or oversold conditions and trend reversals in financial markets. This indicator smooths out price fluctuations, making it easier to spot genuine trend changes, while the CCI component helps gauge market momentum and identify divergence signals.
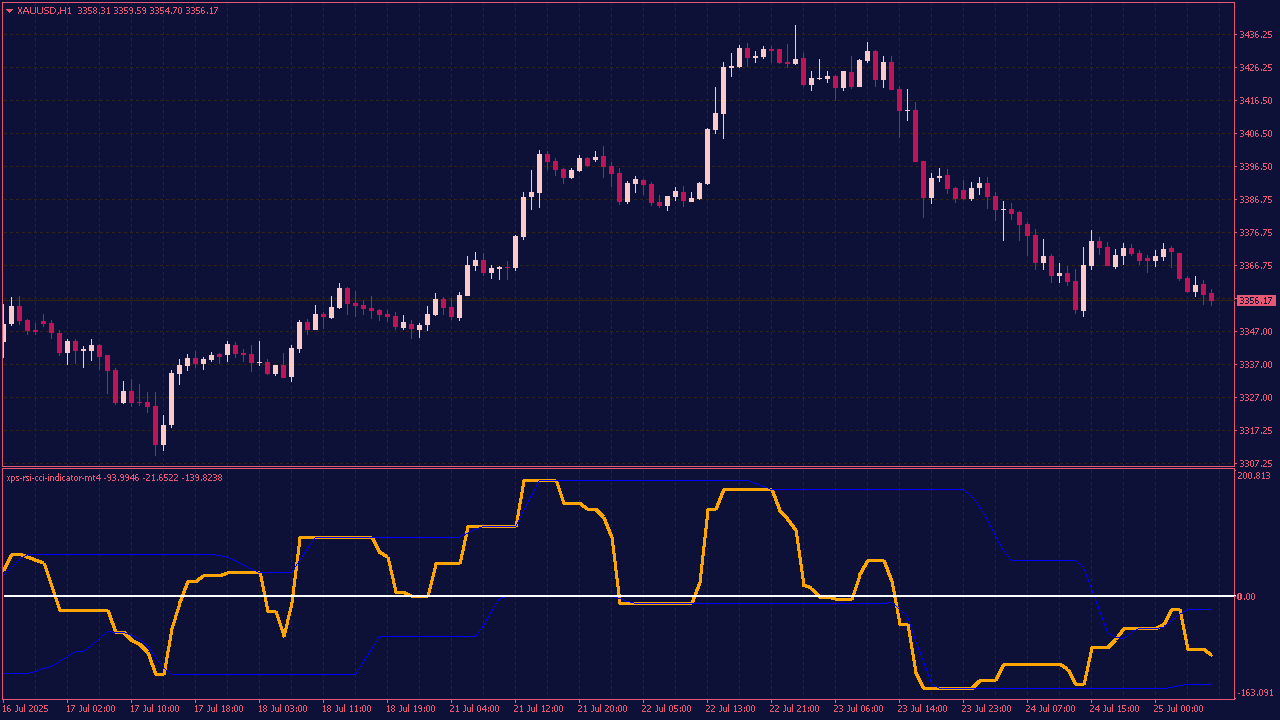
The XPS RSI CCI Indicator is a custom indicator that blends RSI and CCI into a single momentum tool, enhanced with dynamic (floating) overbought and oversold levels. Unlike fixed thresholds, floating levels adjust based on recent market conditions, helping traders better adapt to changing volatility. This indicator provides more responsive and adaptive trade signals, reducing noise and improving accuracy in trend reversals and entries.
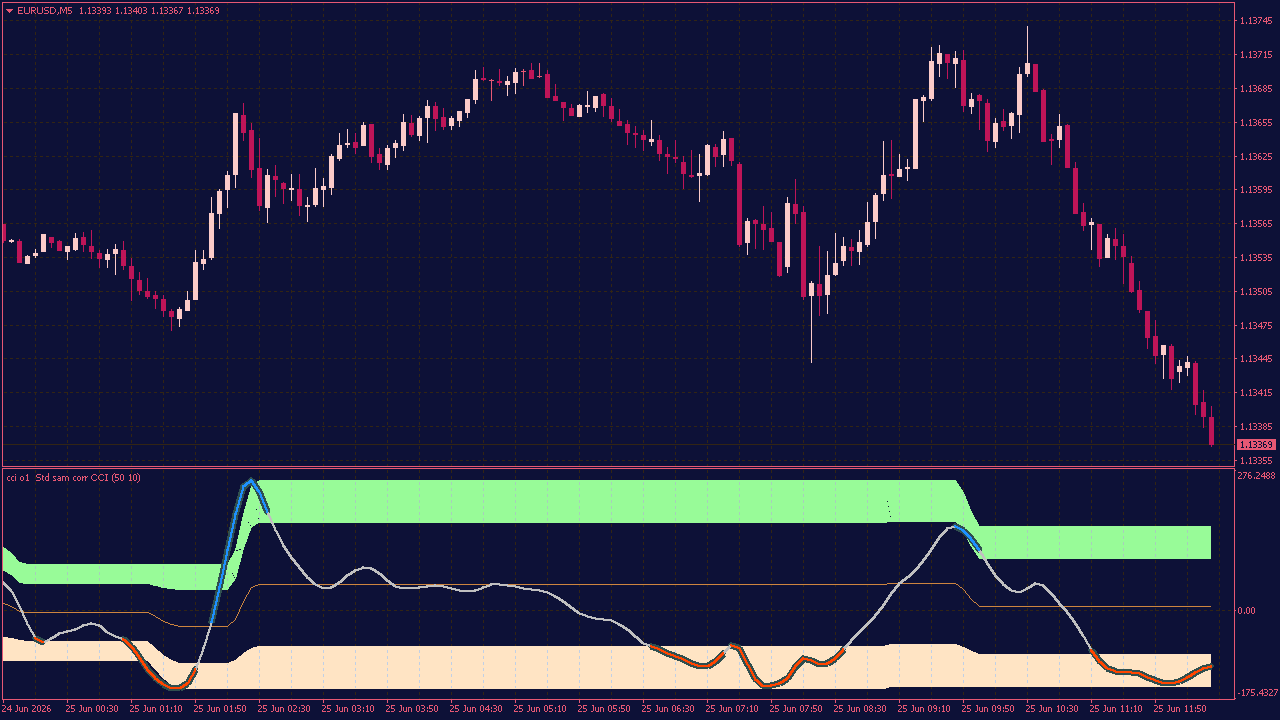
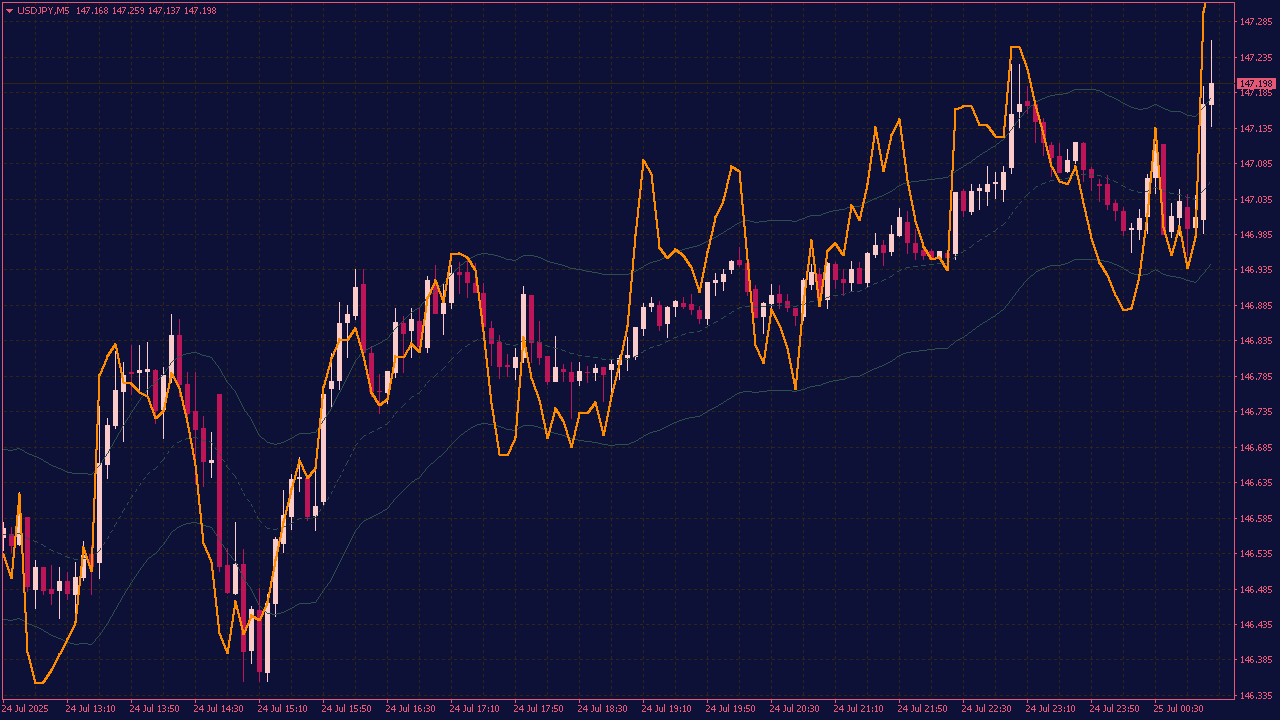
The On Chart CCI with Bands indicator overlays the Commodity Channel Index directly on the price chart along with dynamic upper and lower bands. These bands help visualize CCI’s overbought and oversold levels, making it easier to interpret momentum and price deviations within the main chart area.
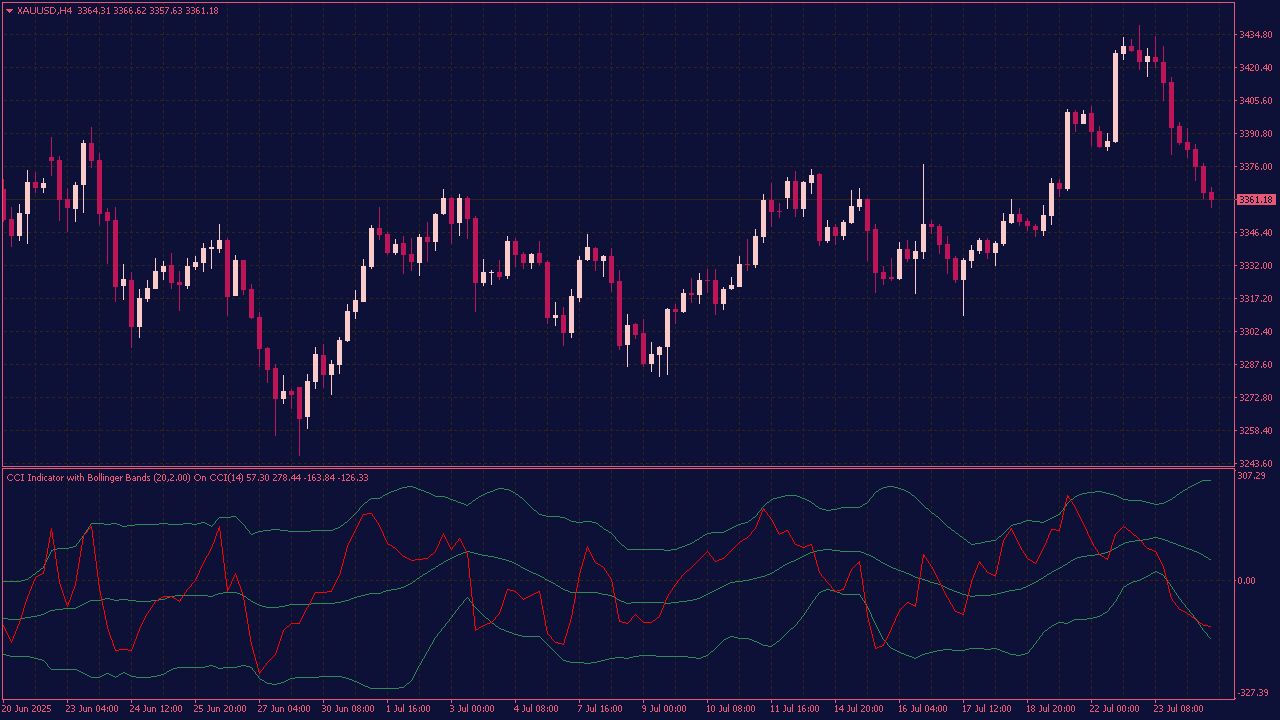
The CCI Indicator with Bollinger Bands combines the Commodity Channel Index’s momentum signals with Bollinger Bands’ volatility bands to identify overbought/oversold conditions and potential price reversals. This helps traders spot stronger entry and exit points by confirming momentum with price volatility.
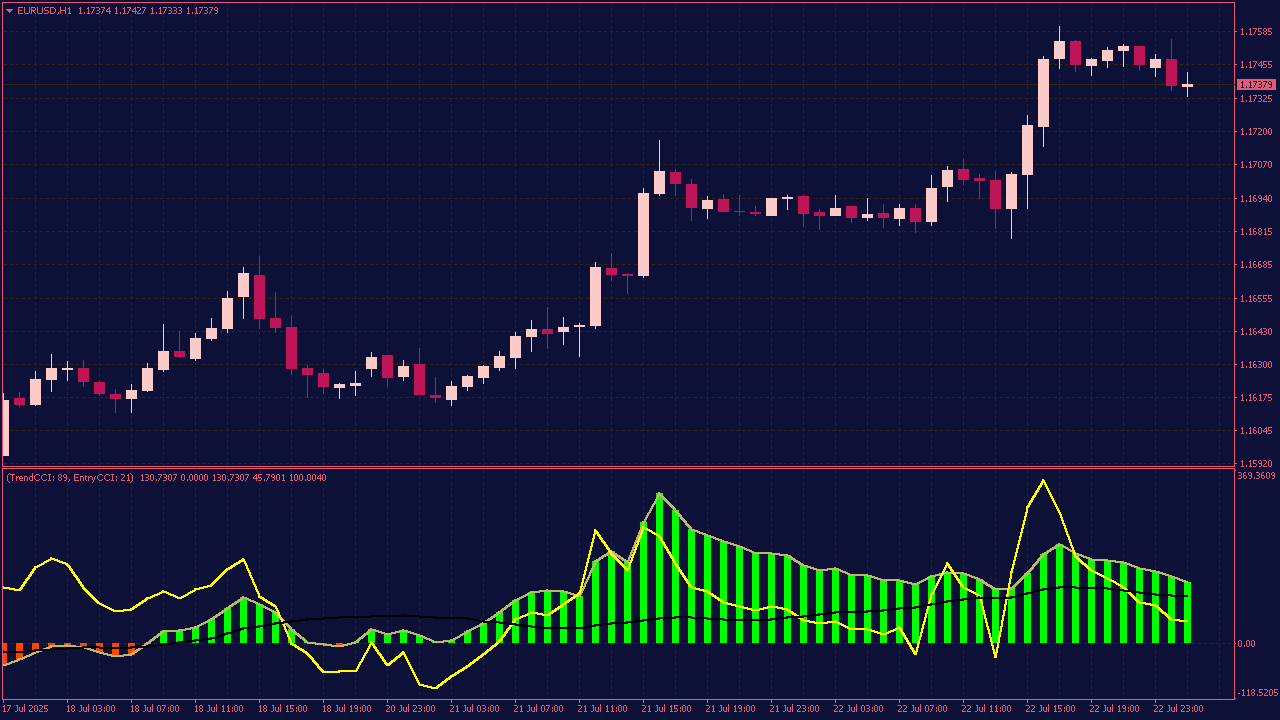
The Trend CCI Indicator is a technical tool that combines the Commodity Channel Index with trend analysis to identify the prevailing market direction and potential reversal points. It typically modifies the standard CCI to emphasize trend strength and momentum, often by applying smoothing and additional signal lines, making it easier for traders to distinguish between trending and ranging markets. This indicator helps traders spot overbought or oversold conditions aligned with the overall trend, providing clearer entry and exit signals, and improving the accuracy of trend-following strategies.
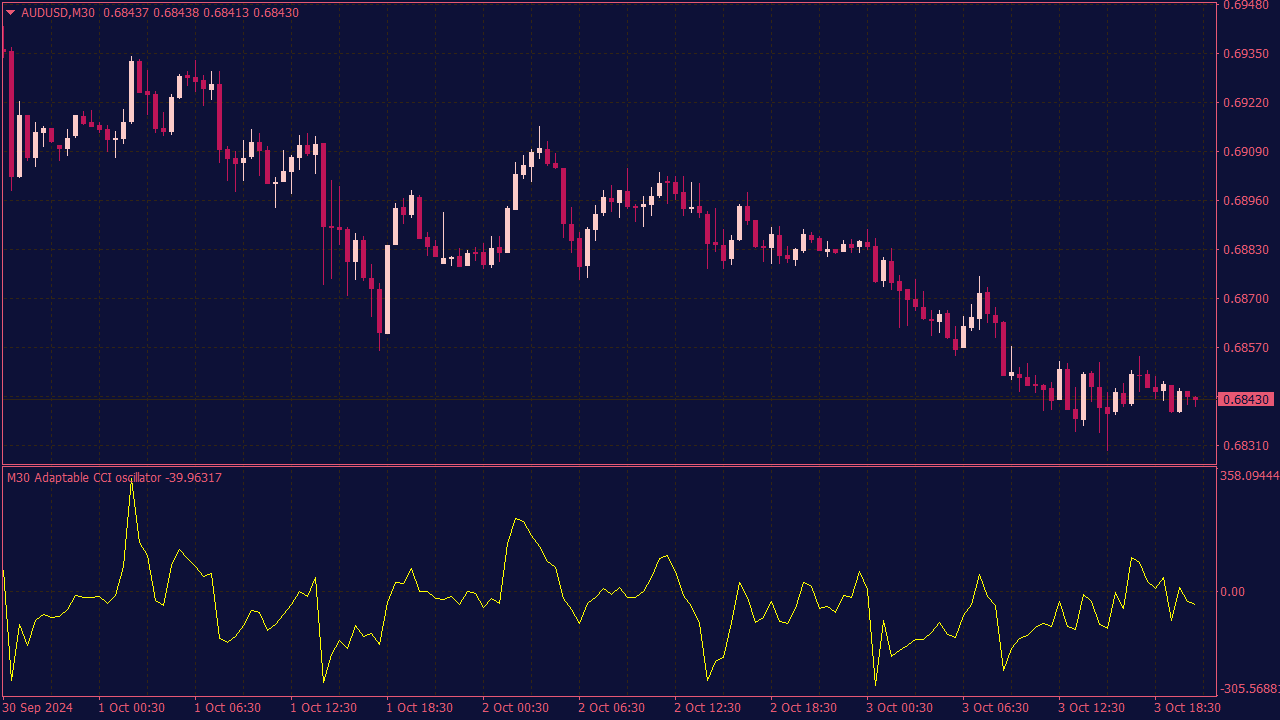
The Adaptable CCI MTF Indicator is a tool that helps traders identify potential entry and exit points in various market conditions by using the Commodity Channel Index across different time frames. To trade using this indicator, look for signals such as overbought or oversold conditions - typically indicated by CCI values above +300 (overbought) or below -300 (oversold). Confirm these signals by analyzing at least two higher time frames to ensure alignment and strong market momentum. Enter a trade when the CCI crosses these threshold levels and consider setting stop-loss orders just outside the recent high or low to manage risk. Always combine the signals with other technical analysis tools to increase the reliability of your trades.
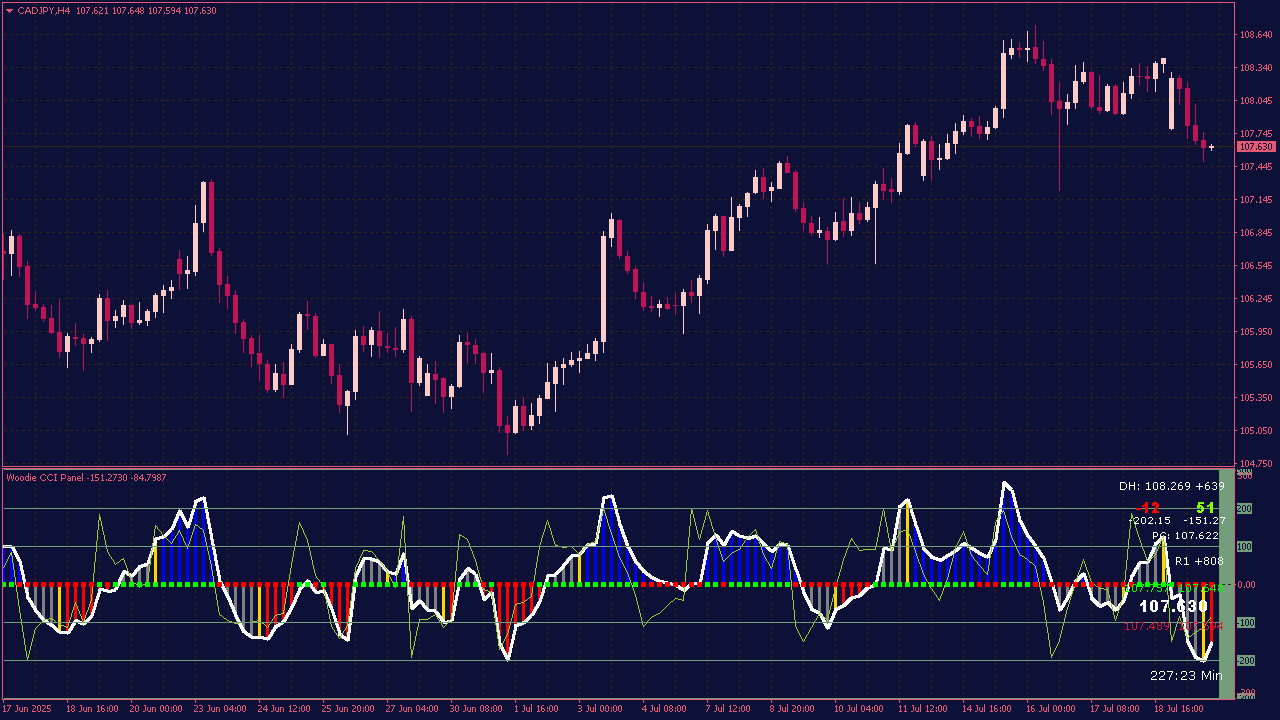
The Woodie CCI Panel Indicator is a dual-CCI momentum and trend-following tool that uses a Fast CCI (14) for trade signals and a Slow CCI (100) to define trend direction. Displayed as a color-coded histogram panel, it helps traders visually identify patterns like Zero Line Rejects (ZLR) and Trend Continuations (TC) for intraday and short-term trading decisions.
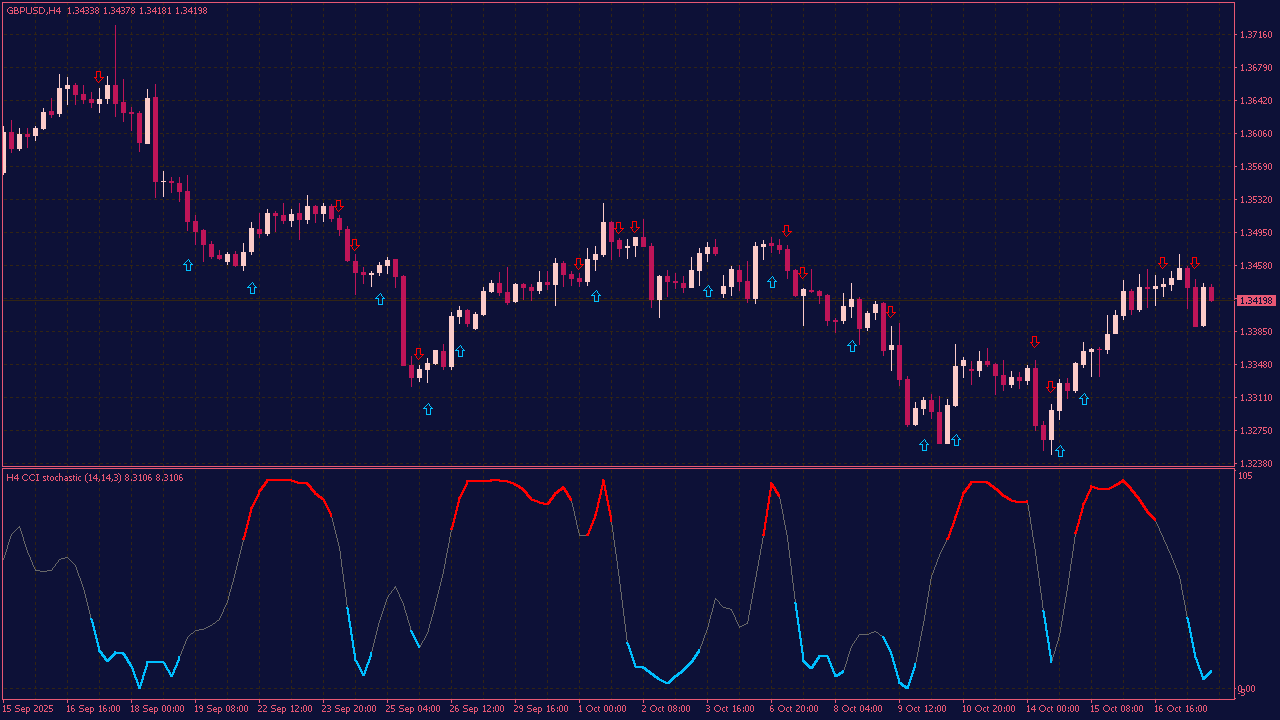
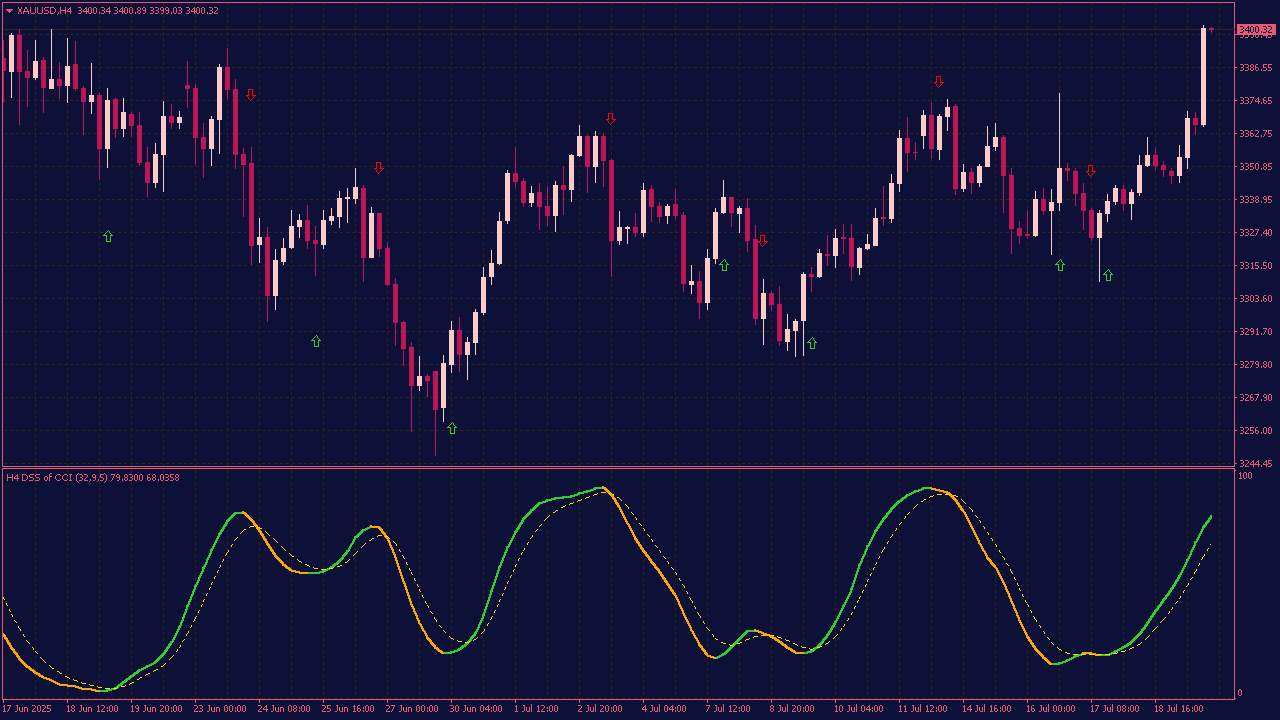
The DSS of CCI MTF Indicator with Arrows is a trend-following and reversal tool that applies the Double Smoothed Stochastic to the Commodity Channel Index, with support for multi-time frame analysis. It displays buy/sell arrows on the chart when crossover signals occur, helping traders spot entry or exit points. The MTF feature filters signals using higher timeframe trends, enhancing accuracy and reducing noise.
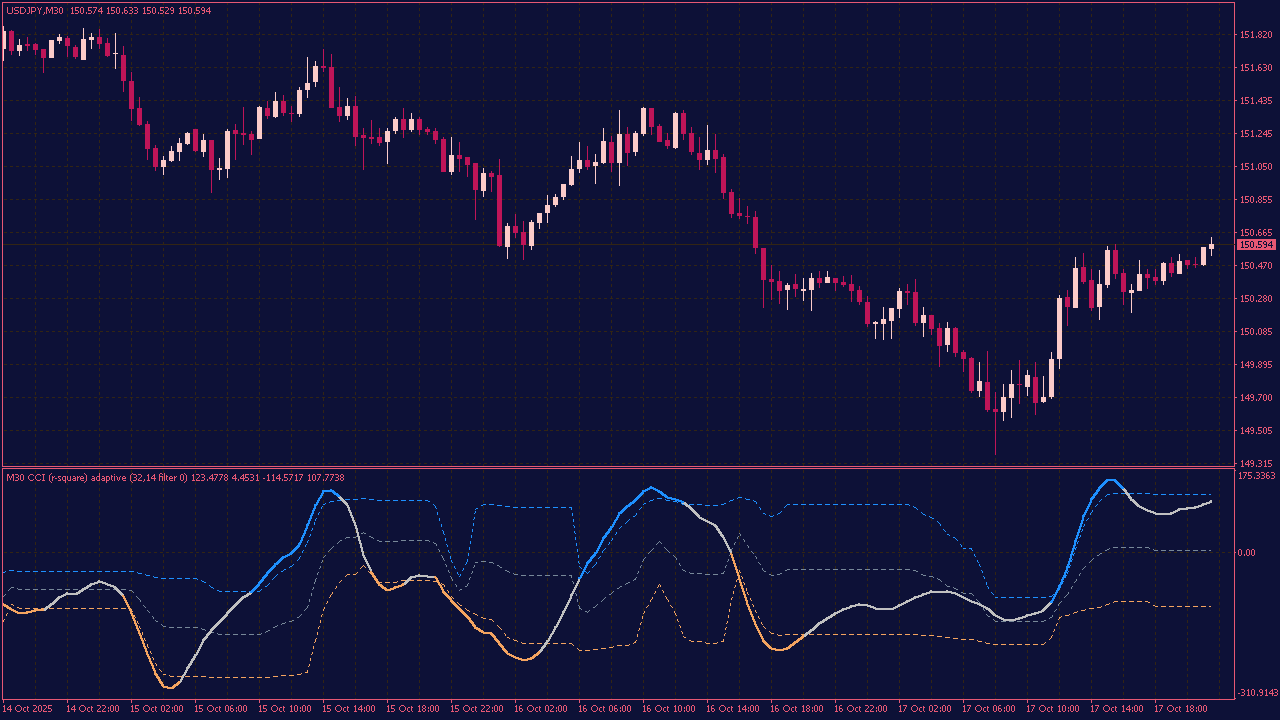
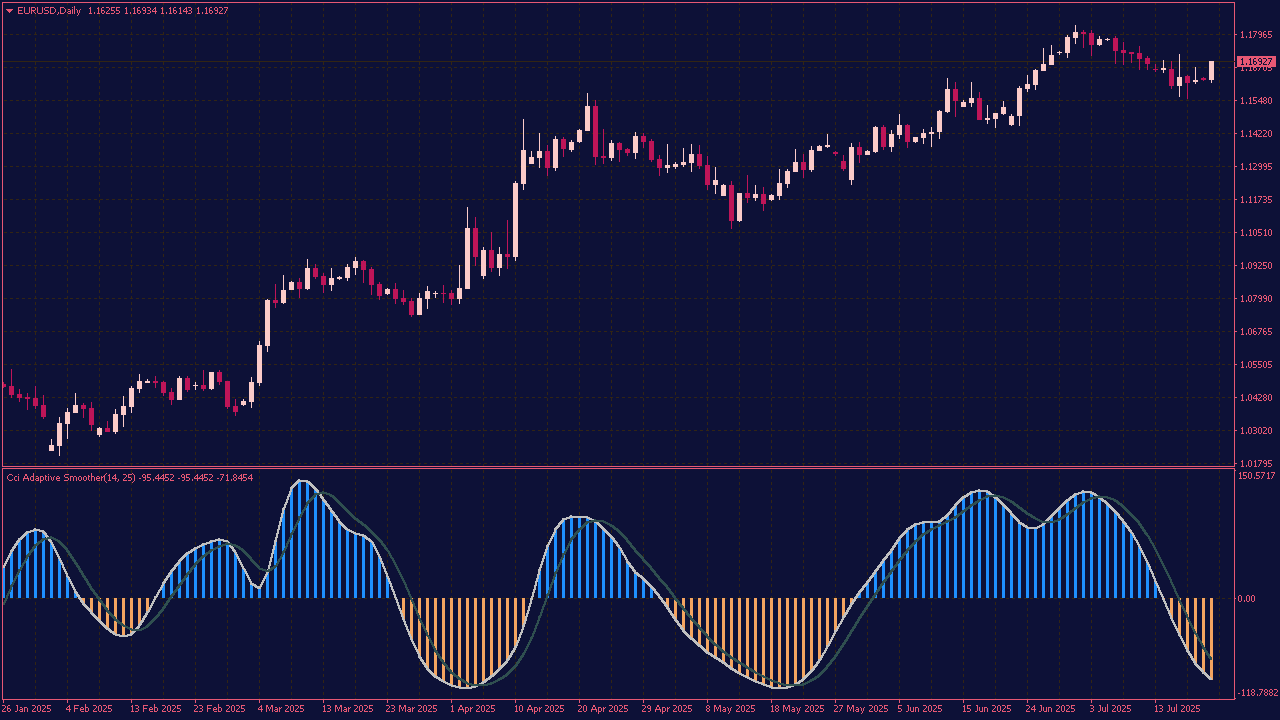
The CCI Adaptive Smoother Indicator is a technical analysis tool that combines the Commodity Channel Index with an adaptive smoothing algorithm. It adjusts its smoothing period dynamically based on market conditions, helping to filter out market noise while preserving trend signals. This makes it more responsive during volatile periods and smoother during stable trends, enhancing the accuracy of trend detection and potential entry/exit signals.
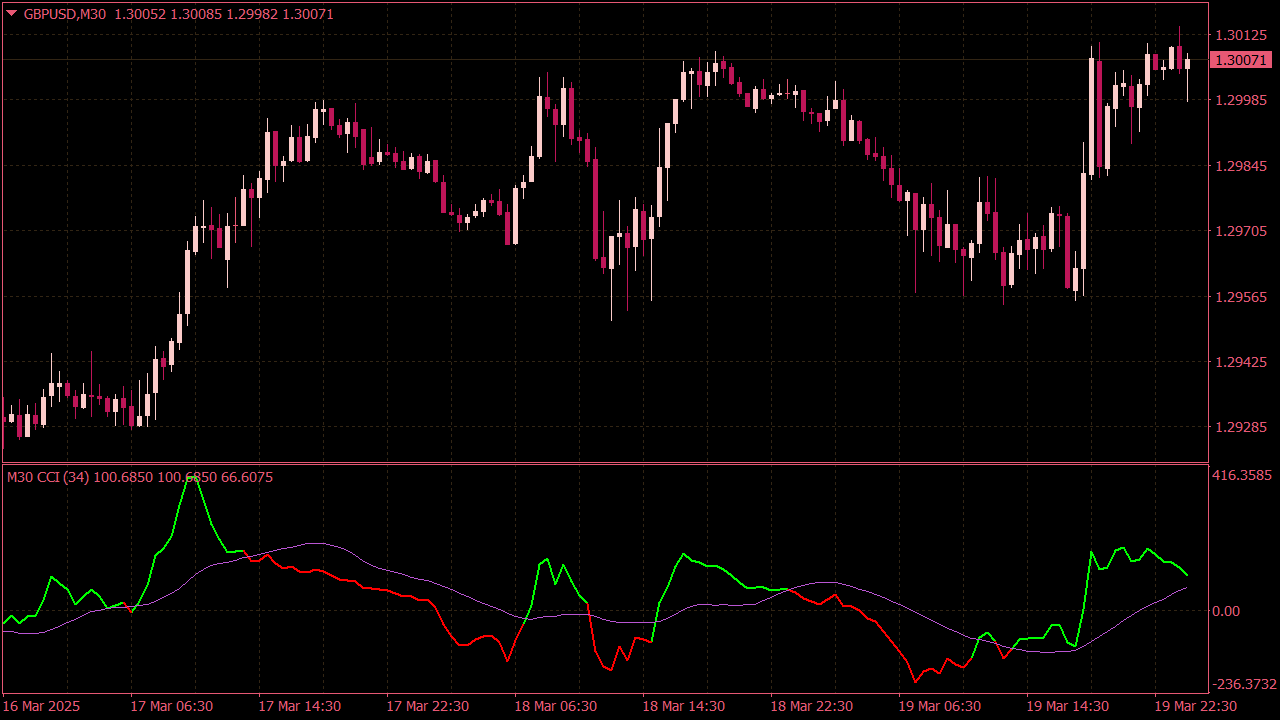
The Real Woodie CCI Indicator is a momentum indicator that uses a single CCI line and a color-coded histogram to identify trends and potential reversals.
The CCI line measures price deviation from its average.
The histogram visually shows momentum direction (e.g., green for up, red for down).
Zero-line crossovers and histogram color shifts signal possible trade entries or exits.
It’s widely used in Woodie’s trading system for fast, visual trend analysis.
The CCI Digital Kahler Indicator is an enhanced version of the traditional Commodity Channel Index, designed to reduce noise and improve signal accuracy using digital filtering techniques.
Smoothed CCI line for clearer trend and momentum signals.
Helps identify overbought/oversold conditions with reduced false signals.
Responsive to market shifts, making it suitable for both trend-following and reversal strategies.
It's favored by traders who want a cleaner, more stable CCI for better decision-making.
The JMA CCI Indicator combines the Commodity Channel Index with the Jurik Moving Average to provide a smoother, more responsive trend and momentum signal. The JMA reduces noise and lag, making CCI signals more reliable by filtering out market fluctuations. This indicator is ideal for traders seeking precise entries in trending or ranging markets.
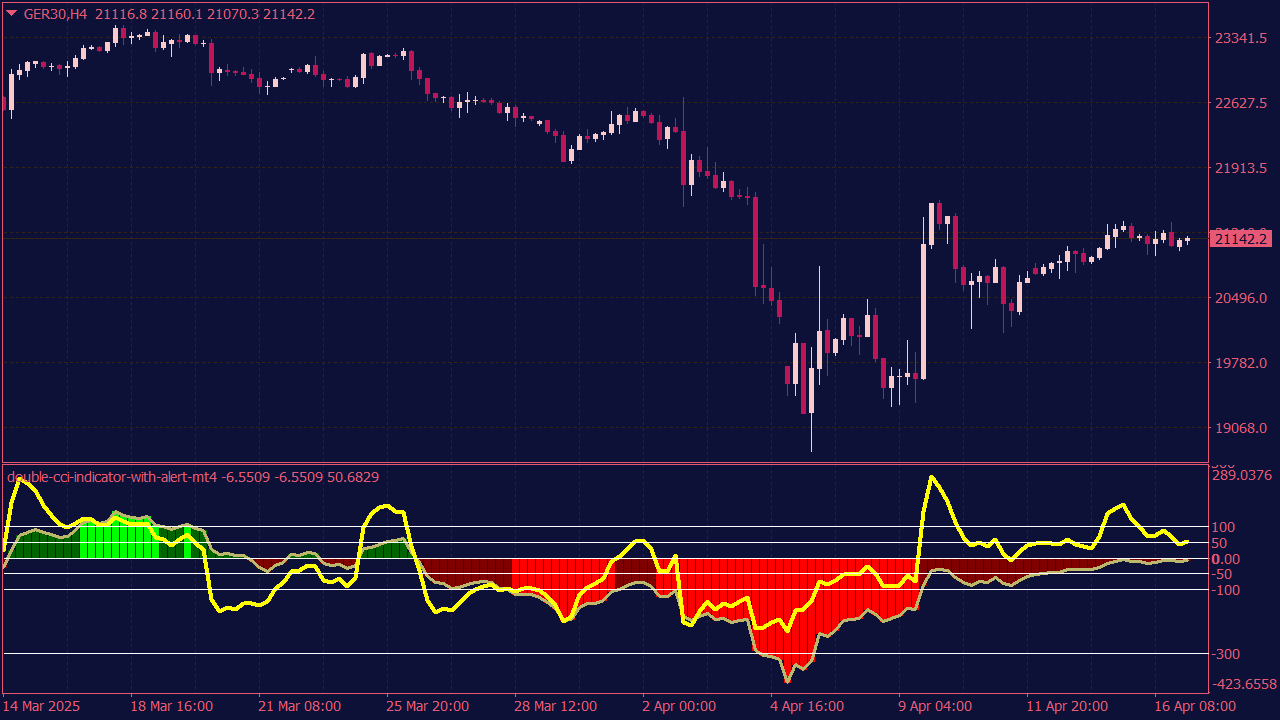
The Double CCI Indicator with Alert uses two Commodity Channel Index lines — typically a fast CCI (e.g., 14-period) and a slow CCI (e.g., 50- or 100-period) — to identify trade signals based on momentum and trend alignment. Alerts are triggered when the fast CCI crosses key levels (like ±100) in the direction of the slow CCI trend, helping traders spot potential entry points with confirmation.
CCI Pre-Filtered with Averages, Floating Levels and Arrows
The CCI Pre-Filtered with Averages, Floating Levels, and Arrows is an advanced version of the Commodity Channel Index that incorporates smoothing, dynamic levels, and visual signals to enhance trade accuracy.
Pre-filtered CCI: Uses moving averages to reduce market noise.
Floating levels: Adaptive overbought/oversold zones based on market conditions.
Arrows: Visual buy/sell signals based on CCI crossovers or level breaks.
This indicator helps traders spot high-probability entries and exits with greater clarity and reduced lag.
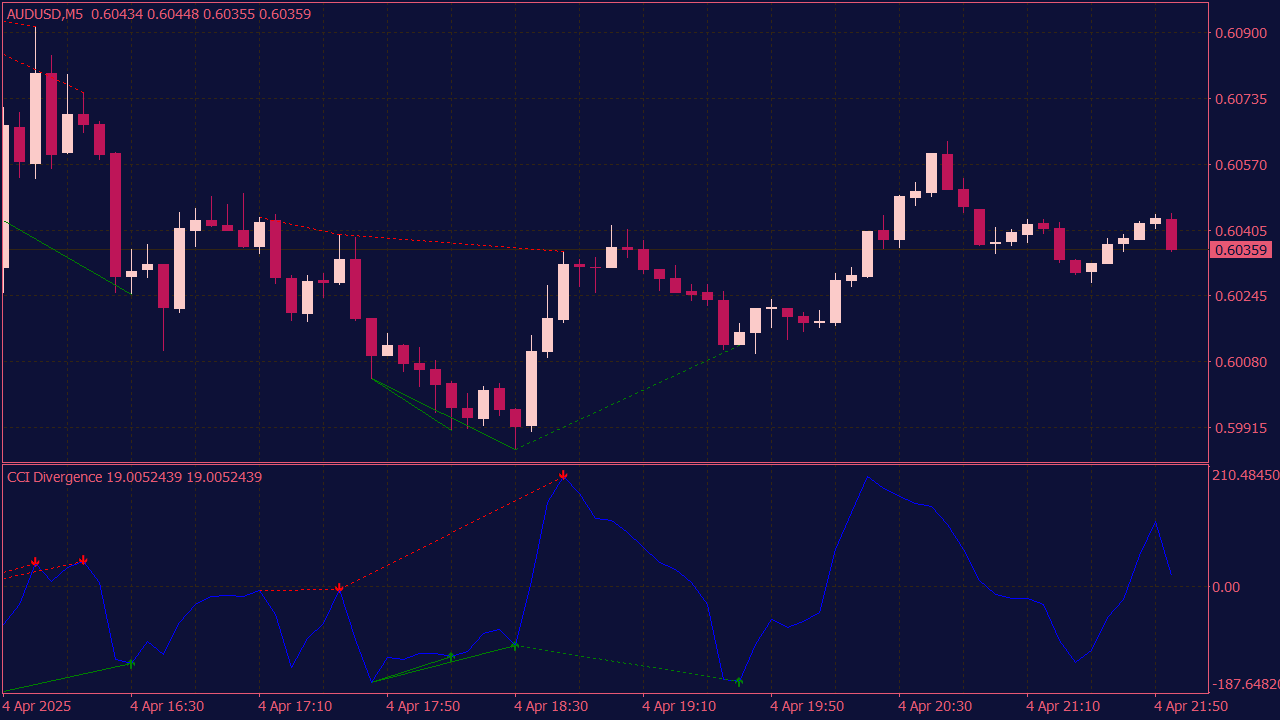
The CCI Divergence Indicator identifies potential trend reversals by comparing the Commodity Channel Index with the price action of an asset. Divergence occurs when the price forms a new high or low, but the CCI fails to confirm this move, signaling possible weakness or strength in the trend. This can help traders spot overbought or oversold conditions, aiding in timing entries or exits.
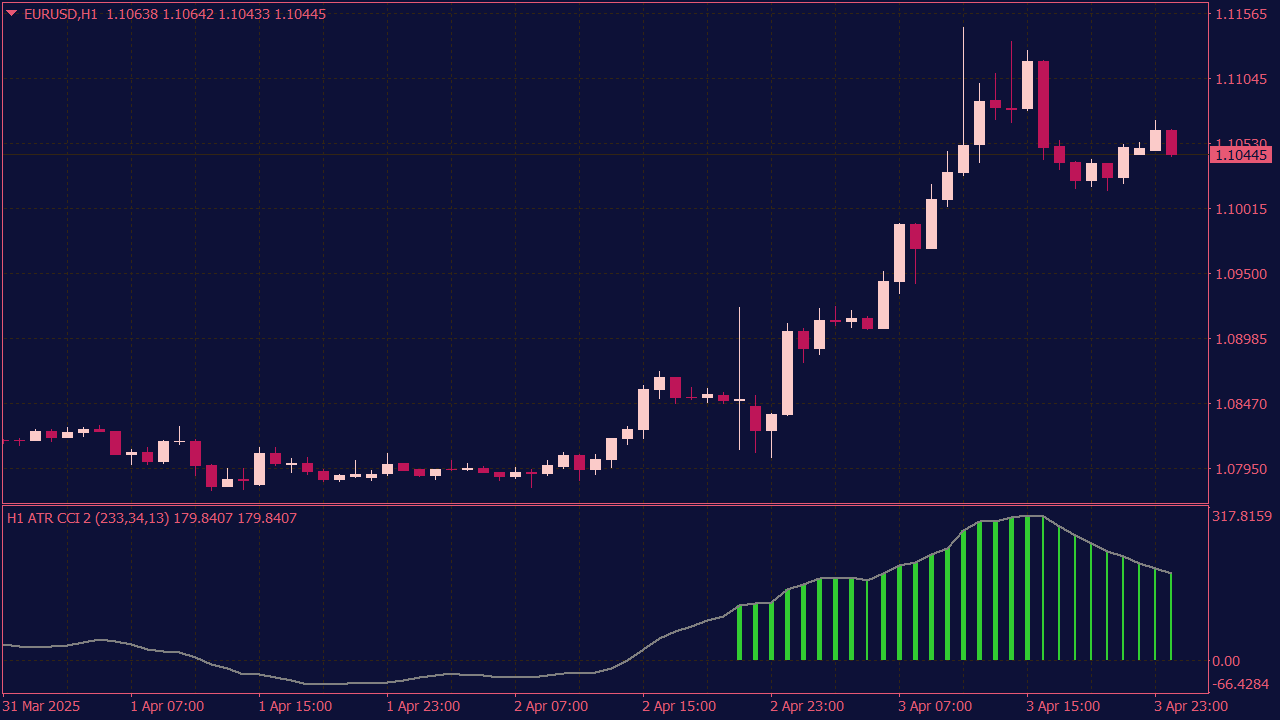
The ATR CCI MTF Indicator combines the Average True Range and Commodity Channel Index across multiple timeframes to provide a comprehensive view of market volatility and momentum.
CCI detects trend strength and overbought/oversold conditions.
ATR measures market volatility for dynamic signal filtering.
MTF (Multi-Timeframe) shows CCI/ATR signals from higher or lower timeframes.
Helps confirm trends and reduce false signals by aligning multiple timeframe data.
This indicator is useful for traders seeking high-accuracy entries by combining momentum, volatility, and cross-timeframe analysis.
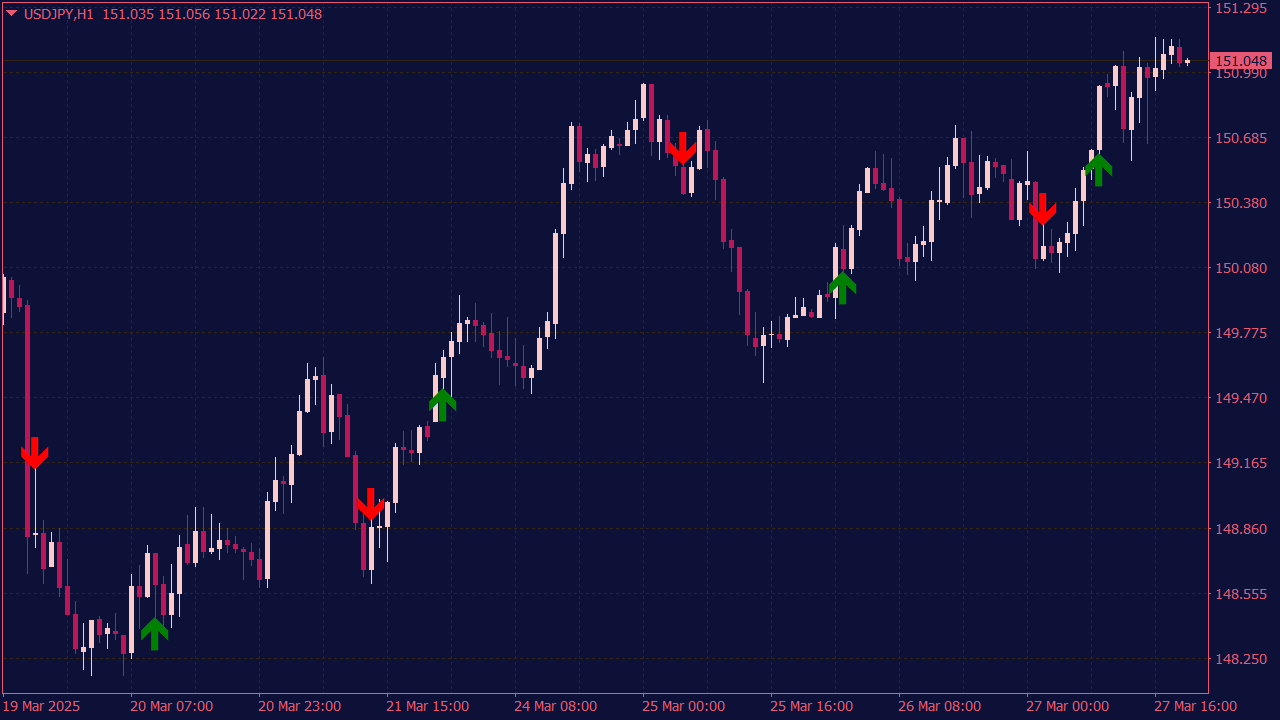
The CCI NRP Indicator with Arrows is a non-repainting version of the Commodity Channel Index that adds clear, real-time trade signals directly on the chart.
NRP (Non-Repainting): Signals remain fixed once confirmed, ensuring reliability.
Arrows on chart: Visual buy/sell signals based on CCI crossovers or level breaks.
Trend and momentum detection: Highlights overbought/oversold zones for potential entries/exits.
Ideal for traders who want clear, trustworthy signals without repainting issues.
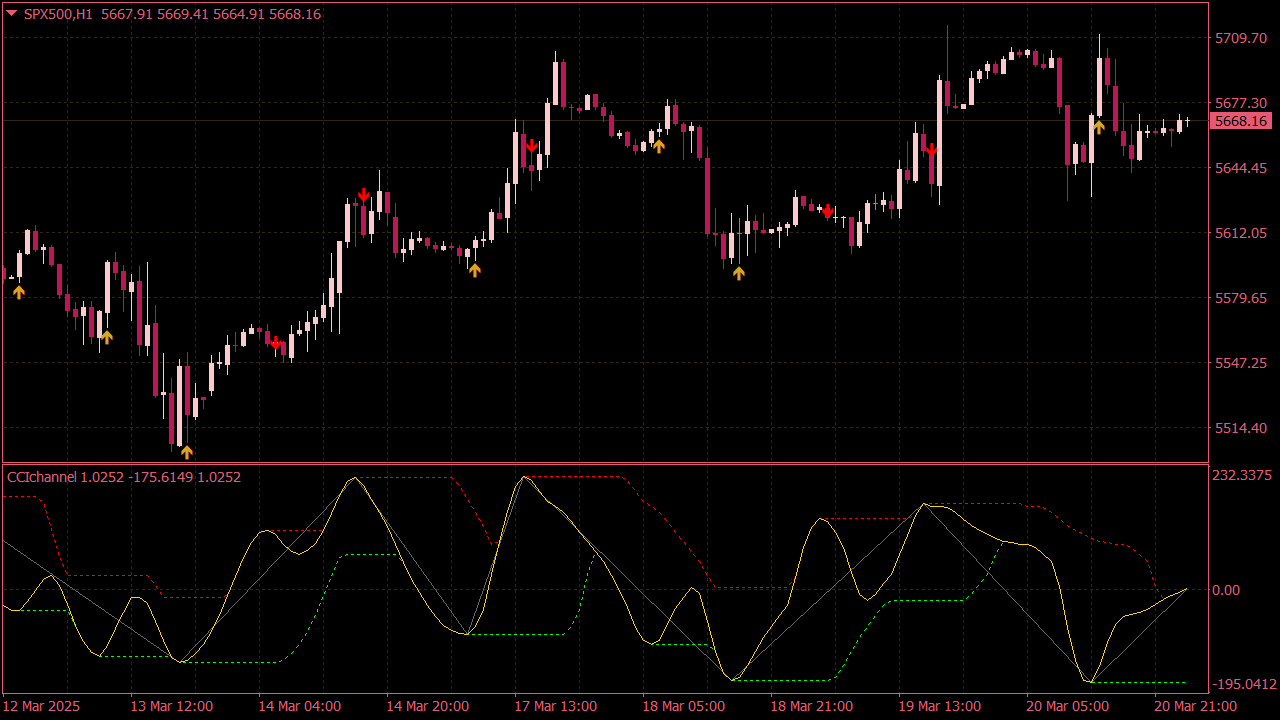
The CCI with Channel and Arrows is a visual trading indicator that enhances the standard Commodity Channel Index by adding dynamic channels and entry/exit signals.
CCI line tracks momentum and trend strength.
Channel defines adaptive overbought/oversold zones for better signal accuracy.
Arrows indicate potential buy/sell points based on CCI interactions with the channel.
Useful for identifying reversals and trend continuations with clear visual guidance.
The CCI MTF NRP with Arrows and Alerts is a multi-timeframe, non-repainting Commodity Channel Index indicator that provides clear trade signals with visual arrows and sound/email alerts.
MTF (Multi-Timeframe): Shows CCI signals from higher or lower timeframes.
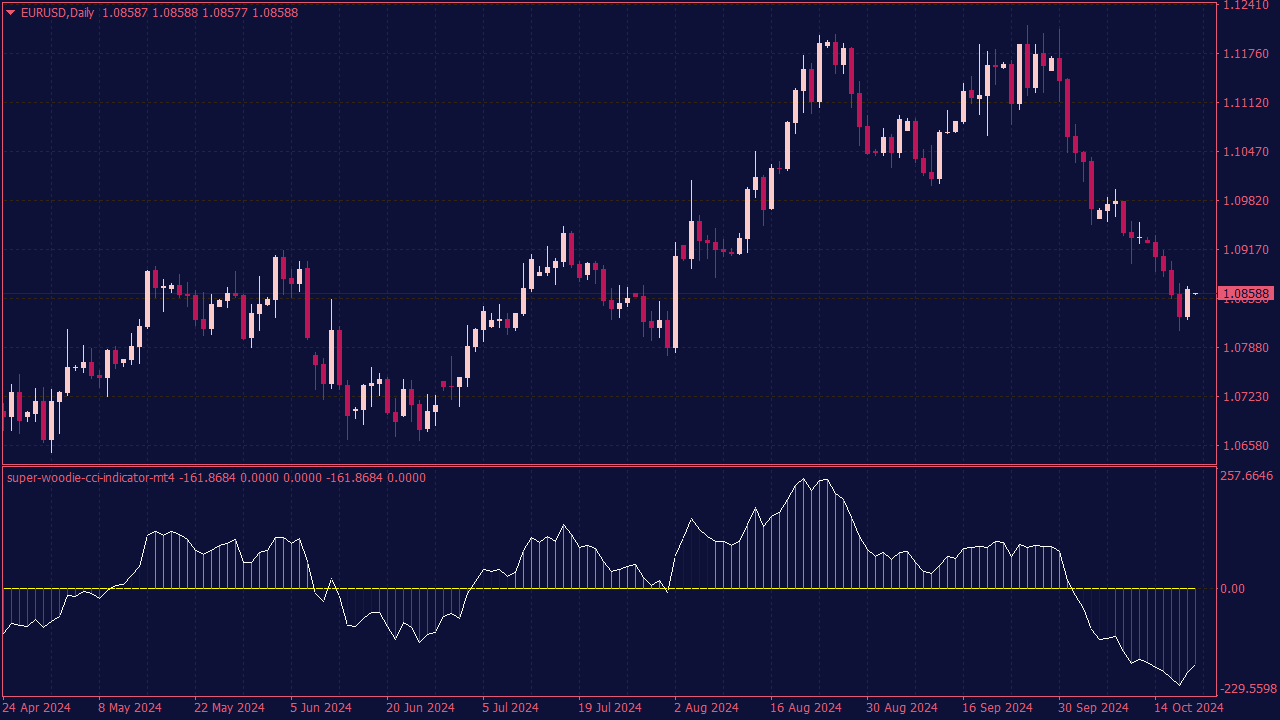
The Super Woodie CCI Indicator typically combines the classic CCI with additional filters for enhanced trading signals. Traders generally look for buy signals when the CCI crosses above +200 and sell signals when it crosses below -200. A common strategy includes confirming trades with other indicators or price action, utilizing support and resistance levels, and monitoring for divergences. Entry points can also be refined by checking for trend alignment, such as confirming bullish or bearish trends using moving averages. Always consider risk management techniques, such as stop-loss orders, to protect against adverse price movements.
⚠️ The CCI Trap: Reading Forex Momentum Beyond Overbought and Oversold
The Commodity Channel Index is easy to add to a chart, but not always easy to read correctly.
That is where many forex traders get into trouble. They see the CCI above +100 and immediately think the market is overbought. They see it below -100 and assume the pair is oversold. On paper, that sounds simple. In live market conditions, it is often too simple.
A strong currency move does not have to reverse just because an oscillator looks stretched. Sometimes, the opposite is true. A move above +100 can be the first sign that buyers are finally taking control. A move below -100 can show that sellers are pressing with real momentum.
So the better question is not: Is the CCI overbought or oversold?
The better question is: Is momentum expanding, fading, reloading, or failing?
That is where the CCI becomes useful. Not as a magic signal, but as a way to read the pressure behind price movement.
🧠 First Principle: Do Not Fight Momentum Too Early
One of the most common CCI mistakes is fading strength just because the indicator has moved into an extreme zone.
A CCI reading above +100 can mean the market is stretched, but it can also mean a new bullish phase is starting. A reading below -100 can warn of weakness, but it can also confirm strong bearish control.
The context matters more than the number itself:
A CCI extreme after a long, tired move may suggest exhaustion.
A CCI extreme after a tight consolidation may suggest ignition.
That difference is important. The same reading can have two completely different meanings depending on price structure, volatility, and session timing.
A trader who sells every move above +100 is not reading momentum. They are reacting to a number.
🚀 Setup 1: The Ignition Move
The Ignition Move appears when the market has been quiet and then suddenly expands.
Price may spend several candles moving sideways. The range is narrow. The CCI stays close to the zero line. There is no clear pressure from buyers or sellers.
Then price breaks out of the range, and the CCI pushes sharply above +100 or below -100.
That is when the setup becomes interesting.
For a bullish Ignition Move, price breaks above a clear resistance area while the CCI expands above +100. For a bearish version, price breaks support while the CCI drops below -100 with conviction.
The best versions usually have three ingredients:
a tight price range
a quiet CCI near the zero line
a clean breakout with momentum expansion
The key is compression before expansion. If the CCI has already been jumping around, the signal is less useful. But when momentum has been quiet and then suddenly wakes up with price, the breakout deserves attention.
This setup is not about buying every +100 reading. It is about recognizing when fresh momentum enters the market.
🎯 Setup 2: The Zero-Line Reload
Many traders focus only on +100 and -100, but the zero line often tells a better story.
The zero line is where momentum changes character. Above zero, buyers usually have more control. Below zero, sellers usually have the advantage.
In an uptrend, the CCI may pull back toward zero without turning deeply negative. If price holds support and the CCI turns upward again, the trend may be reloading rather than reversing.
In a downtrend, the opposite applies. The CCI may rise toward zero, fail to hold above it, and then turn lower while price rejects resistance. That can show that buyers tried to recover but could not take control.
A clean Zero-Line Reload usually looks like this:
Price is already trending.
The CCI pulls back toward zero.
Price holds an important structure level.
The CCI turns back in the direction of the trend.
This setup is useful because it avoids chasing. Instead of entering when momentum is already stretched, the trader waits for the market to reset.
🕯️ Setup 3: The One-Candle Lie
False breakouts are common in forex.
A pair breaks above a previous high. Breakout buyers enter. One or two candles later, price falls back below the level. What looked like strength turns into a trap.
The CCI can help identify this type of move.
The One-Candle Lie happens when the CCI briefly moves above +100 or below -100 but cannot stay there. Momentum appears for a moment, then quickly disappears.
For example, EUR/USD breaks above resistance, and the CCI jumps above +100. On the next candle, price falls back below resistance, and the CCI returns inside its previous range.
That does not automatically create a short trade. But it does make the breakout suspicious.
The same idea works on the downside. If price breaks below support, the CCI drops below -100, and then both price and CCI recover quickly, sellers may have been trapped.
The simple rule is:
If price breaks a level but momentum cannot hold, the breakout may be weaker than it looks.
🔥 Setup 4: The +200 Exhaustion Snapback
The +100 and -100 levels are useful, but in volatile markets, they may not be extreme enough.
Pairs such as GBP/JPY, GBP/USD, and other fast-moving instruments can push the CCI far beyond those areas. That is why some traders also watch the +200 and -200 zones.
But there is a mistake to avoid here: +200 is not an automatic sell signal, and -200 is not an automatic buy signal.
Strong momentum can remain extreme for longer than expected, especially during active sessions or after major economic news.
The more useful signal comes after the extreme.
A bearish Exhaustion Snapback appears when the CCI rises above +200, price reaches resistance, and then the CCI falls back below +200 while price fails to continue higher.
A bullish version appears when the CCI falls below -200, price reaches support, and then the CCI climbs back above -200 while price refuses to make a clean new low.
The edge is not the extreme reading itself. The edge is the failure to continue after the extreme.
That small detail makes the setup much more practical.
🕵️ Setup 5: Hidden Divergence — The Quiet Continuation Signal
Regular divergence is popular because it is easy to see. Price makes a higher high while the CCI makes a lower high. Or price makes a lower low while the CCI makes a higher low.
That can be useful, but it is not the only type of divergence worth watching.
Hidden divergence is often more relevant in trending markets.
A bullish hidden divergence forms when price makes a higher low, but the CCI makes a lower low. At first, the indicator looks weak. But price structure is still holding. That is the important part.
If the market refuses to break the previous low, the trend may simply be reloading.
A bearish hidden divergence works in reverse. Price makes a lower high, but the CCI makes a higher high. Momentum appears stronger, but price still cannot break structure. If sellers return, the downtrend may continue.
A useful distinction:
Regular divergence often warns of a possible reversal.
Hidden divergence often points to possible continuation.
Hidden divergence is not dramatic. It does not call the perfect top or bottom. It simply suggests that a pullback may not be as dangerous as it first appears.
🌊 Setup 6: The Liquidity Sweep Filter
Forex markets often move beyond obvious highs and lows before reversing. Traders call this a liquidity sweep, but the idea does not need to be overcomplicated.
Price breaks a visible high or low, triggers breakout entries and stop orders, then returns back inside the previous range.
The CCI can help judge whether that break had real momentum behind it.
Imagine GBP/USD breaks above a recent high. The move looks bullish. But the CCI fails to make a strong new high or quickly falls back below +100. Then price closes back below the old high.
That is a warning.
Price took the level, but momentum did not confirm the breakout.
For a bullish version, price breaks below a previous low, the CCI fails to confirm strong bearish pressure, and price closes back above the old low. Sellers may have been trapped.
This setup is not about guessing who is behind the move. It is about confirmation.
If price sweeps a level and momentum confirms, the breakout may have strength.
If price sweeps a level and momentum refuses to follow, the move deserves caution.
⚖️ Setup 7: The Dual CCI Filter
A single CCI can be noisy, especially on lower time frames.
One way to reduce that noise is to use two CCI settings:
Fast CCI: 14-period
Slow CCI: 50-period
The slow CCI gives the broader momentum bias. The fast CCI helps with timing.
For a long setup, the slow CCI should be above zero. That shows the broader momentum environment is bullish. The trader then waits for the fast CCI to pull back below zero and turn upward again.
For a short setup, the slow CCI should be below zero. The trader then waits for the fast CCI to rally above zero and turn lower.
This approach helps prevent random entries because the fast CCI is not used alone. It is only trusted when it agrees with the broader momentum condition.
That is a more disciplined way to use the indicator.
⏰ Session Timing Changes the Signal
A CCI breakout during quiet market hours is not the same as a CCI breakout during the London open or the New York session.
For pairs such as EUR/USD, GBP/USD, EUR/JPY, and GBP/JPY, signals during active liquidity periods often carry more weight. A breakout during a slow session may drift, stall, or fail. A breakout during active market flow has a better chance of follow-through.
This does not mean every London or New York signal is valid. It simply means timing changes the quality of the signal.
Before taking a CCI setup, ask:
Is the market active enough for this move to continue?
Is the pair usually liquid during this session?
Is there major news nearby that could distort the signal?
A technically correct setup can still perform poorly if it appears at the wrong time.
🧩 Practical Example: The Pullback That Does Not Break
Consider a simple EUR/USD scenario.
The 4-hour chart is in an uptrend. Price has broken above resistance and later pulls back toward the same area. That old resistance may now act as support.
On the lower time frame, the CCI falls from a strong reading back toward the zero line. Sellers push for a deeper pullback, but price does not break the support zone.
Then the CCI turns upward again.
The entry is not based on the CCI alone. It comes from the combination of trend, structure, pullback, and renewed momentum.
That is the difference between using the CCI as a signal machine and using it as part of a trading plan.
✅ The CCI Checklist Before Any Trade
Before using the CCI for a trade idea, run through a few practical questions:
Is the market trending or ranging?
Is the signal happening near a meaningful level?
Is the CCI confirming the price move or disagreeing with it?
Did price break structure, or did it only sweep liquidity?
Is the signal happening during an active session?
Where is the trade invalidated?
The last question is the most important one.
If there is no clear invalidation point, there is no real setup. There is only an opinion.
🧠 Final Thought: The CCI Is a Momentum Lens, Not a Magic Signal
The CCI is not special by itself. Many traders use it badly because they expect it to give direct buy and sell signals.
Its real value is interpretation:
A high CCI does not always mean sell.
A low CCI does not always mean buy.
A divergence does not always mean reversal.
A breakout does not always mean continuation.
The real question is always the same: What is momentum doing relative to price structure?
That is where the CCI becomes useful.
It can help traders see whether a move is expanding, fading, reloading, or failing. Used in that way, the indicator becomes more than an overbought and oversold tool.
It becomes a momentum lens.
And in forex trading, reading momentum correctly is often more valuable than simply reacting to a signal.
📝 Editor’s Note
The strategies and market concepts discussed in our content are designed to help readers better understand market behavior. They are not trading recommendations. Financial markets are volatile, and every trader should test ideas carefully, manage risk and make independent decisions.