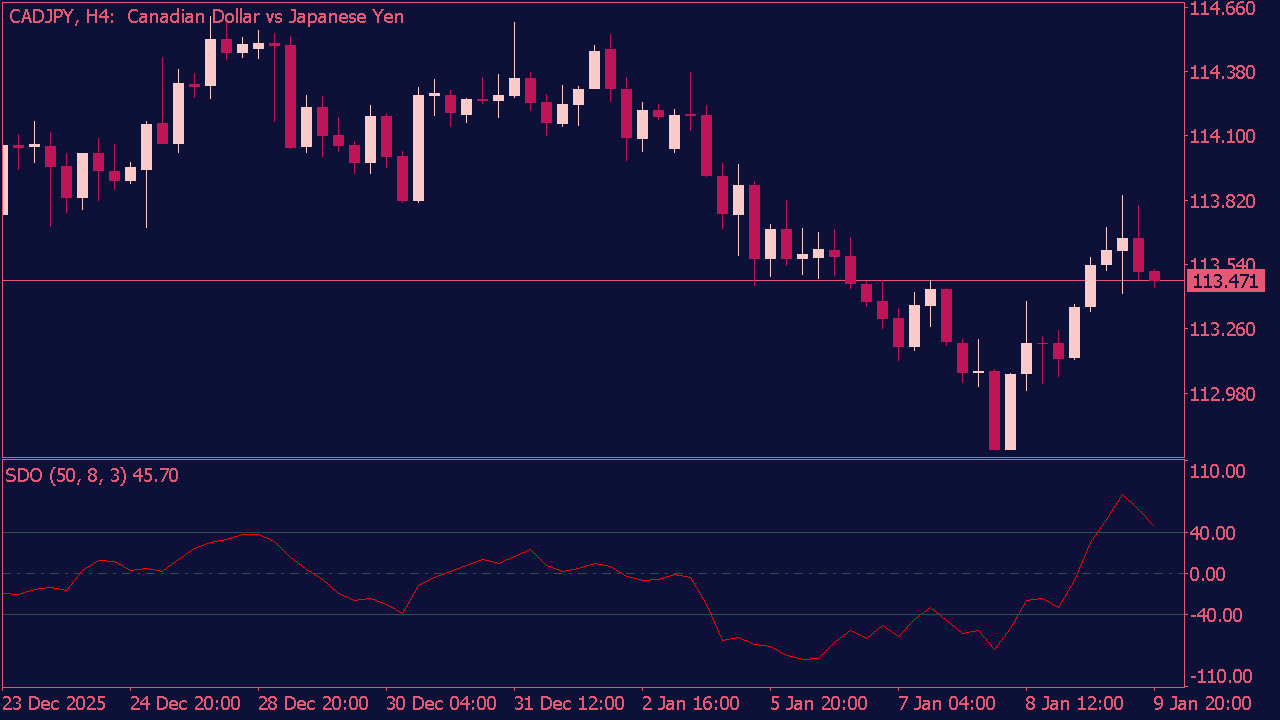
Stochastic Smoothed with SMA Digital Kahler
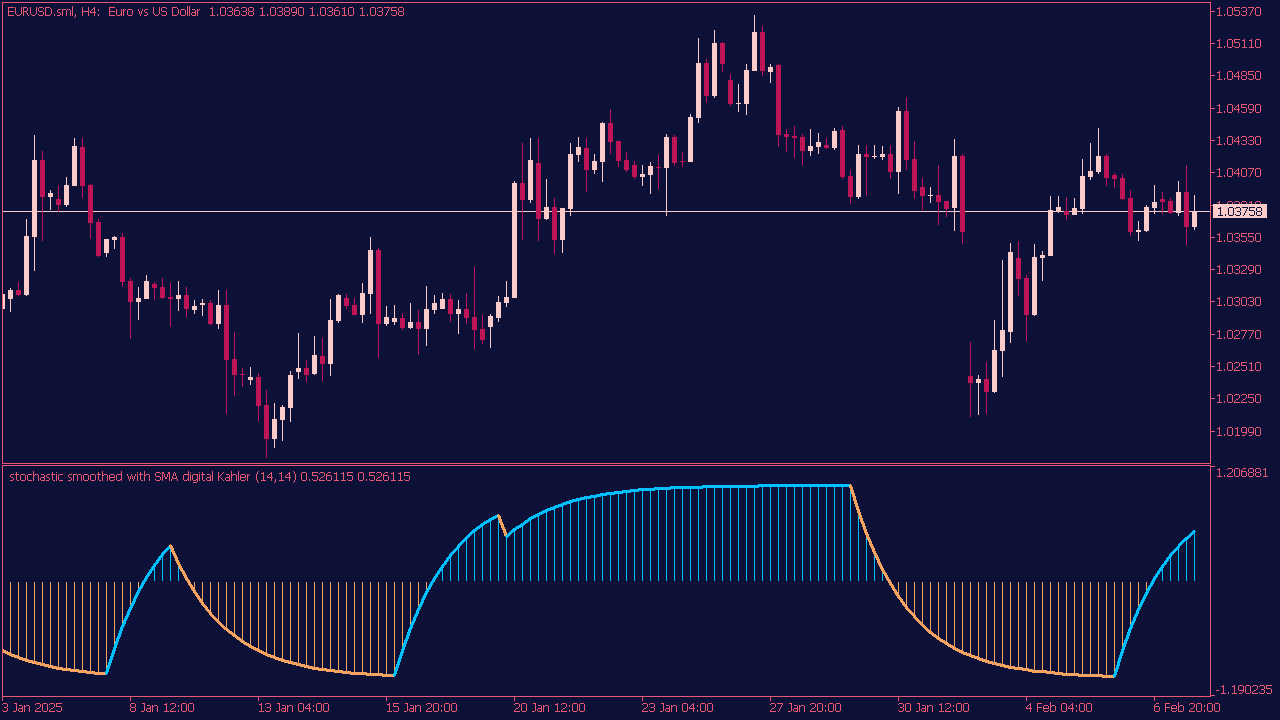
This MT5 indicator is a customized version of the Stochastic Smoothed Indicator, offering enhanced flexibility through a wide selection of averaging methods (41 options) for smoothing the stochastic calculation. Furthermore, it provides the user with a choice of over 30 different price options to be used in the underlying stochastic formula, allowing for fine-tuned analysis and signal generation based on preferred market data.