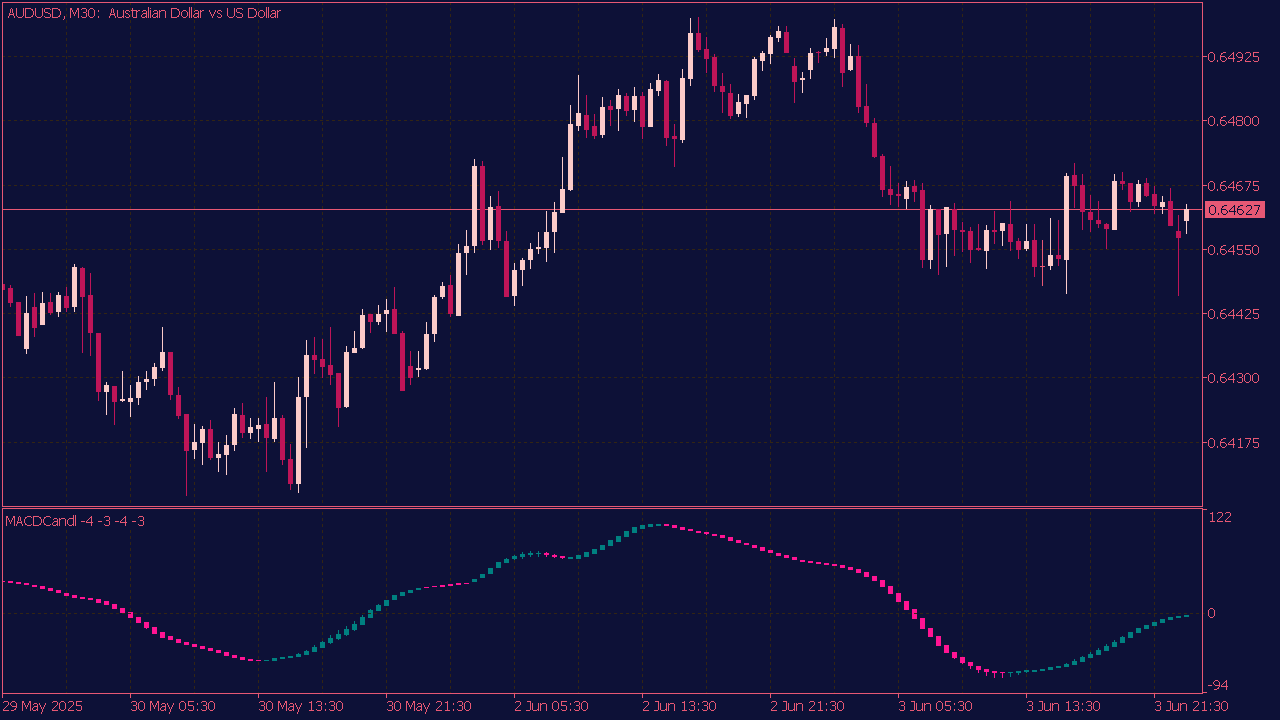
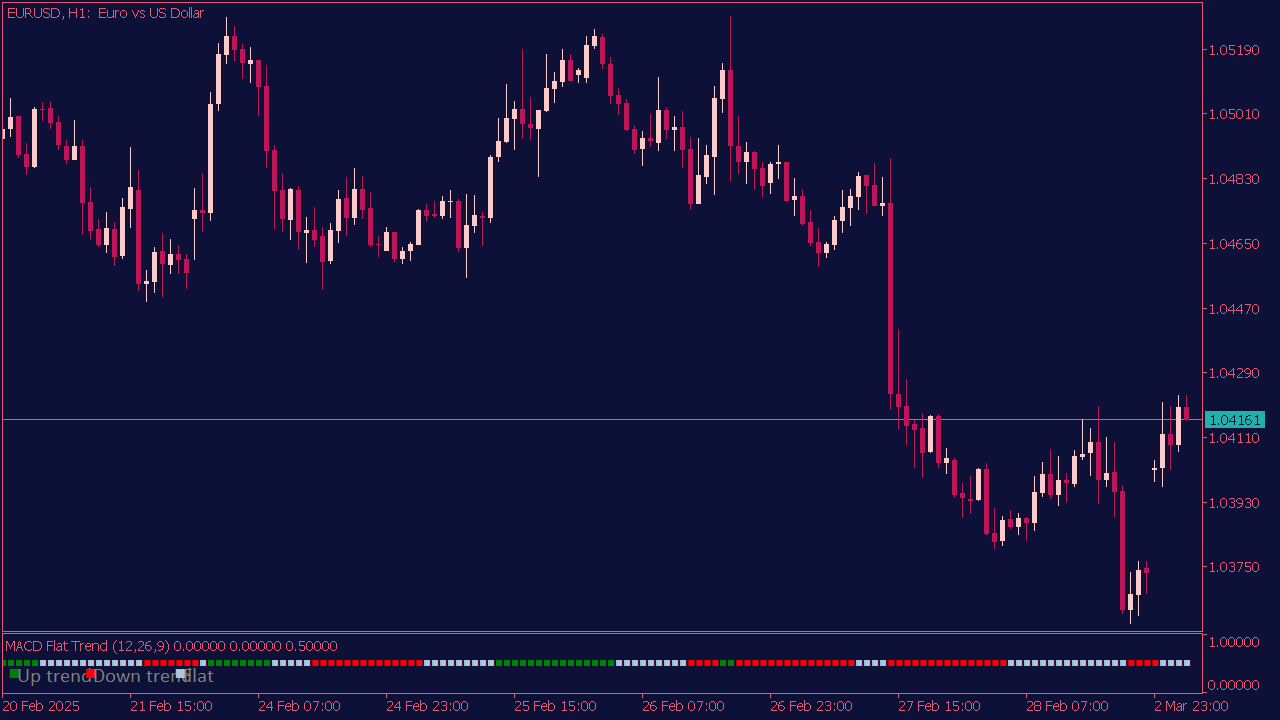
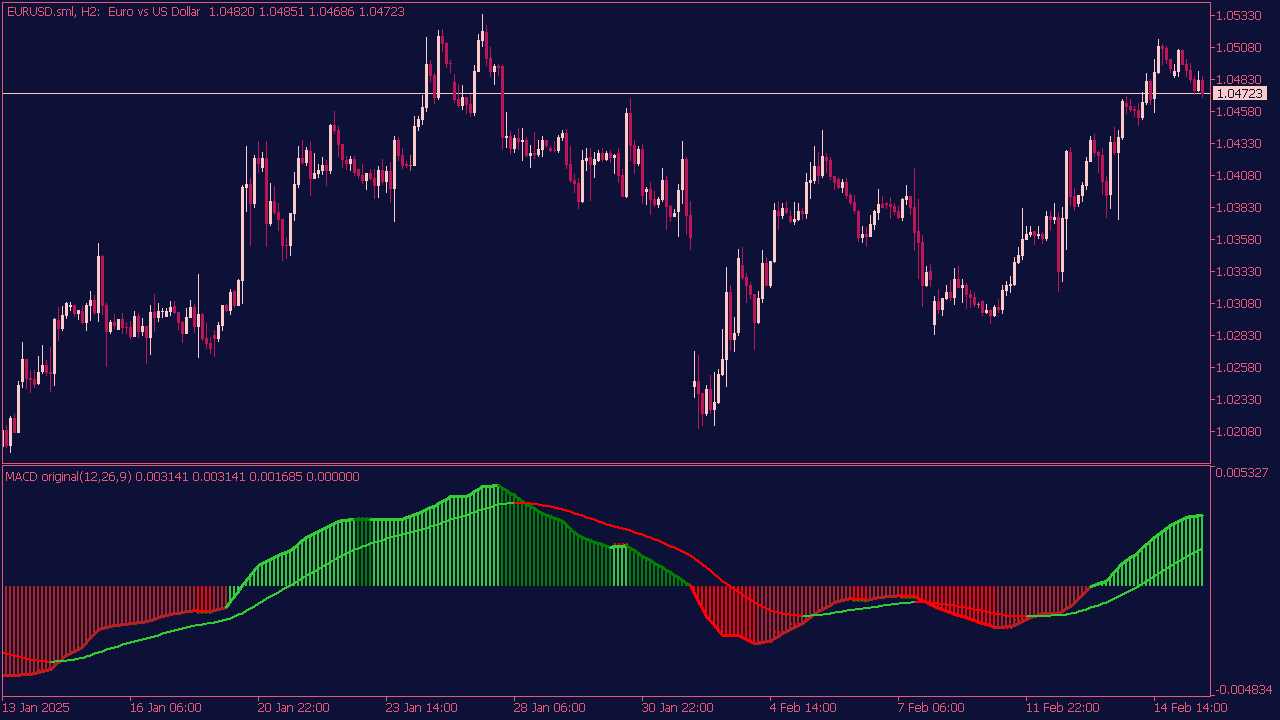
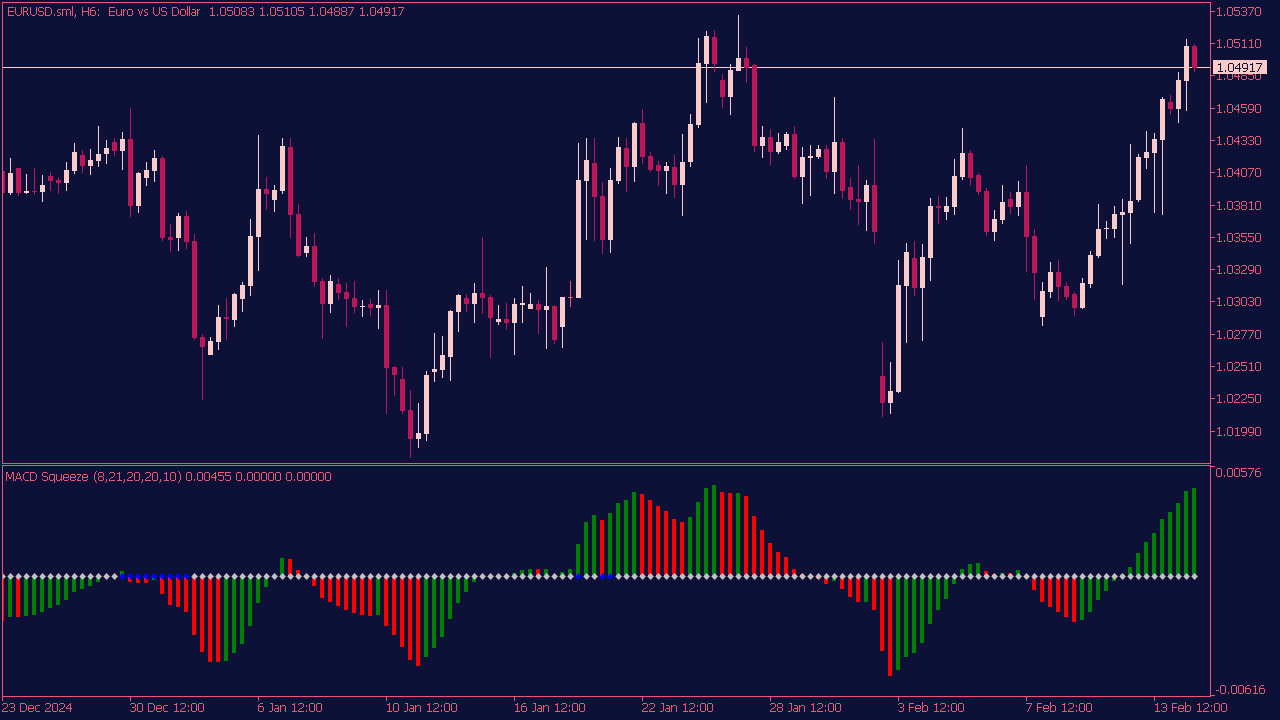
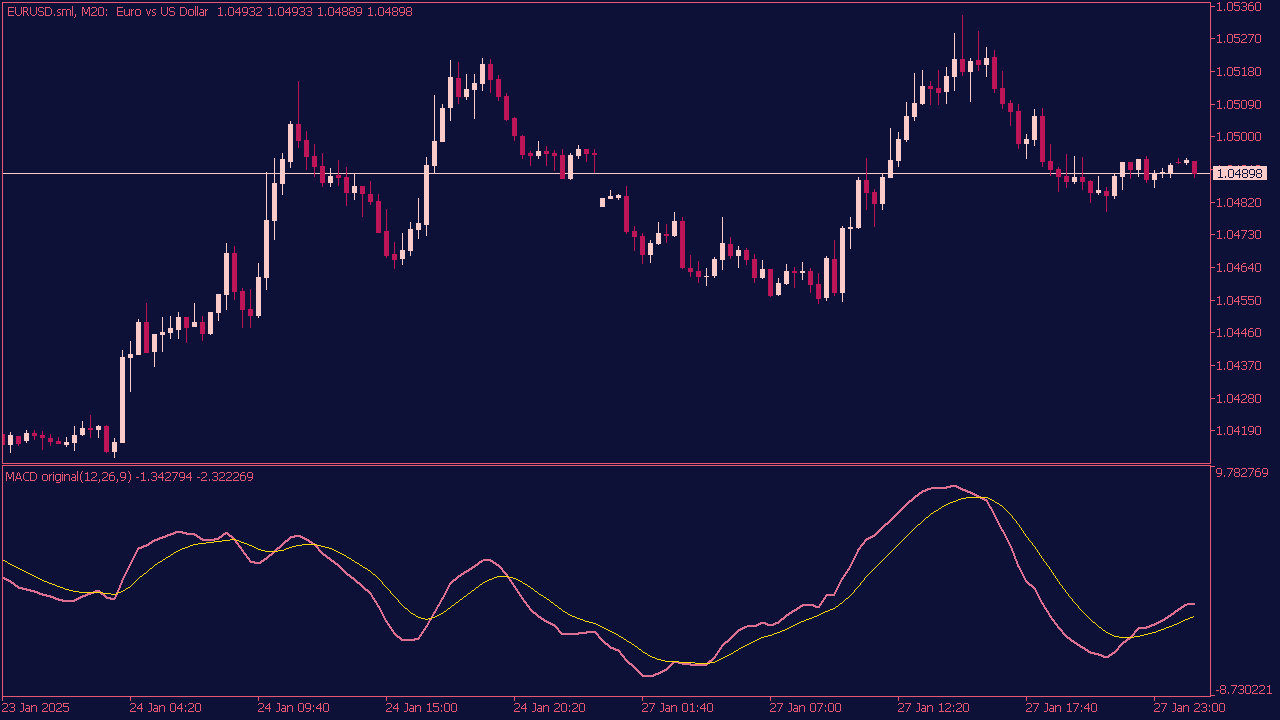
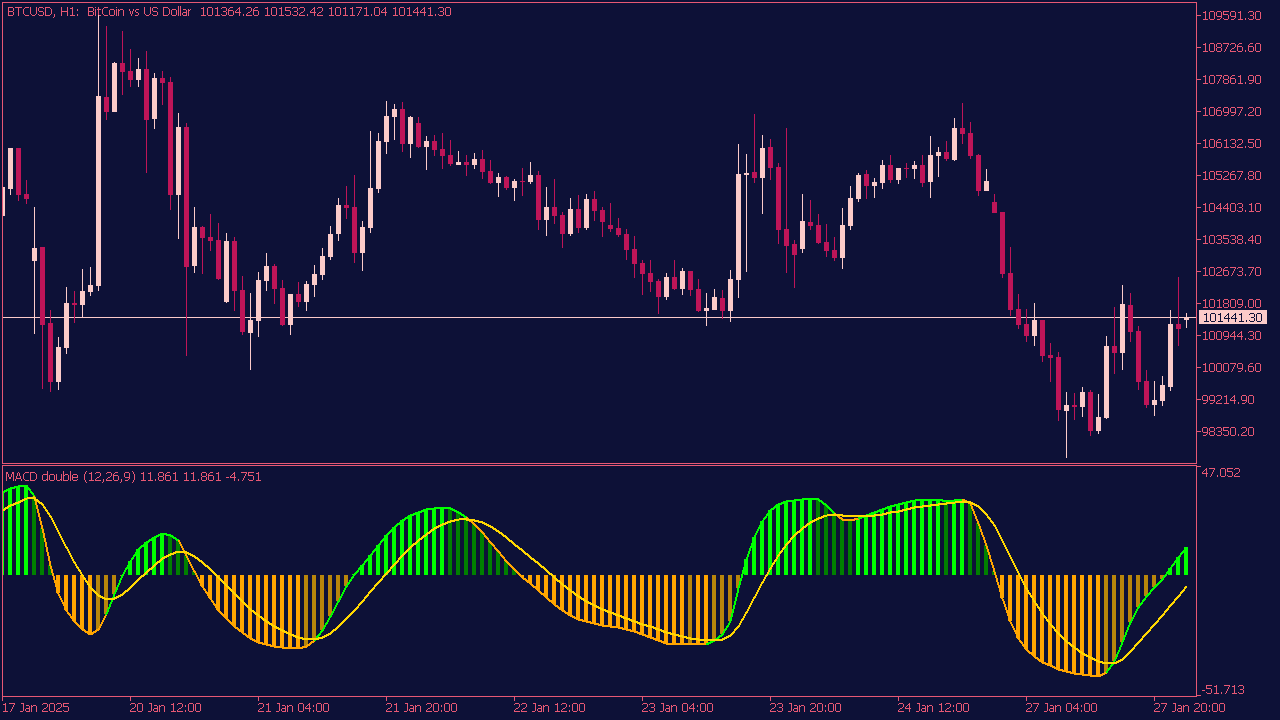
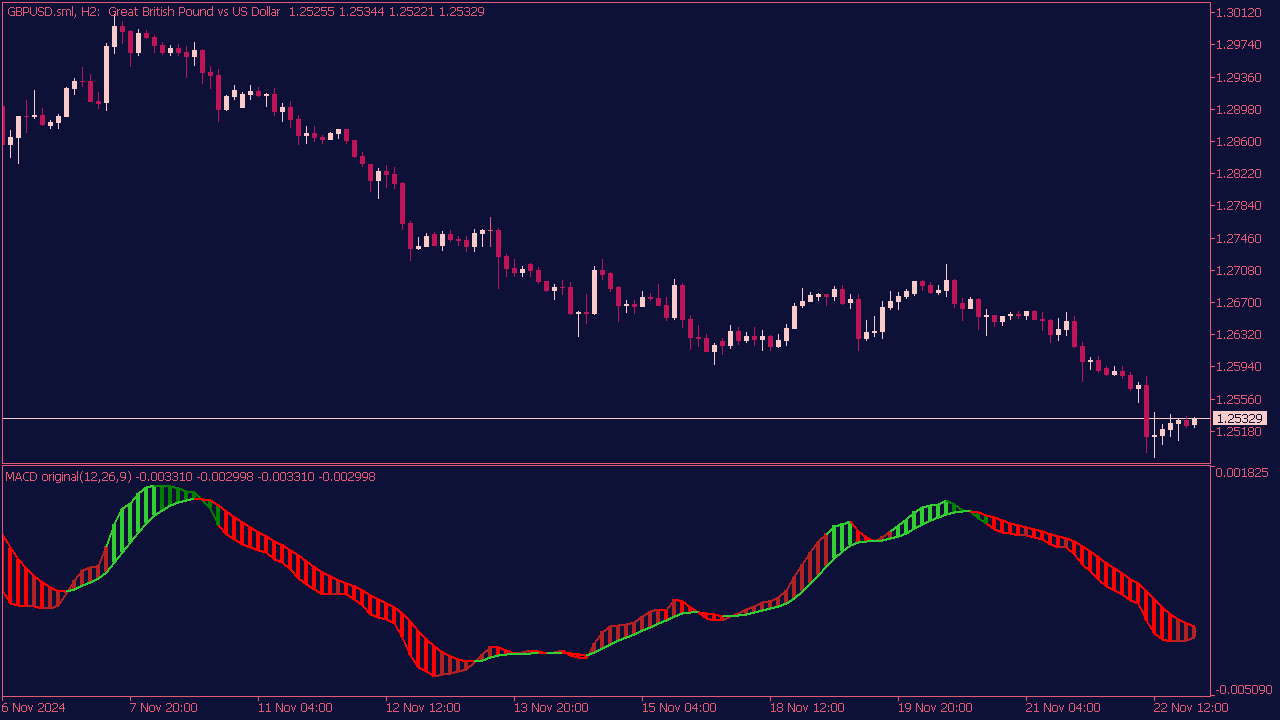
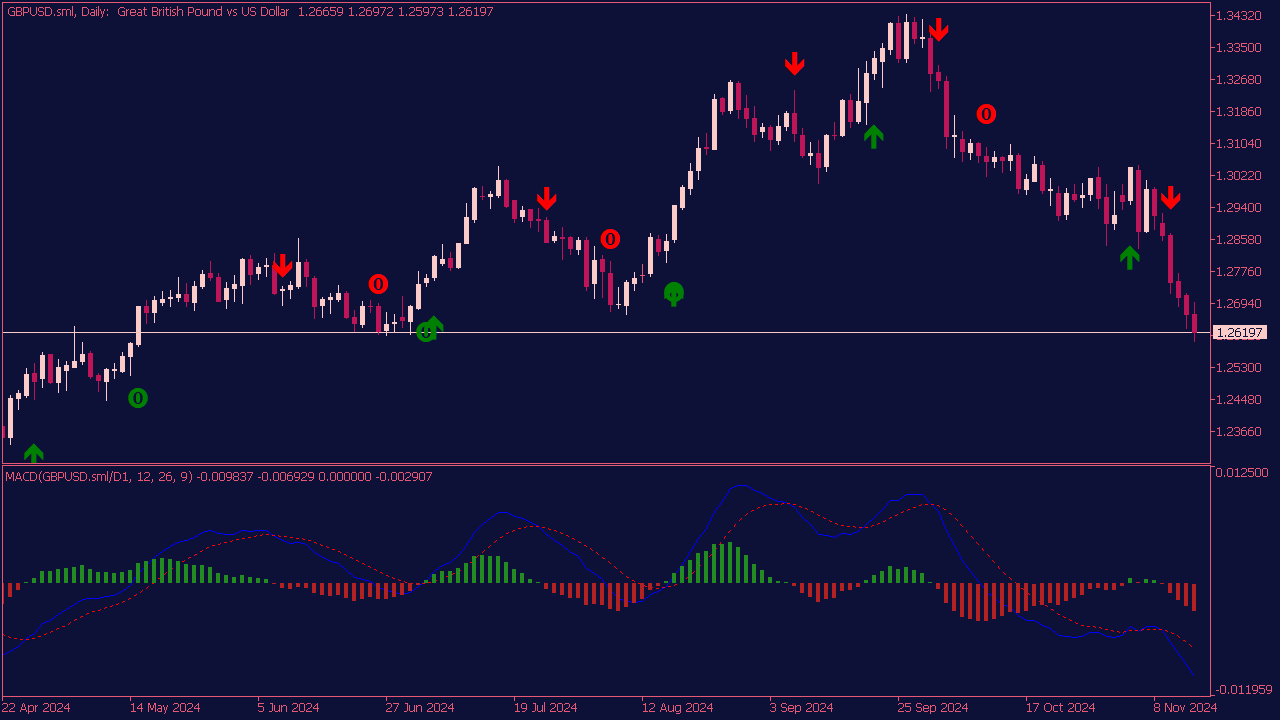
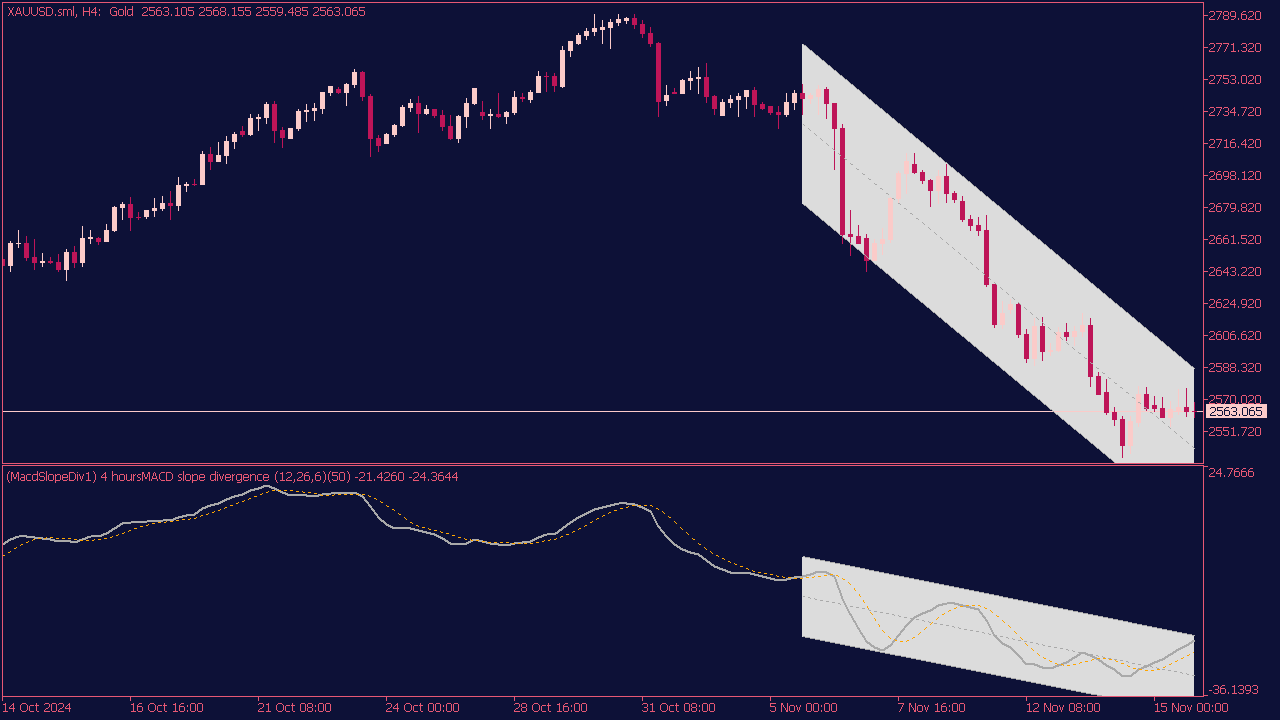
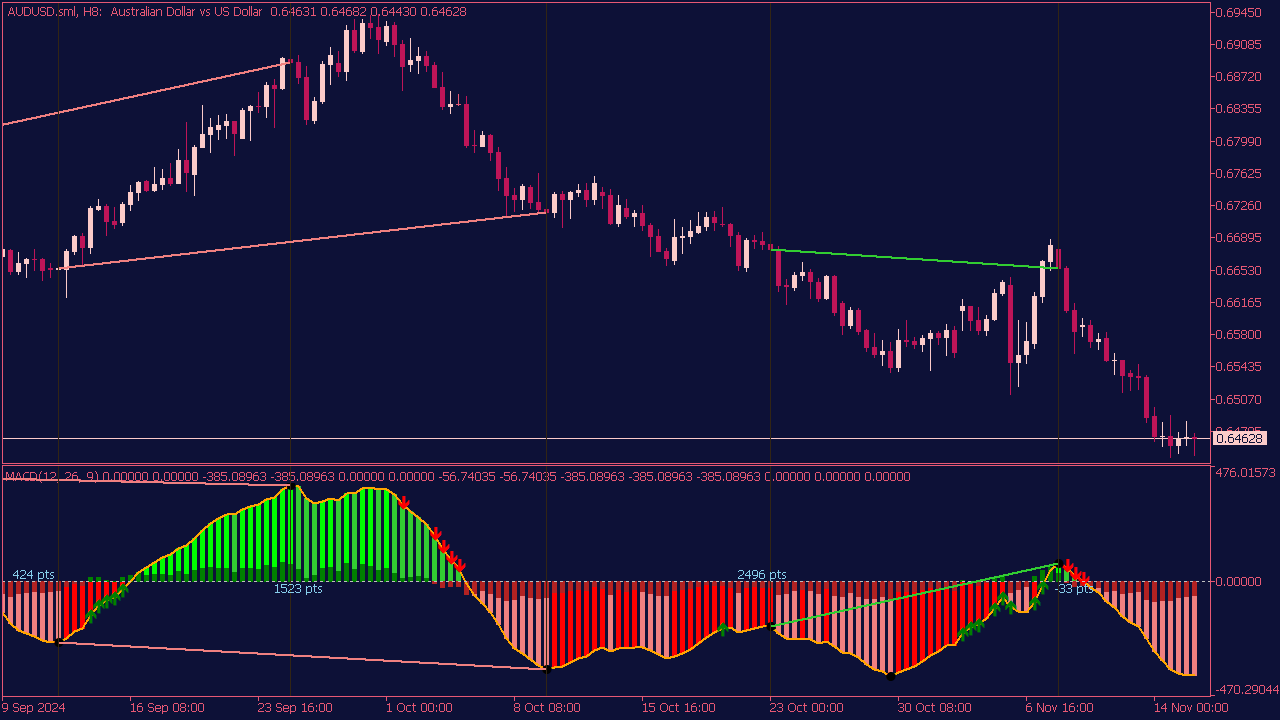
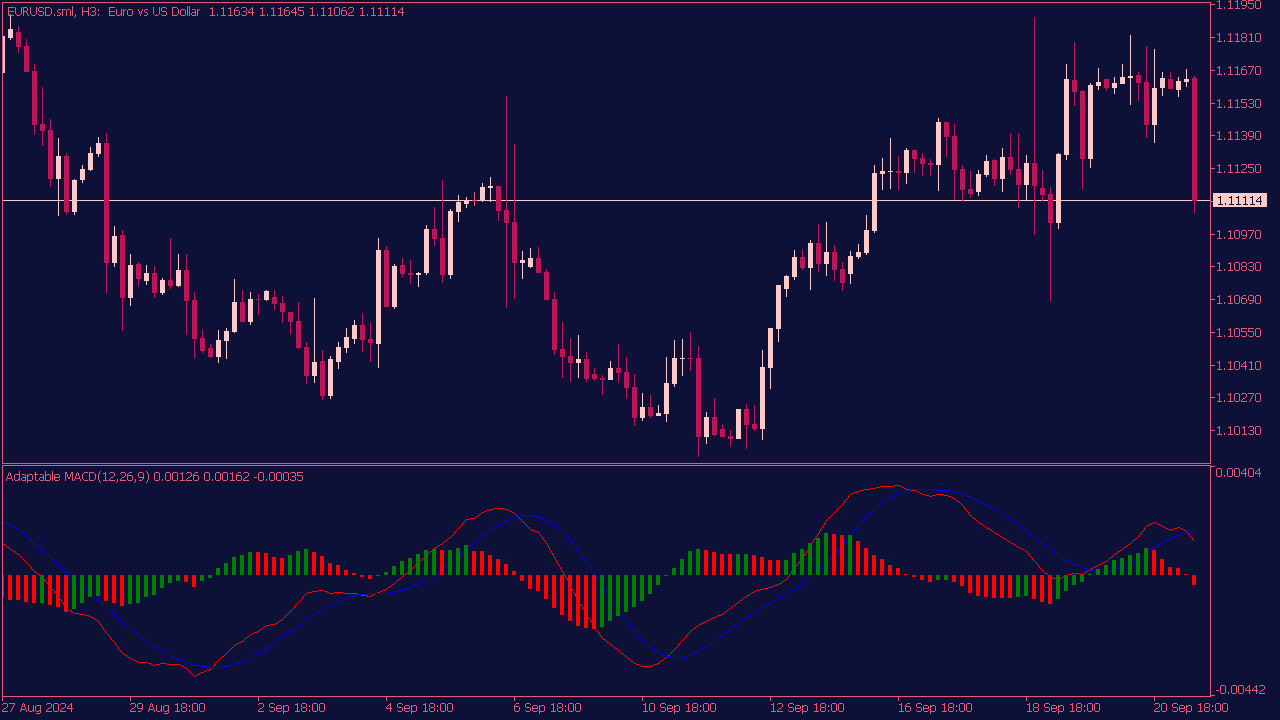
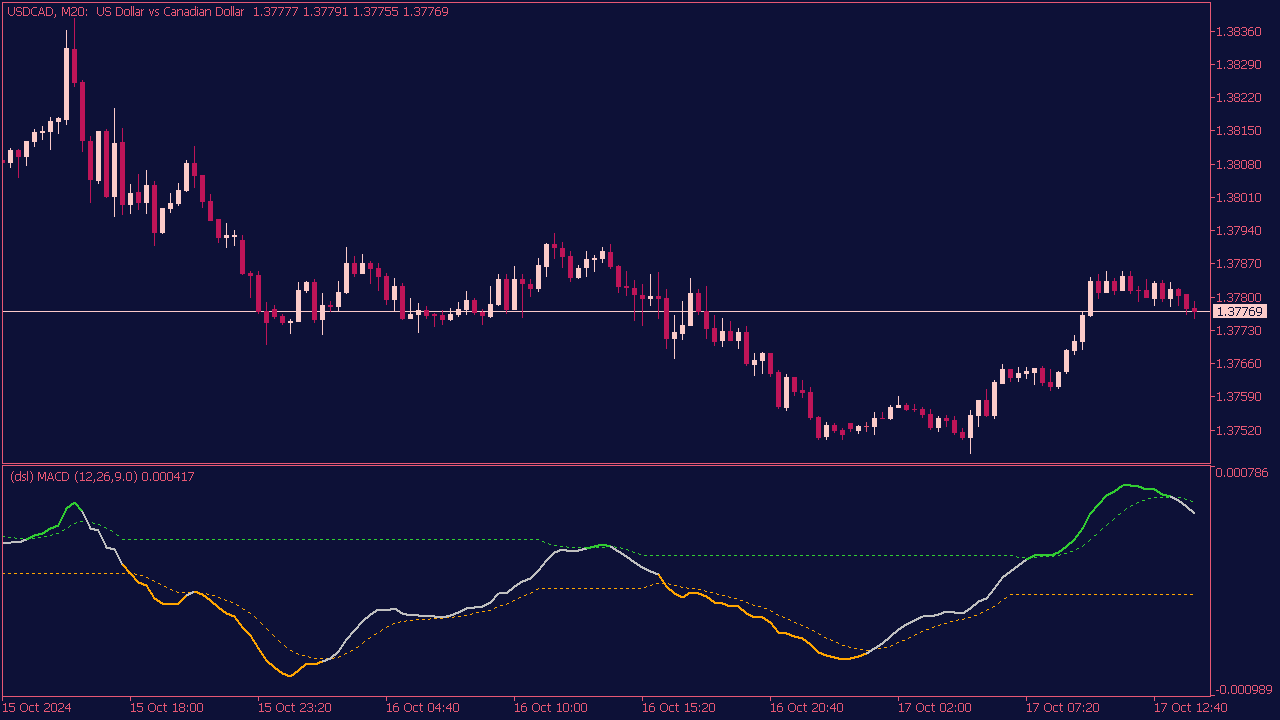
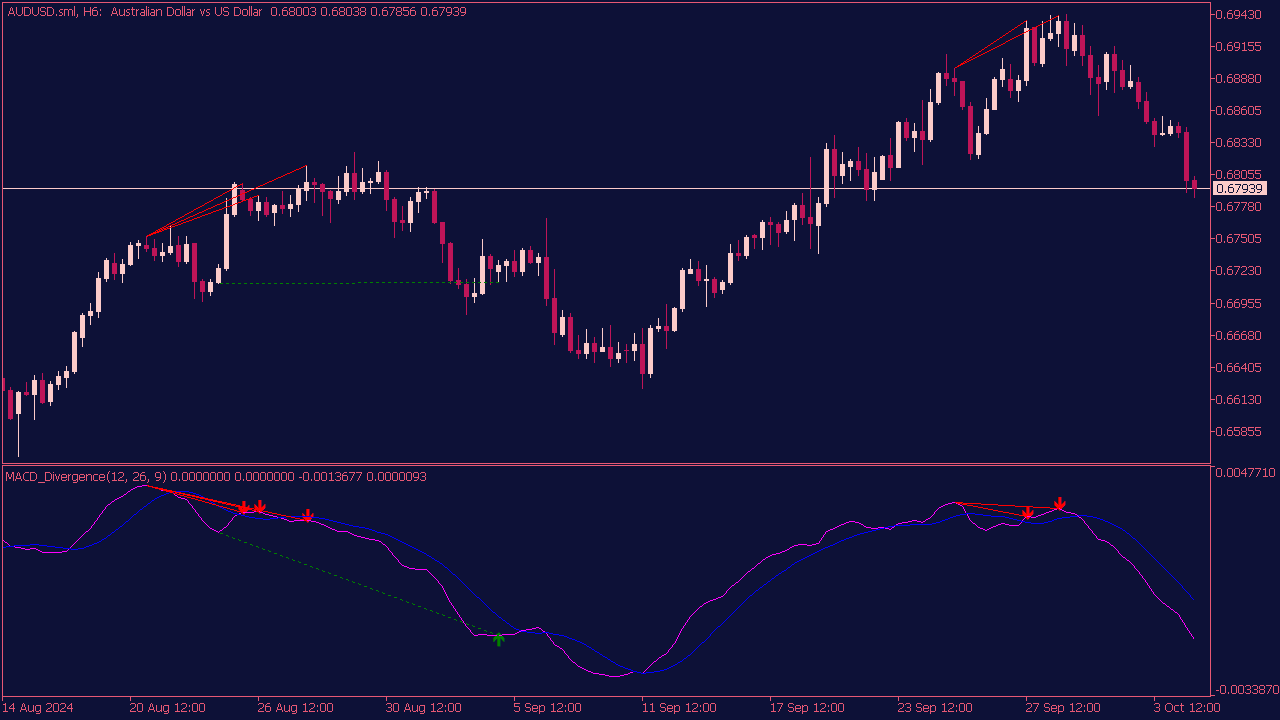
Color MACD Histogram Indicator
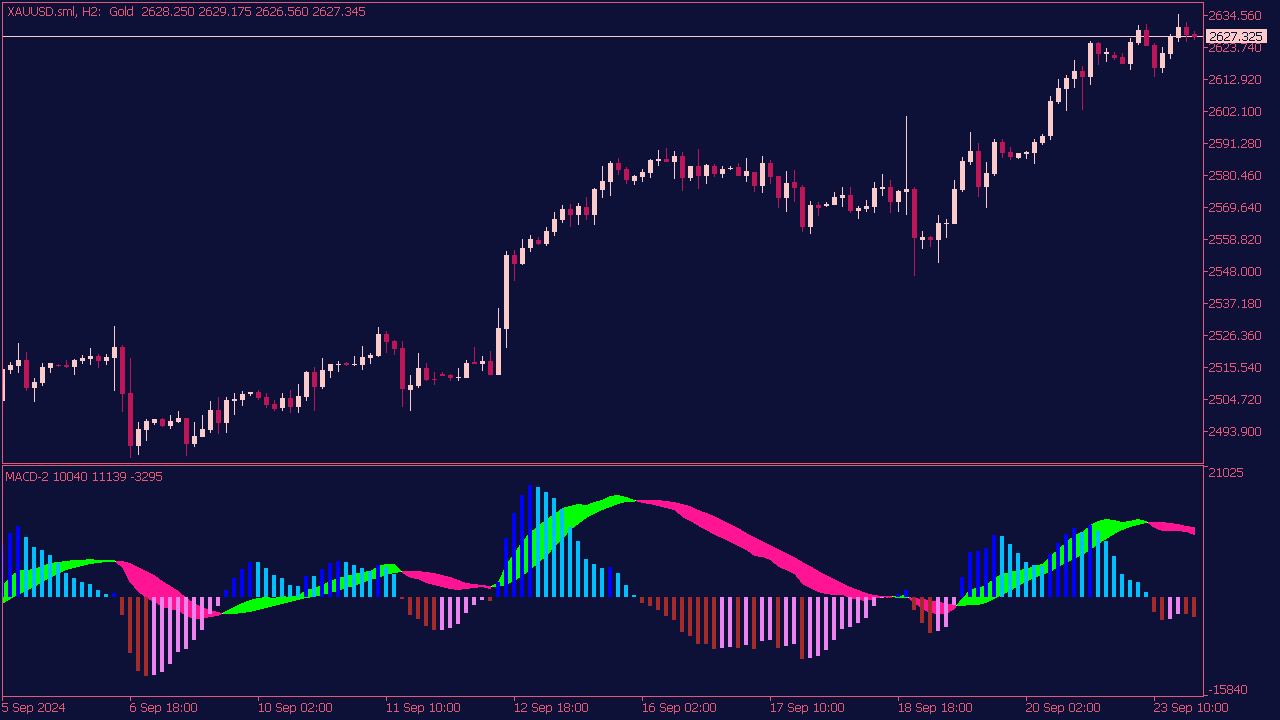
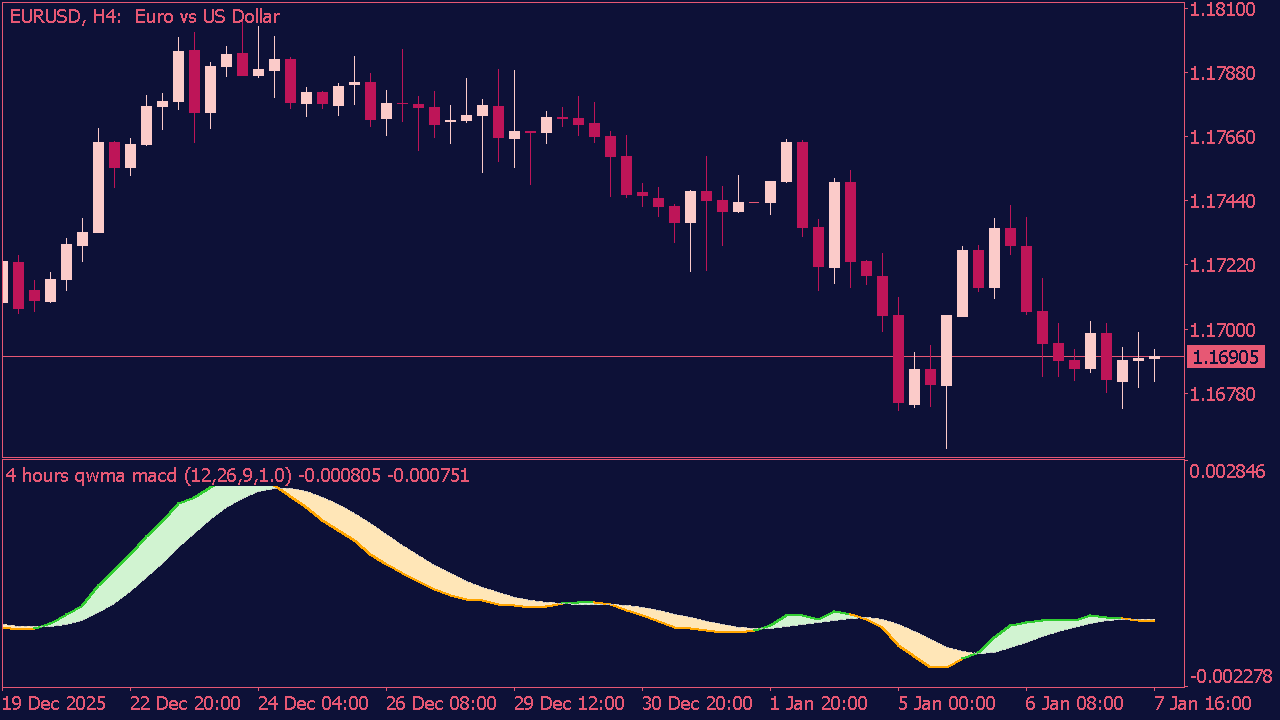
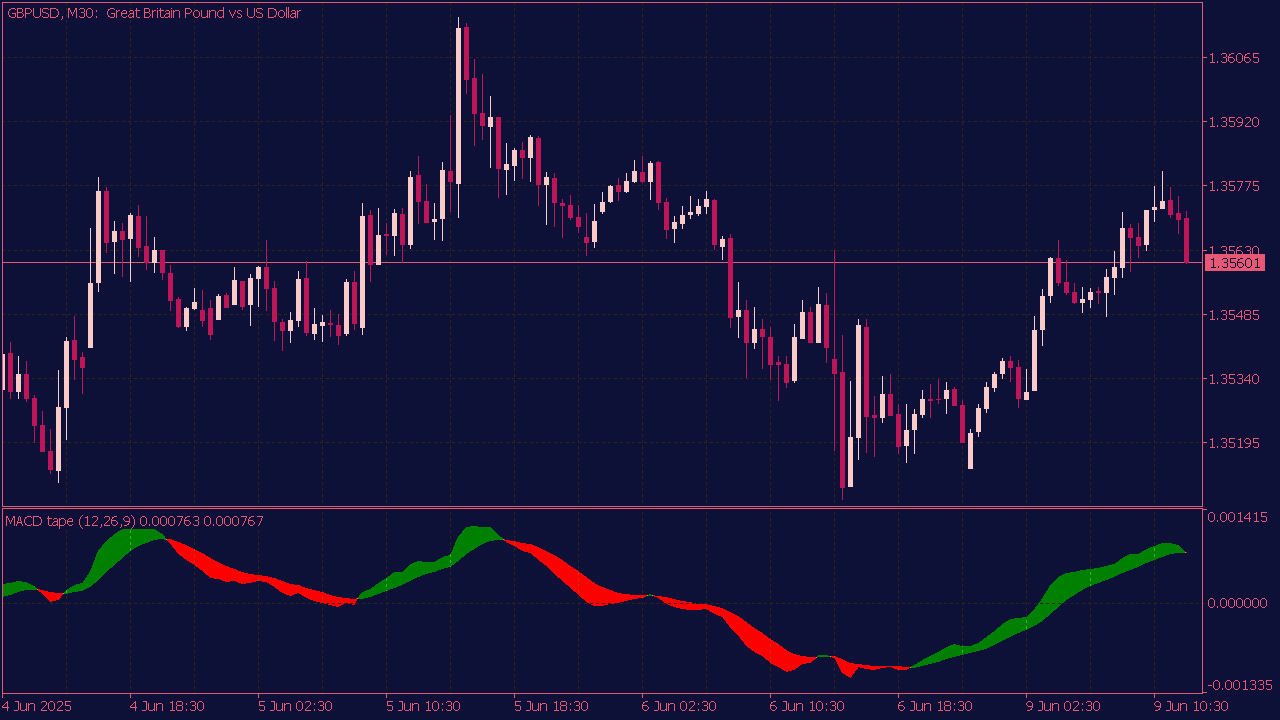
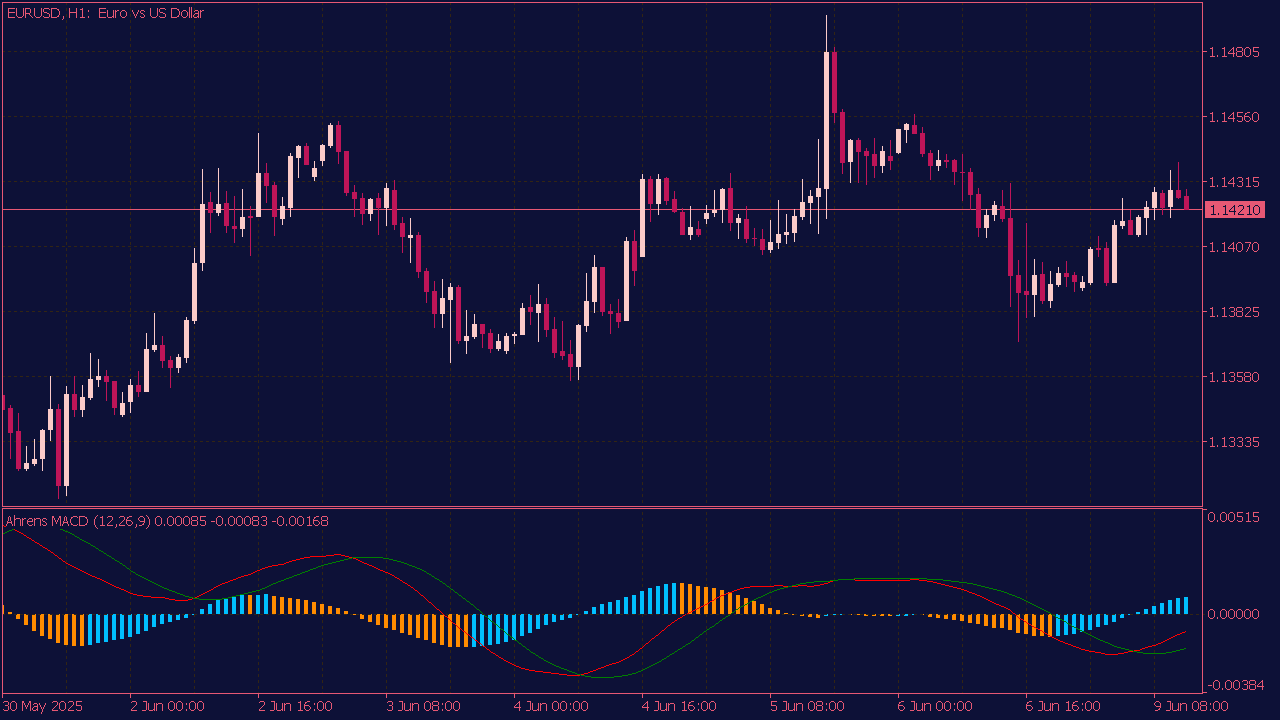
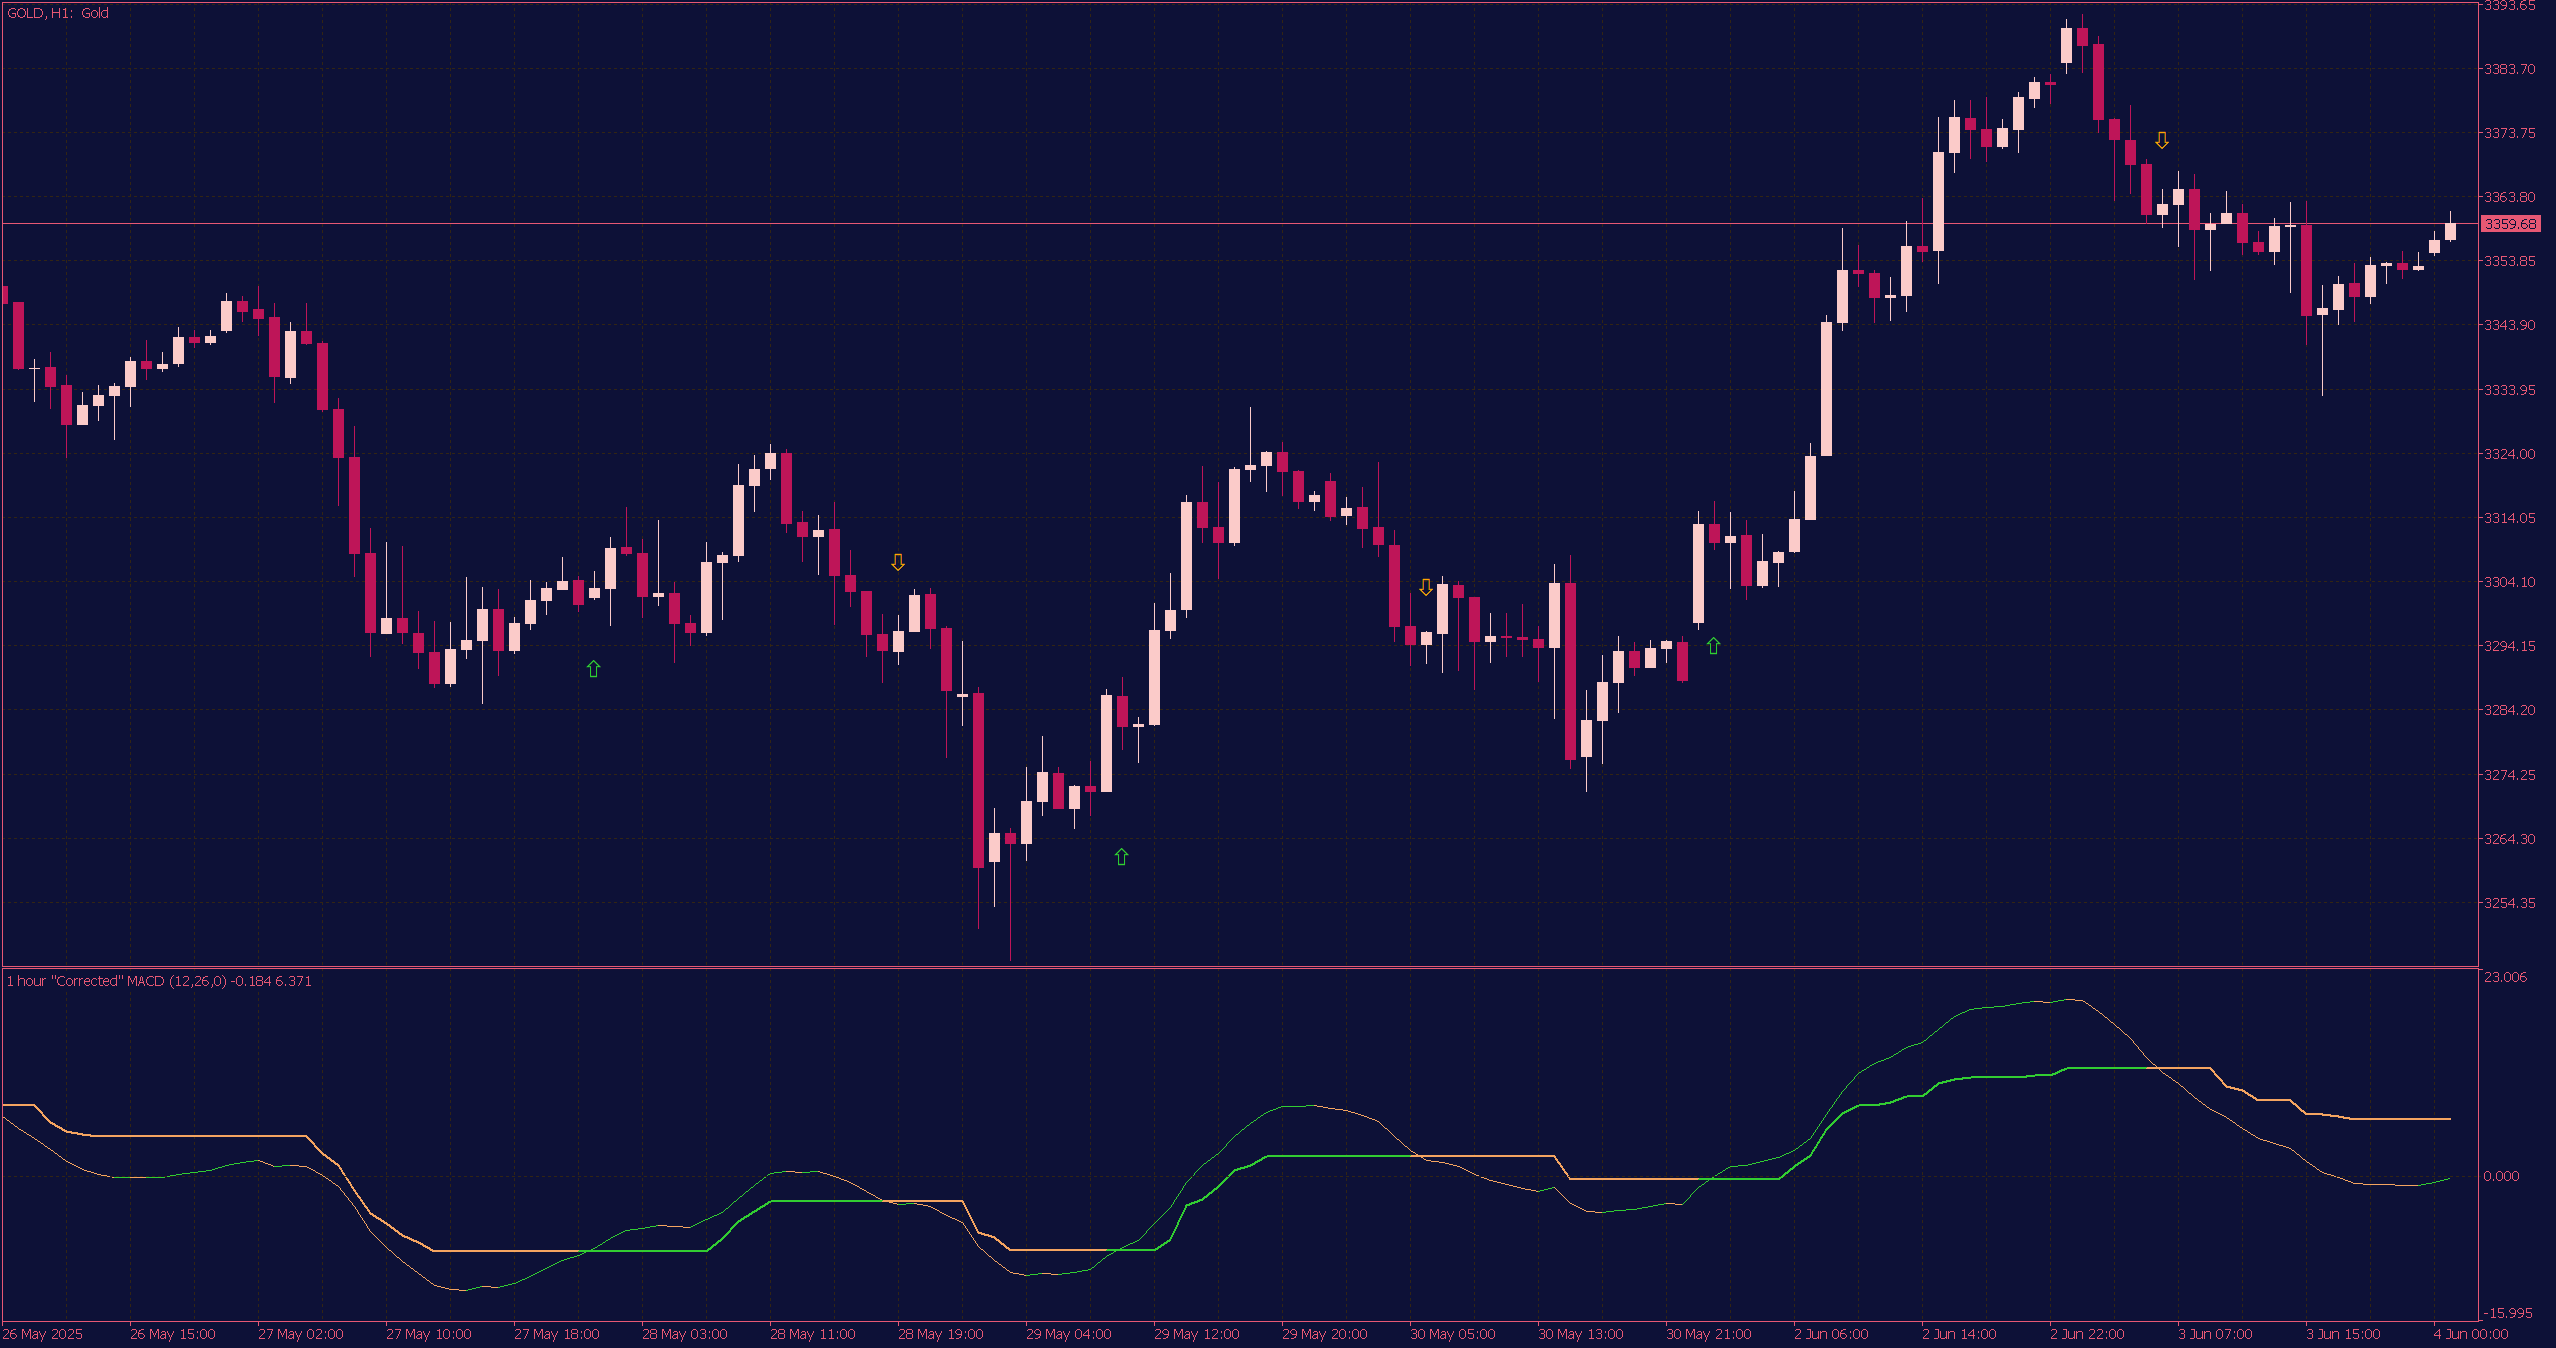
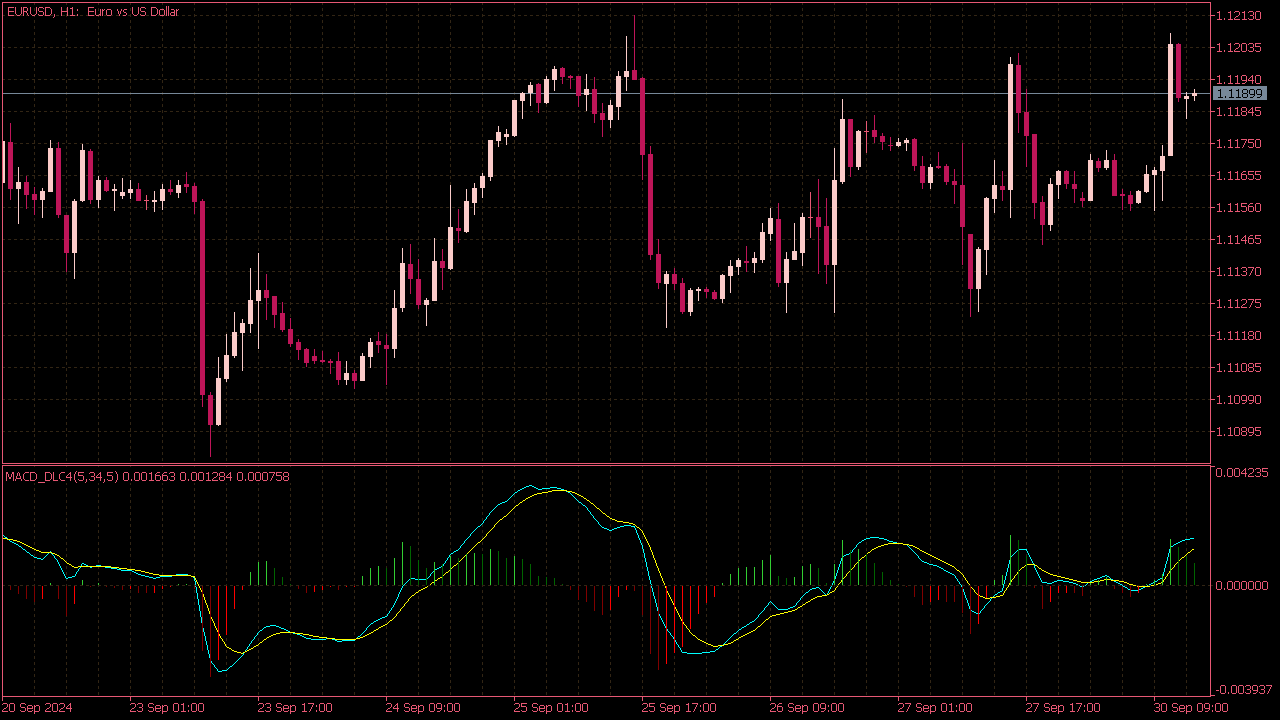
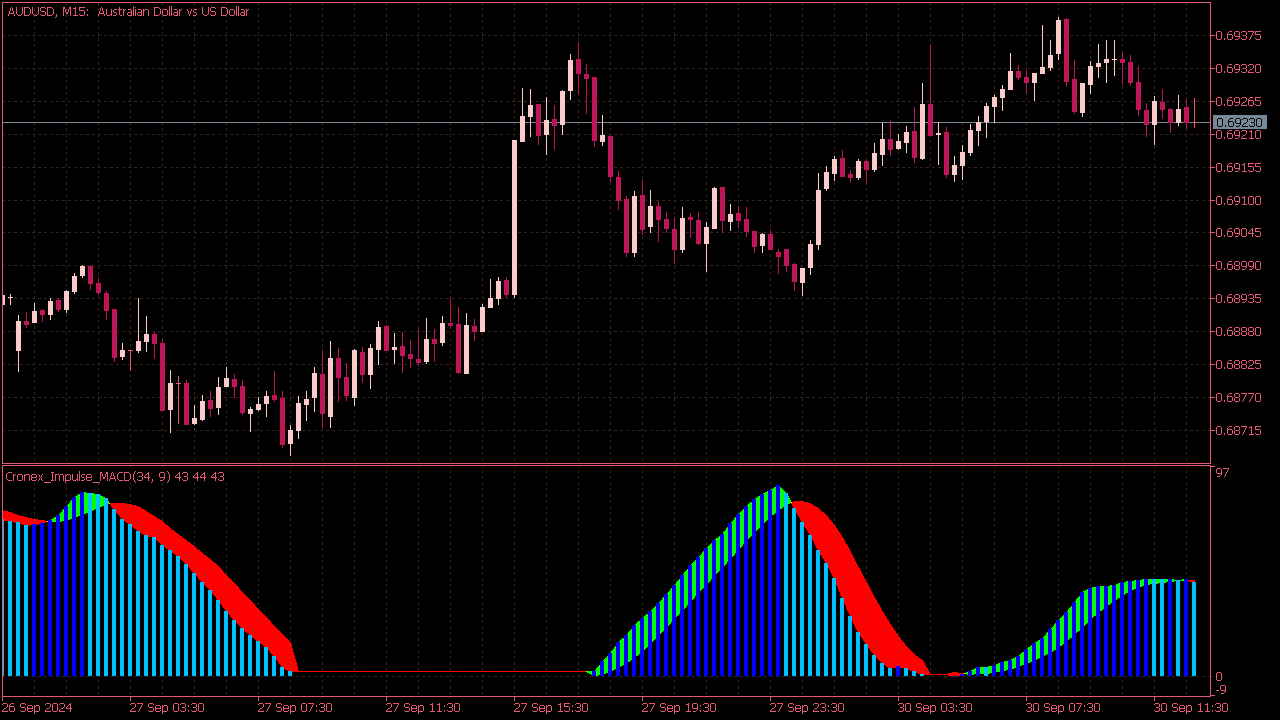
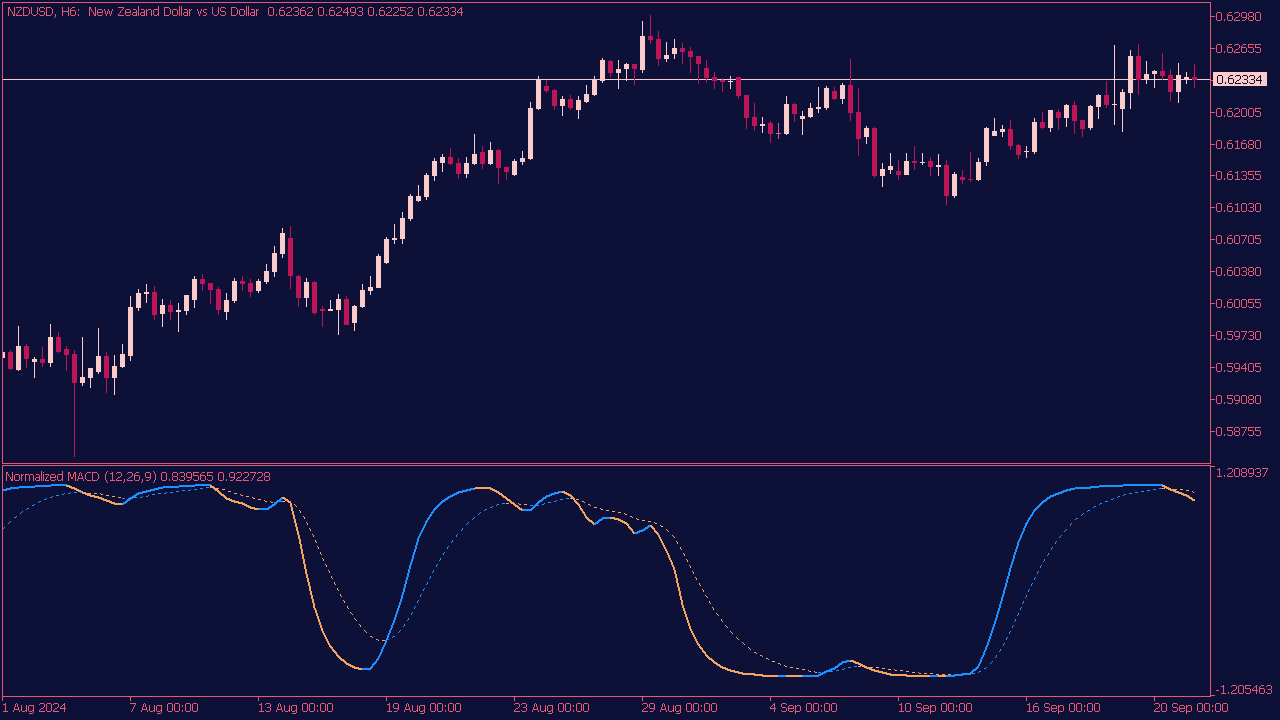
The MACD indicator consists of two lines: the MACD line and the signal line. A basic trading strategy involves using the crossover of these lines as signals to enter or exit trades. When the MACD line crosses above the signal line, it generates a bullish signal, suggesting a buy opportunity. Conversely, a crossover below the signal line indicates a bearish signal, suggesting a sell opportunity. Traders often confirm these signals with additional indicators or support and resistance levels to filter out false signals and improve the accuracy of their trades. Additionally, monitoring the MACD's histogram can provide insights into the strength of the momentum behind a trend.