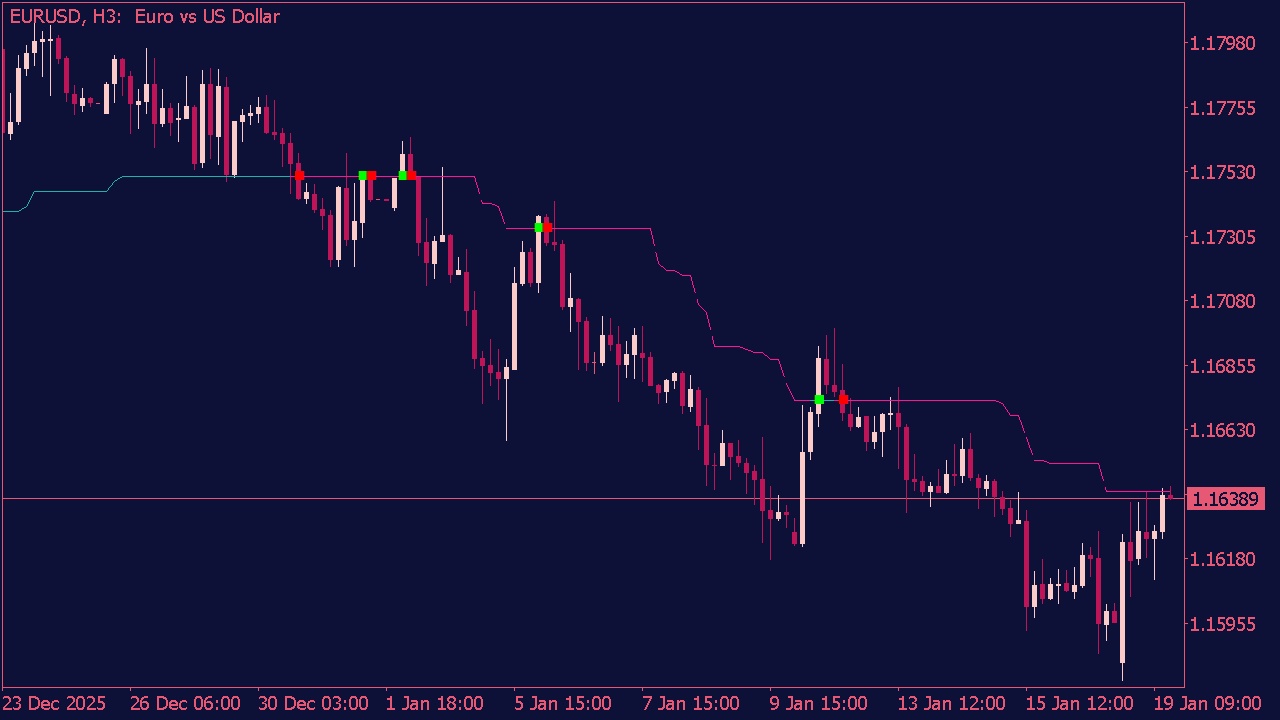
MT5 Super & Half Trend Indicators with Auto Trendlines

MT5 Super & Half Trend Indicators with Auto Trendlines

by Specialist ®️ -
Number of replies: 9

Auto Trendline Indicator

Auto Trendline Indicator for MT5

The Auto Trendline Indicator identifies key support and resistance levels by automatically drawing trendlines on a price chart based on price action. Entry points can be determined when the price interacts with these trendlines. A bullish entry might be signaled when the price bounces off a support trendline, indicating a potential upward movement. Conversely, a bearish entry could be suggested when the price tests a resistance trendline and shows signs of reversal. Additionally, confirming signals from other indicators (like RSI or MACD) can enhance the reliability of these entry points.

Trend Indicators for MT5

by Specialist ®️ -

SuperTrend Experiment Channel

SuperTrend Experiment Channel for MT5

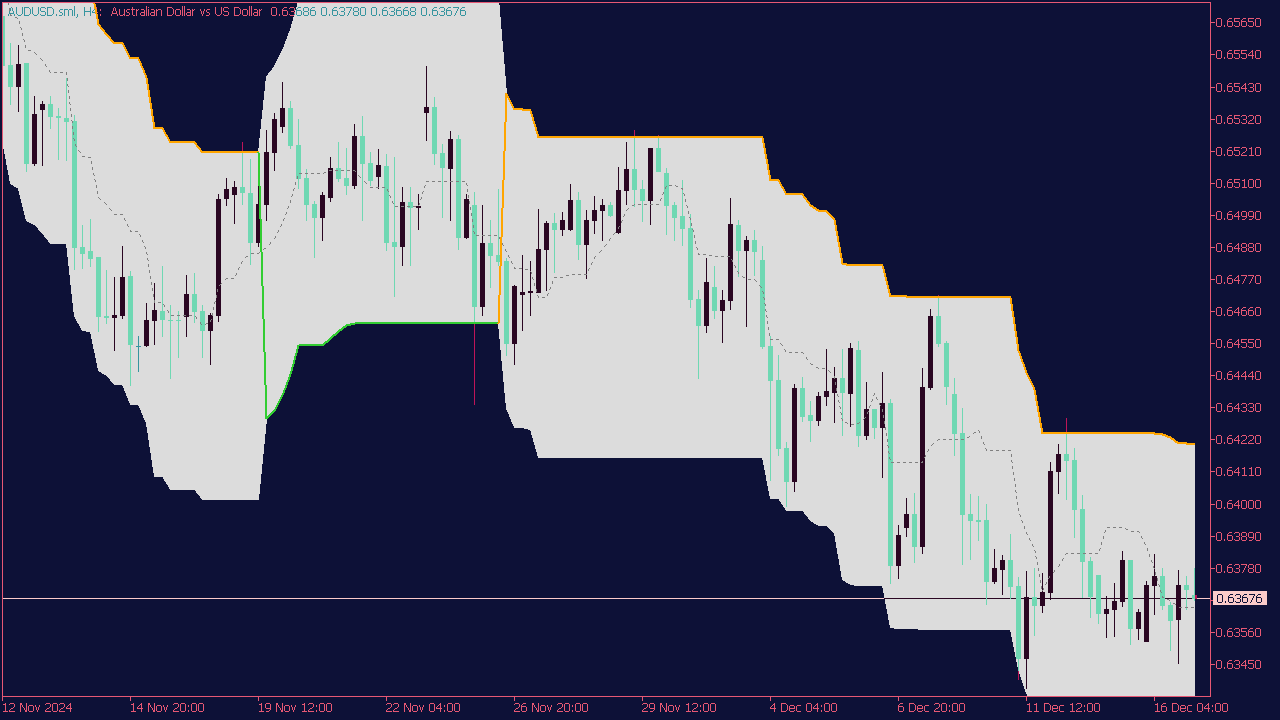
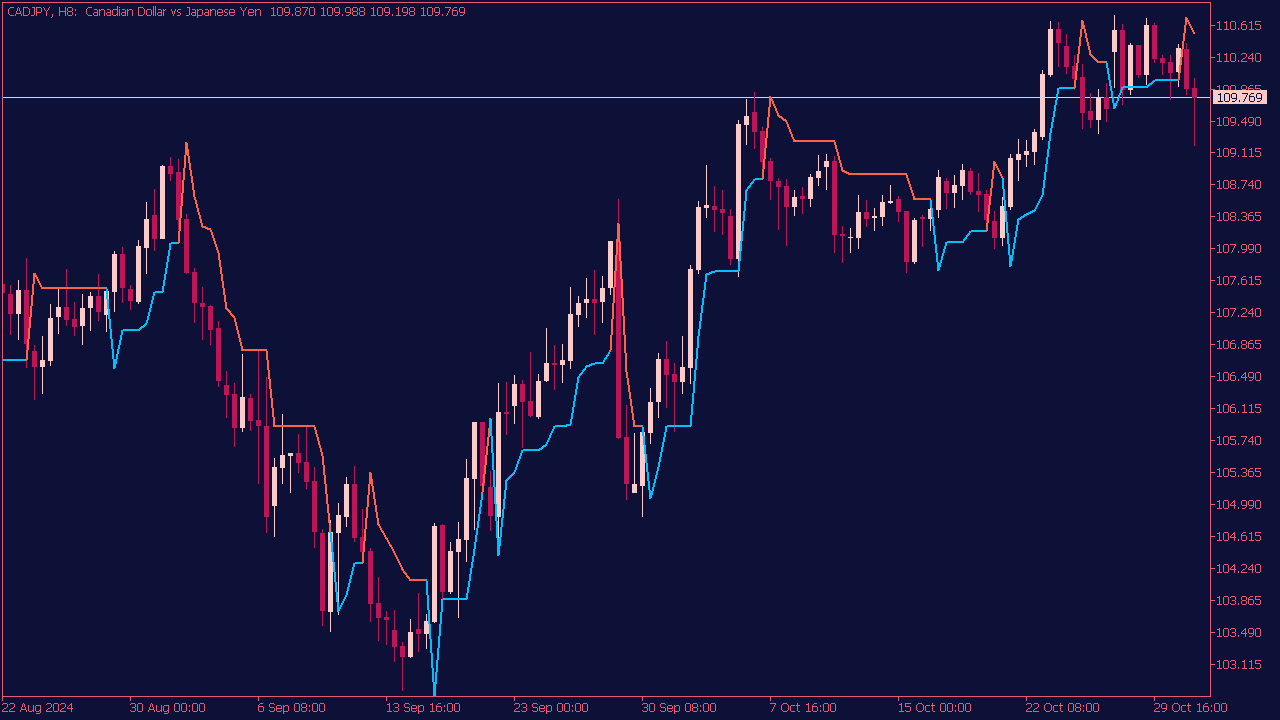
The SuperTrend Experiment Channel Indicator is a variation of the traditional SuperTrend indicator that combines trend detection with a channeling mechanism to visualize price movements more clearly. This indicator uses similar principles involving the average true range (ATR) to set the channel's boundaries, helping traders identify areas of potential support and resistance within the trend. By incorporating channels, the SuperTrend Experiment Channel Indicator aims to provide clearer signals for entry and exit points, making it easier for traders to visualize market conditions and adjust their strategies accordingly. It can be particularly useful in trending markets, offering insights into the strength and sustainability of price movements.

Trend Indicators for MT5

by Specialist ®️ -

Trend Following Indicator

Trend Following Indicator for MT5

When using trend-following indicators for trading, consider the following tips: First, identify the primary trend through moving averages, such as the 50-day or 200-day, to determine your bias. Next, combine trend indicators like the Average Directional Index (ADX) to assess trend strength, ensuring you only enter trades when the trend is strong enough. Use momentum indicators, such as the Relative Strength Index (RSI), to avoid overbought or oversold conditions. Set your entry points based on breakouts or pullbacks to key support or resistance levels, and always utilize stop-loss orders to manage risk. Finally, maintain a disciplined trading plan, adjusting your strategy as market conditions change.

Trend Indicators for MT5

by Specialist ®️ -

Super Trend Averages Indicator

Super Trend Averages Indicator for MT5

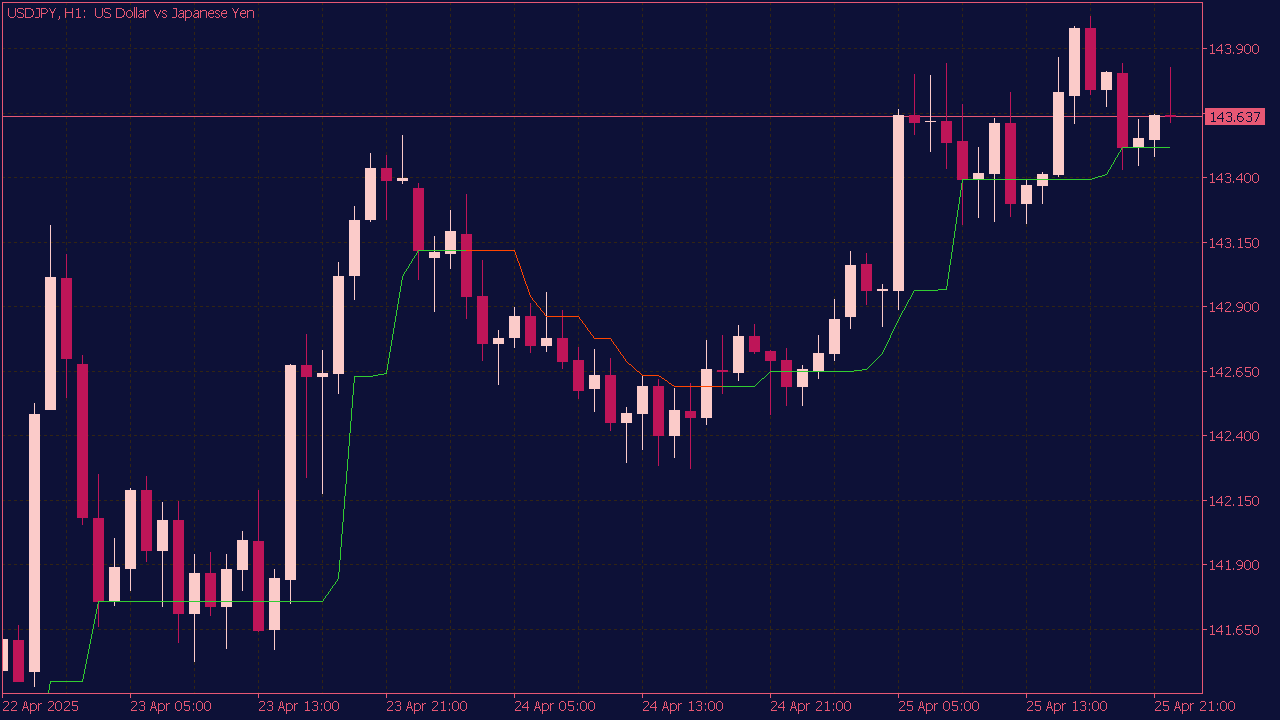
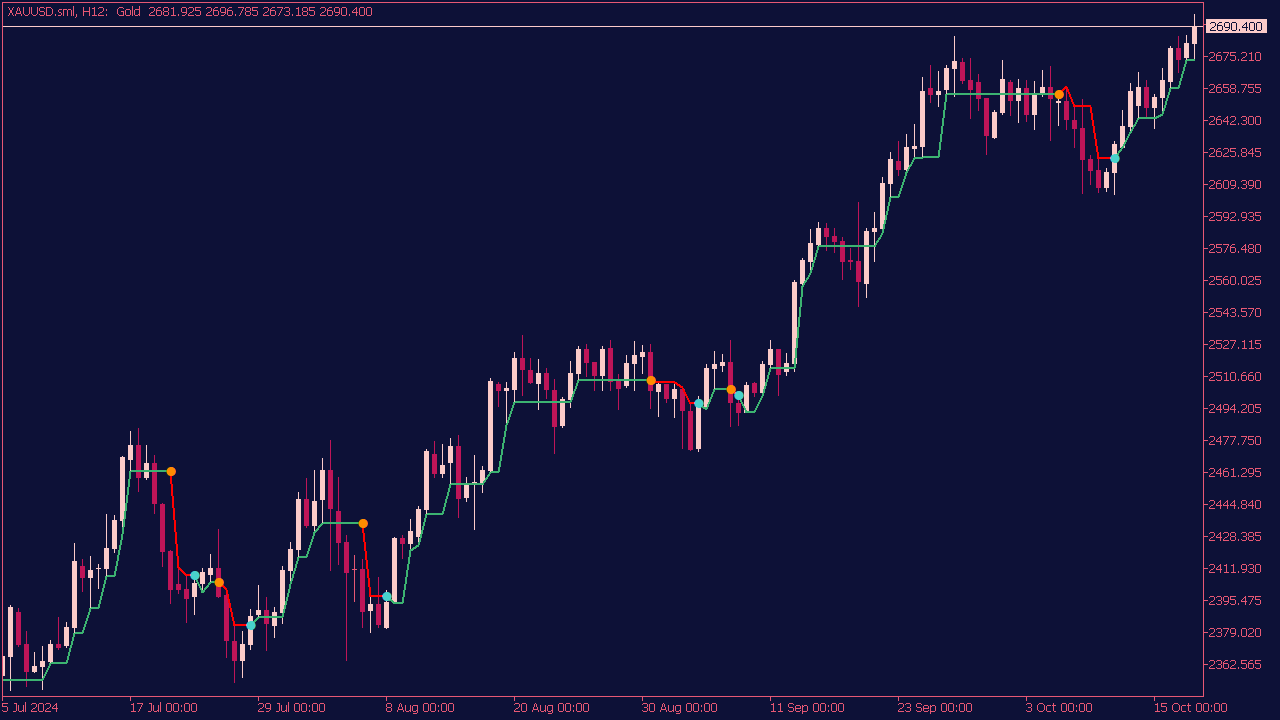
The Super Trend Averages Indicator is a trend-following tool that helps identify potential entry points in trading. When the indicator turns blue, it suggests taking a long position, indicating a bullish trend, while a red signal indicates a short entry, reflecting a bearish market. Traders often use additional confirmation from other indicators or price action to increase the reliability of these signals, ensuring they align with overall market conditions. For optimal results, consider using the Super Trend in conjunction with proper risk management and a defined trading strategy.

Trend Indicators for MT5

by Specialist ®️ -

Super Trend Indicator

Super Trend Indicator for MT5

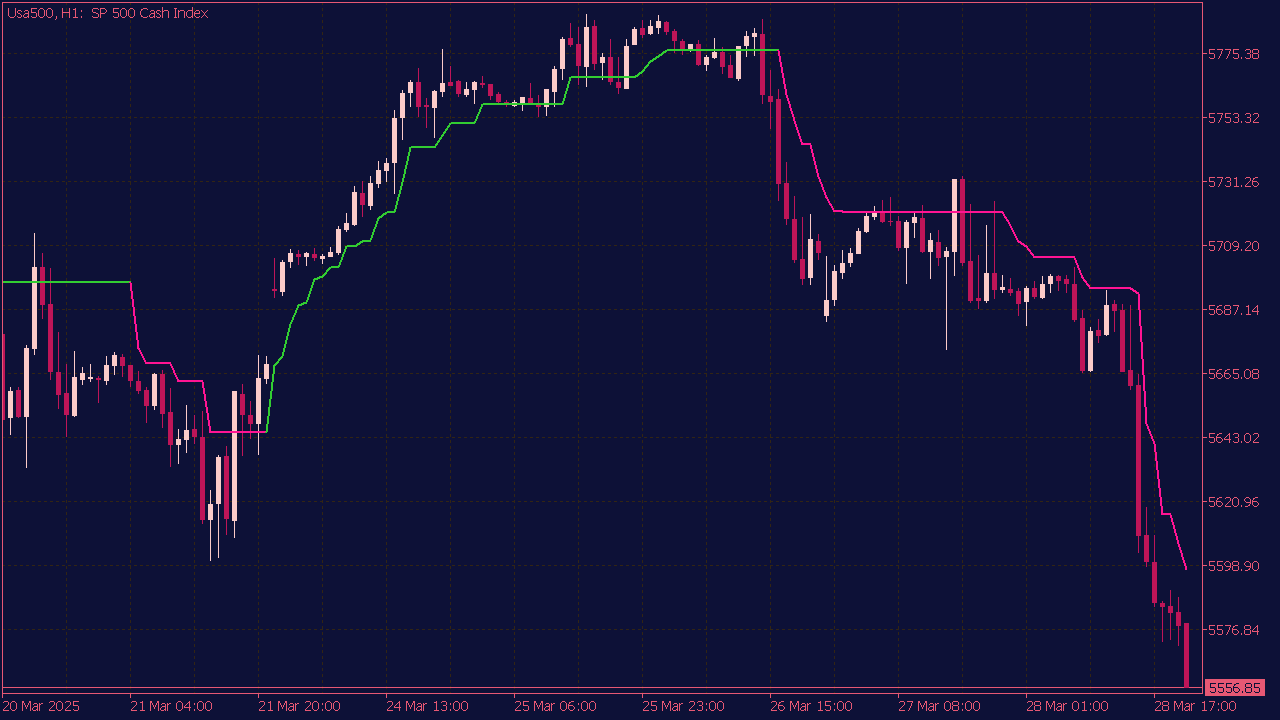
The Super Trend Indicator, a popular trading tool based on price action and volatility, helps traders identify potential buy and sell signals. A typical setup involves entering a long position when the price closes above the Super Trend line (indicating bullish momentum), with a stop-loss placed just below the Super Trend line. Conversely, a short position is initiated when the price closes below the Super Trend line, with a stop-loss above the line. Traders often combine this indicator with other tools, such as moving averages or RSI, to confirm signals and enhance accuracy in their trading strategies. Always consider market conditions and risk management practices in your trading approach.

Trend Indicators for MT5

by Specialist ®️ -

Perfect Trendline Indicator

Perfect Trendline Indicator for MT5

The Perfect Trendline Indicator helps traders identify key support and resistance levels, allowing for more informed decision-making. Here are some tips for using it effectively: Firstly, pay attention to the trend direction indicated by the trendlines; trade in the direction of the prevailing trend for higher success rates. Secondly, look for confluence with other technical indicators, such as moving averages or RSI, to confirm entry and exit points. Thirdly, use the indicator's signals in conjunction with proper risk management, setting stop losses just beyond the trendlines to minimize potential losses. Finally, practice on a demo account to familiarize yourself with the indicator's signals before trading with real money.

Trend Indicators for MT5

by Specialist ®️ -

Super Trend Hull Indicator

Super Trend Hull Indicator for MT5

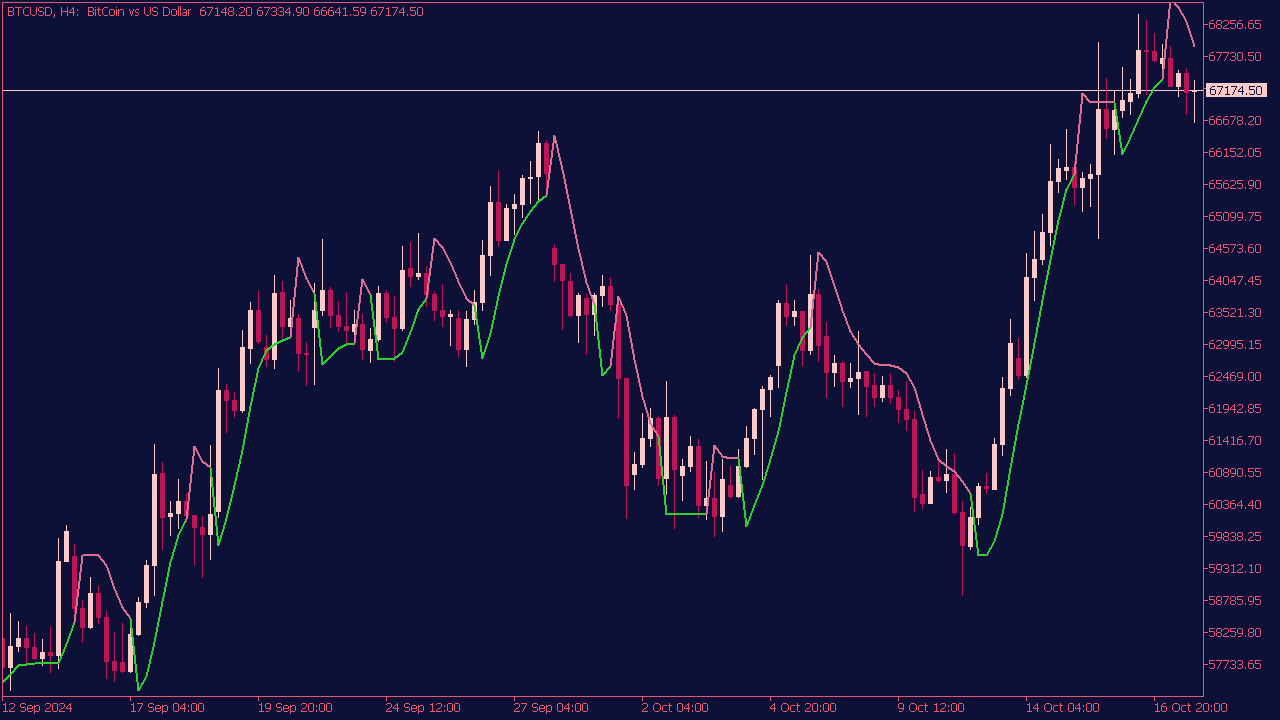
The Super Trend Hull Indicator combines the Super Trend indicator, which identifies the market's trending direction, and the Hull Moving Average (HMA), known for its ability to minimize lag and enhance responsiveness. Buy signals are often generated when the price crosses above the Super Trend line, typically indicating a potential uptrend, while sell signals occur when the price falls below the Super Trend line, signaling a possible downtrend. Traders often confirm these signals with additional analysis or indicators to enhance decision-making and reduce false signals.

Trend Indicators for MT5

by Specialist ®️ -

Trend Flex Indicator

Trend Flex Indicator for MT5

The Trend Flex Indicator is a technical analysis tool used in trading to signal potential entries based on market trends. The blue color typically indicates a bullish trend, suggesting traders consider buying or going long, while the red color signals a bearish trend, prompting traders to sell or go short. Traders often look for confirmation through other indicators or price action before making entry decisions to enhance the reliability of the signals provided by the Trend Flex Indicator.

Trend Indicators for MT5

by Specialist ®️ -

Super Trend Extended Indicator

Super Trend Extended Indicator for MT5

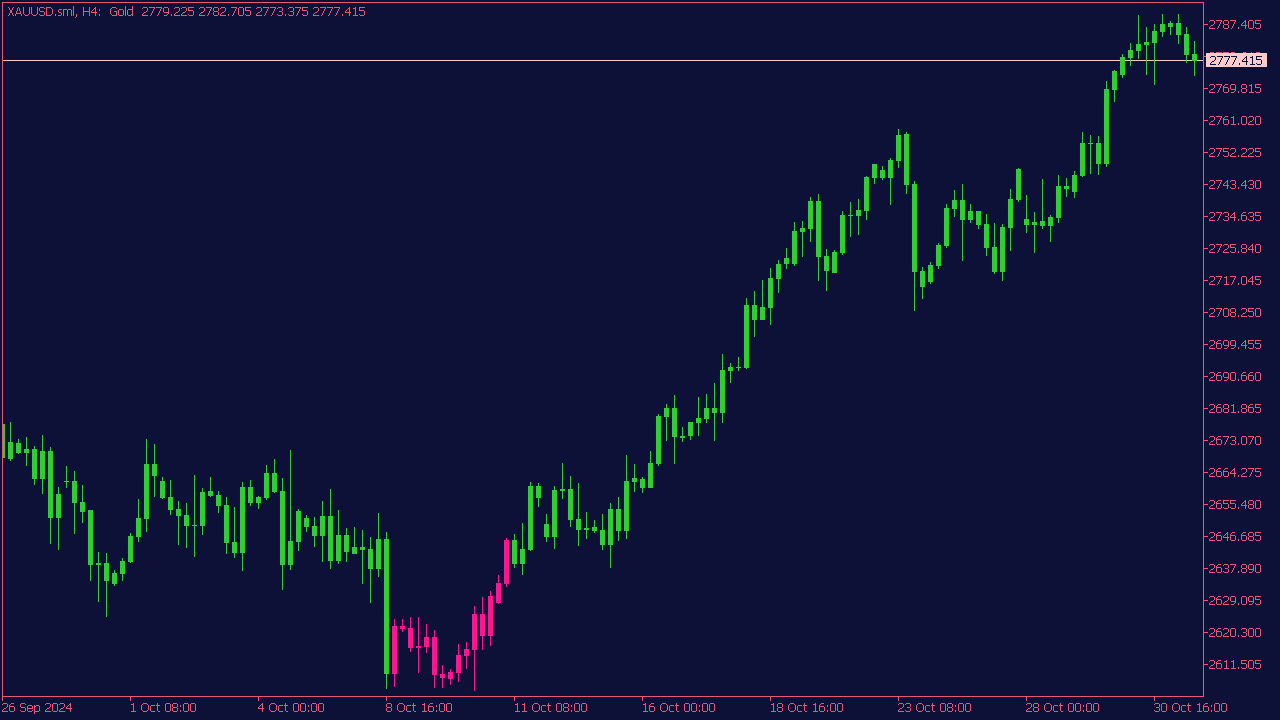
The Super Trend Extended Indicator is a popular tool used in trading to identify potential entry and exit points based on market trends. It generates buy and sell signals through colored candles, where typically a green candle indicates a bullish trend (buy signal) and a red candle indicates a bearish trend (sell signal). Traders often look for confirmation from other indicators or price action to minimize false signals. When using this indicator, consider incorporating risk management techniques and backtesting strategies to enhance accuracy and effectiveness in real market conditions.

Trend Indicators for MT5

by Specialist ®️ -

Gann Multi Trend Indicator

Gann Multi Trend Indicator for MT5

The Gann Multi Trend Indicator is a tool used in technical analysis, based on the principles developed by W.D. Gann. It helps traders identify potential long and short trading opportunities by analyzing price trends and patterns over various timeframes. The indicator typically utilizes support and resistance levels, along with Gann angles, to provide signals: a long position may be suggested when the price is above certain moving averages or Gann lines, while a short position may be indicated when the price falls below them. Traders often incorporate this indicator with other analysis techniques to enhance decision-making.