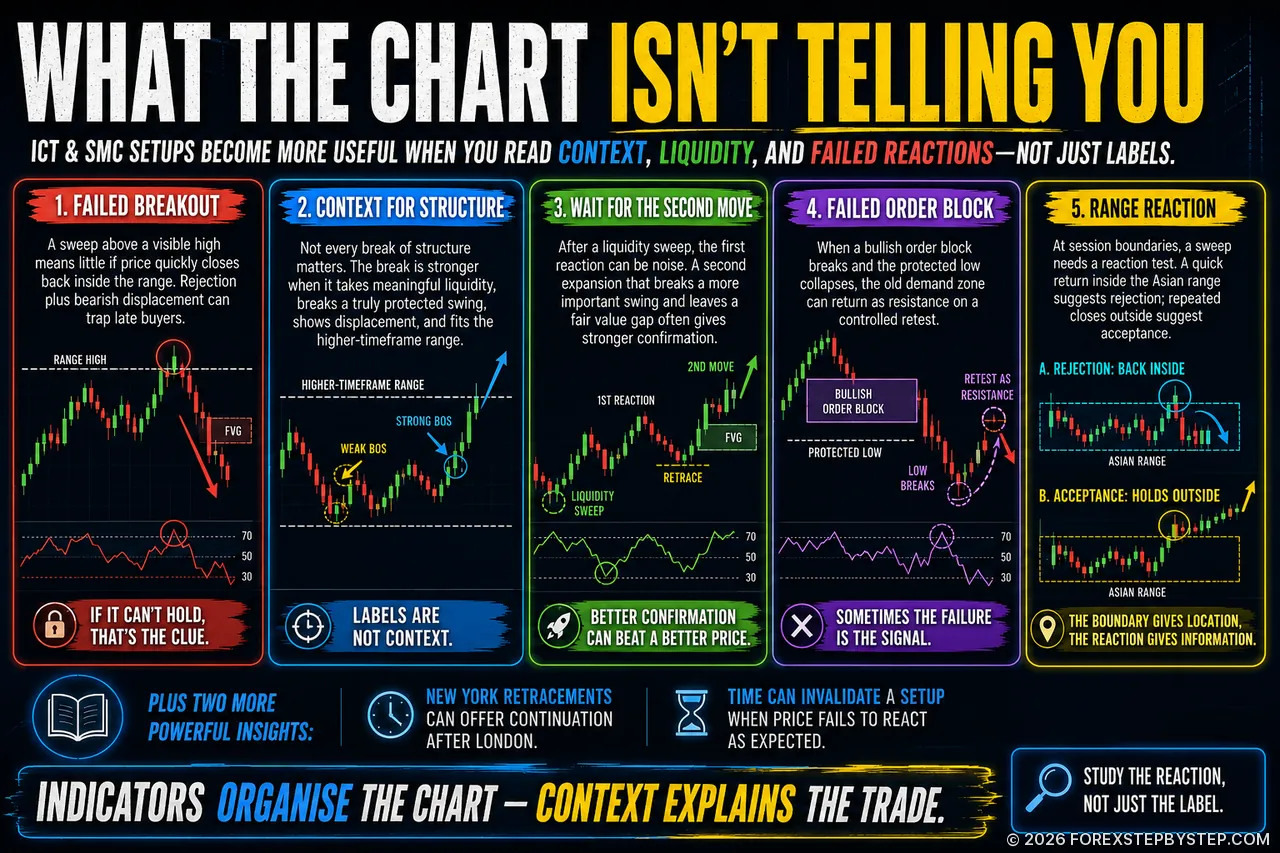
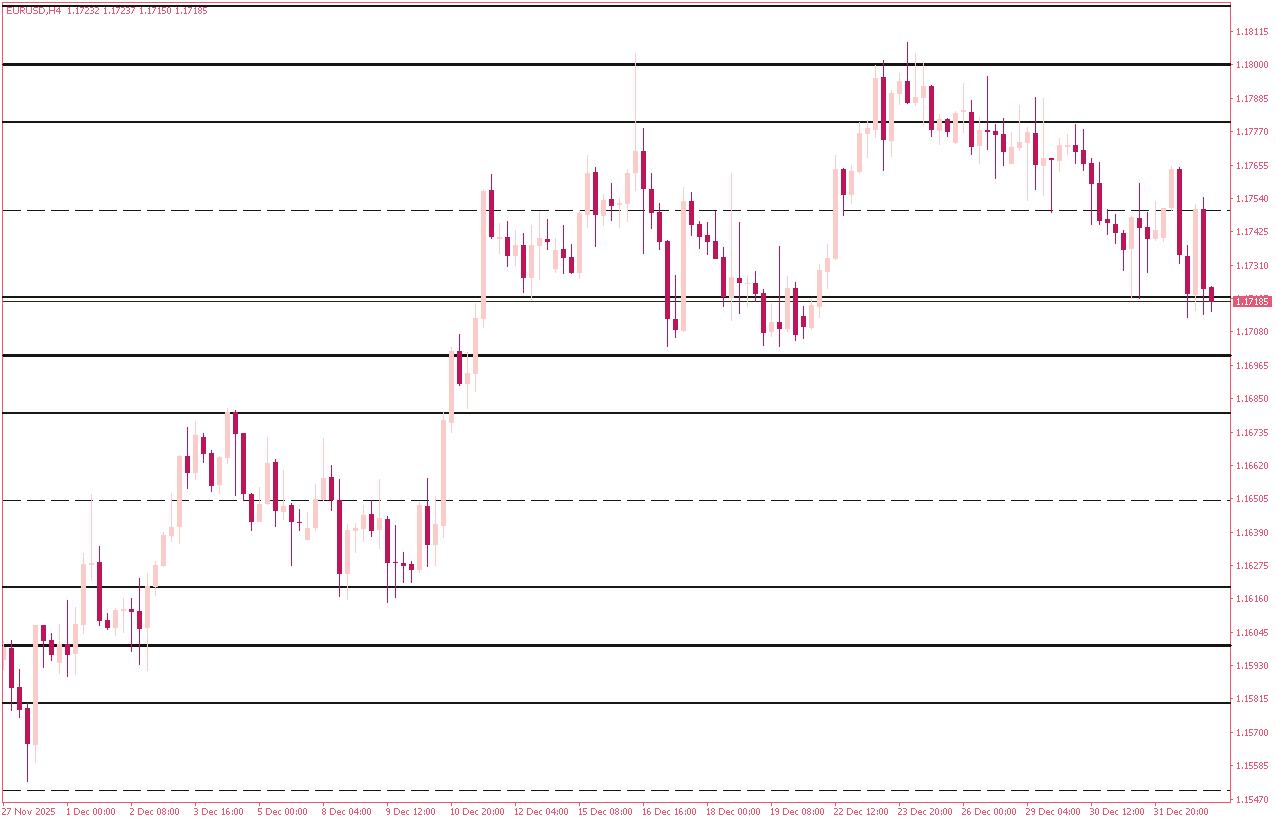
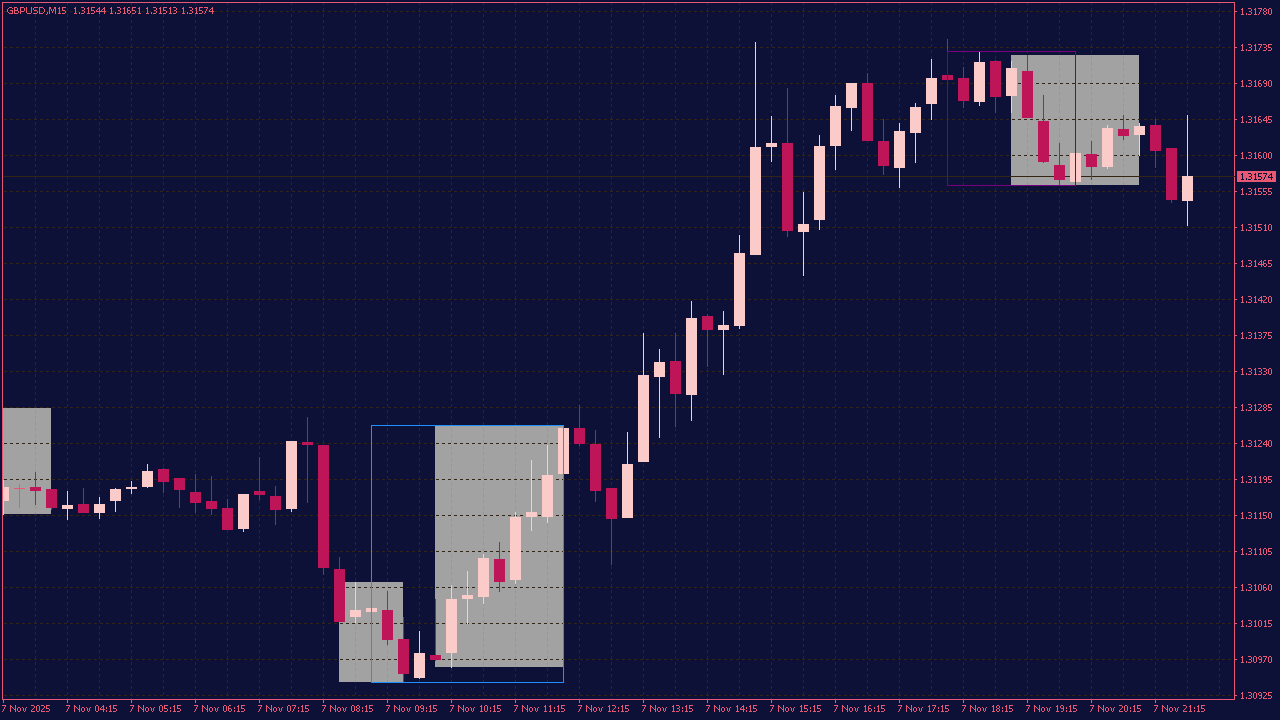
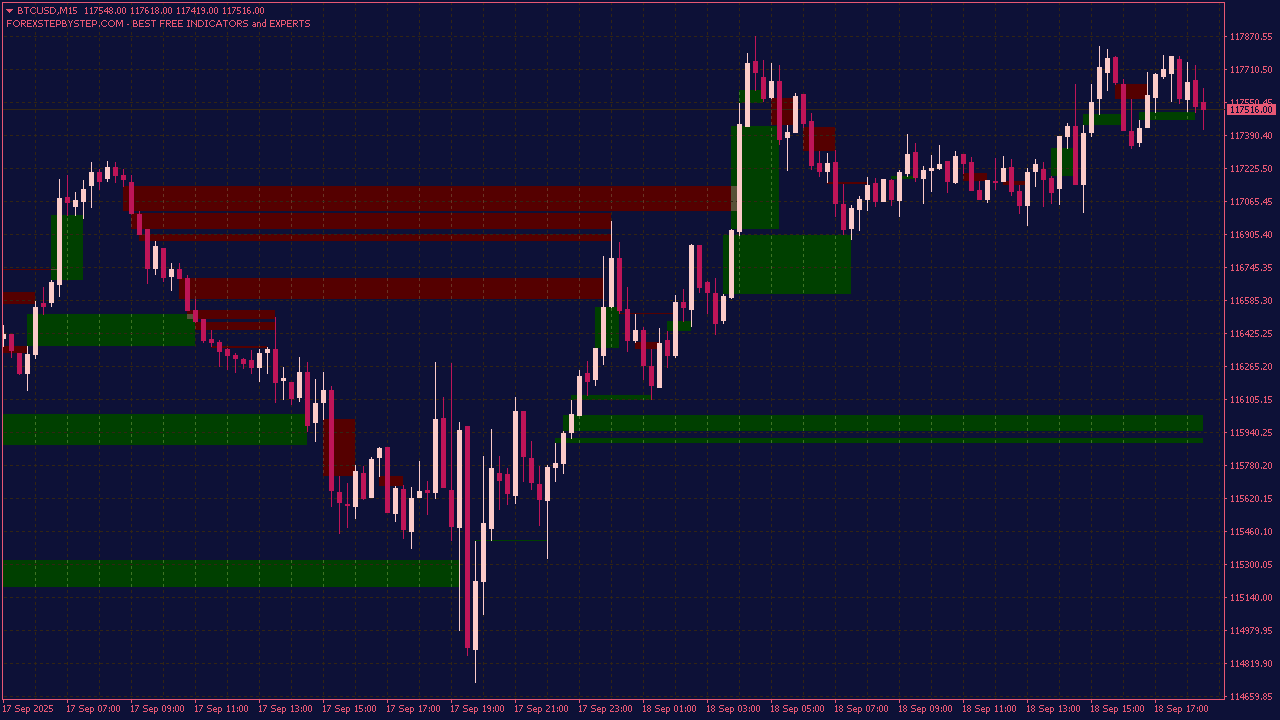
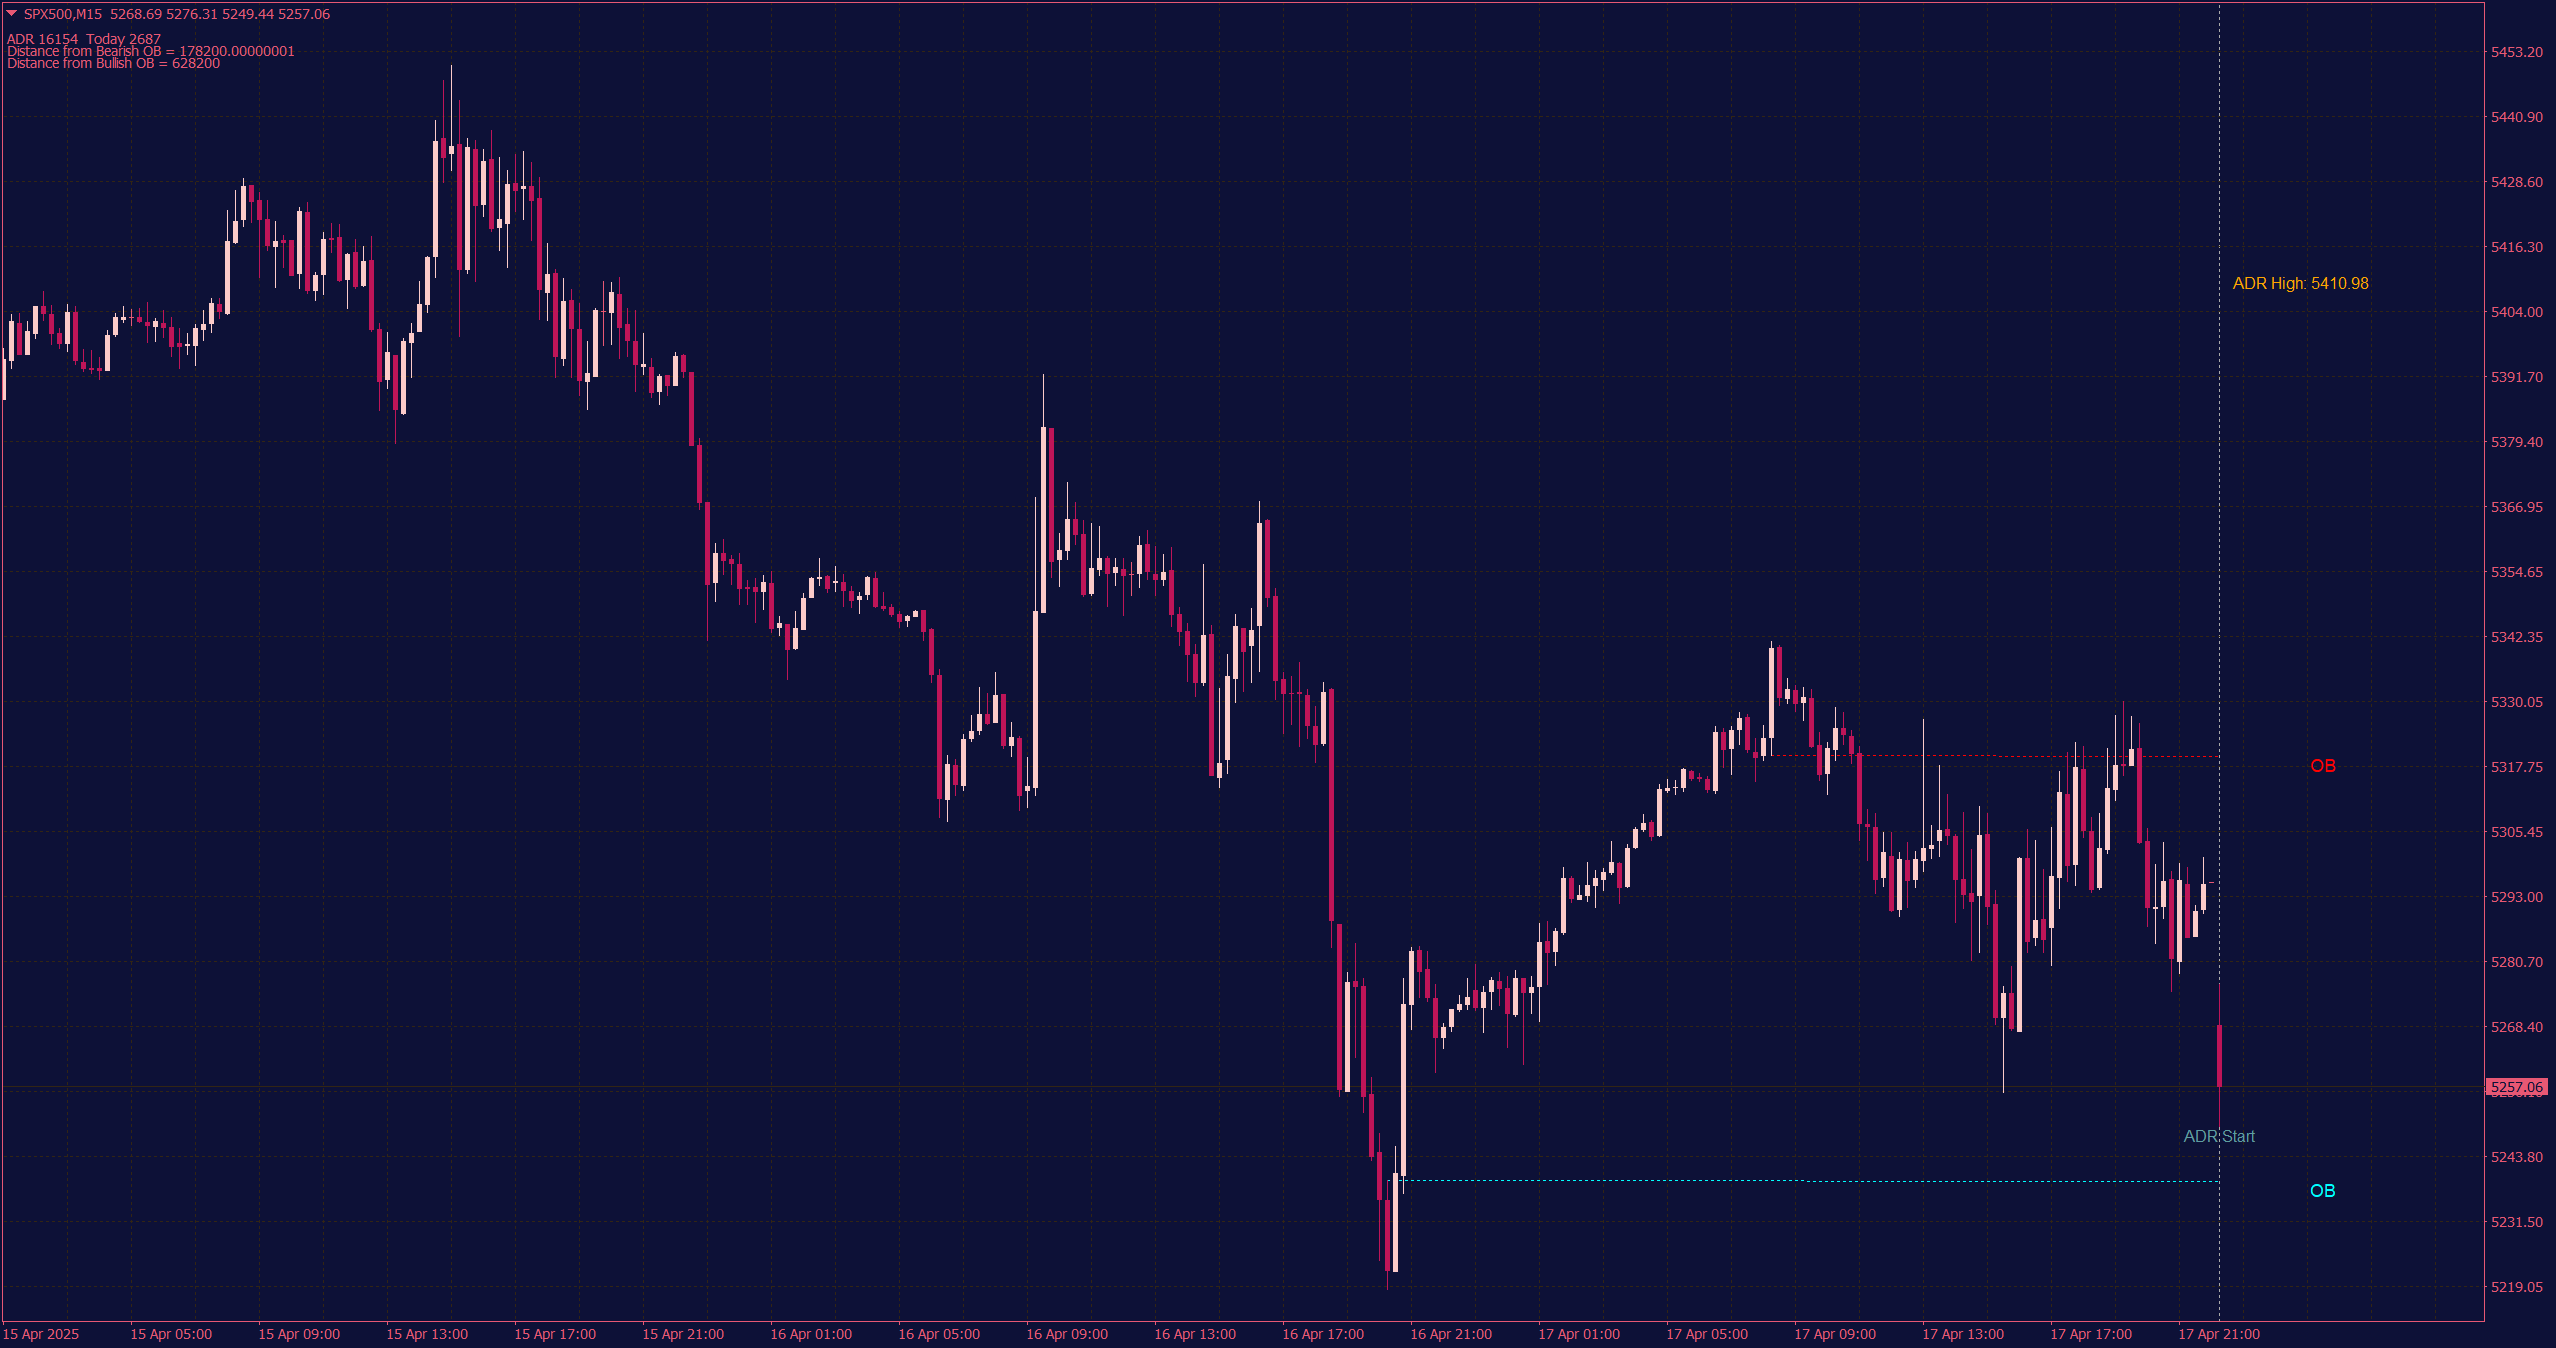
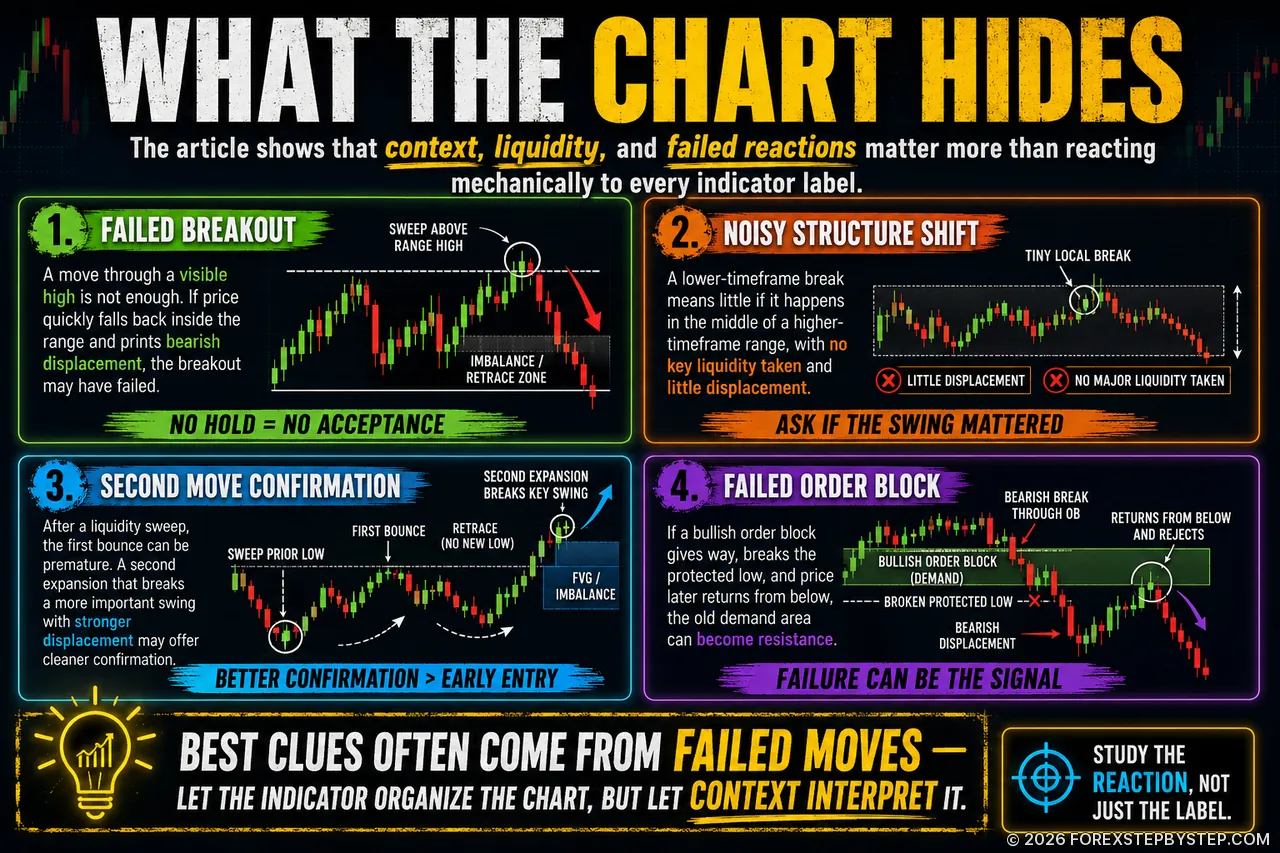
Five familiar setups appear on the chart. The real clue begins when price refuses to behave as expected.
🔍 When the Obvious Setup Stops Making Sense
Most traders eventually learn to recognize order blocks, liquidity sweeps, fair value gaps, and structure shifts. The harder part is knowing when those familiar signals are no longer telling the full story.
A breakout clears a major high and then falls straight back. An order block that looked textbook suddenly gives way. A structure shift appears, but the expected continuation never follows. These moments are often written off as failed setups, even though the failure itself can be useful information.
In the full article, we examine eight ICT and SMC situations where context matters more than the label on the chart. We look at failed levels, session behavior, questionable entries, liquidity, and even the role of time in invalidating a trade.
Sometimes the most useful clue is not the signal that appeared. It is what price failed to do afterward.
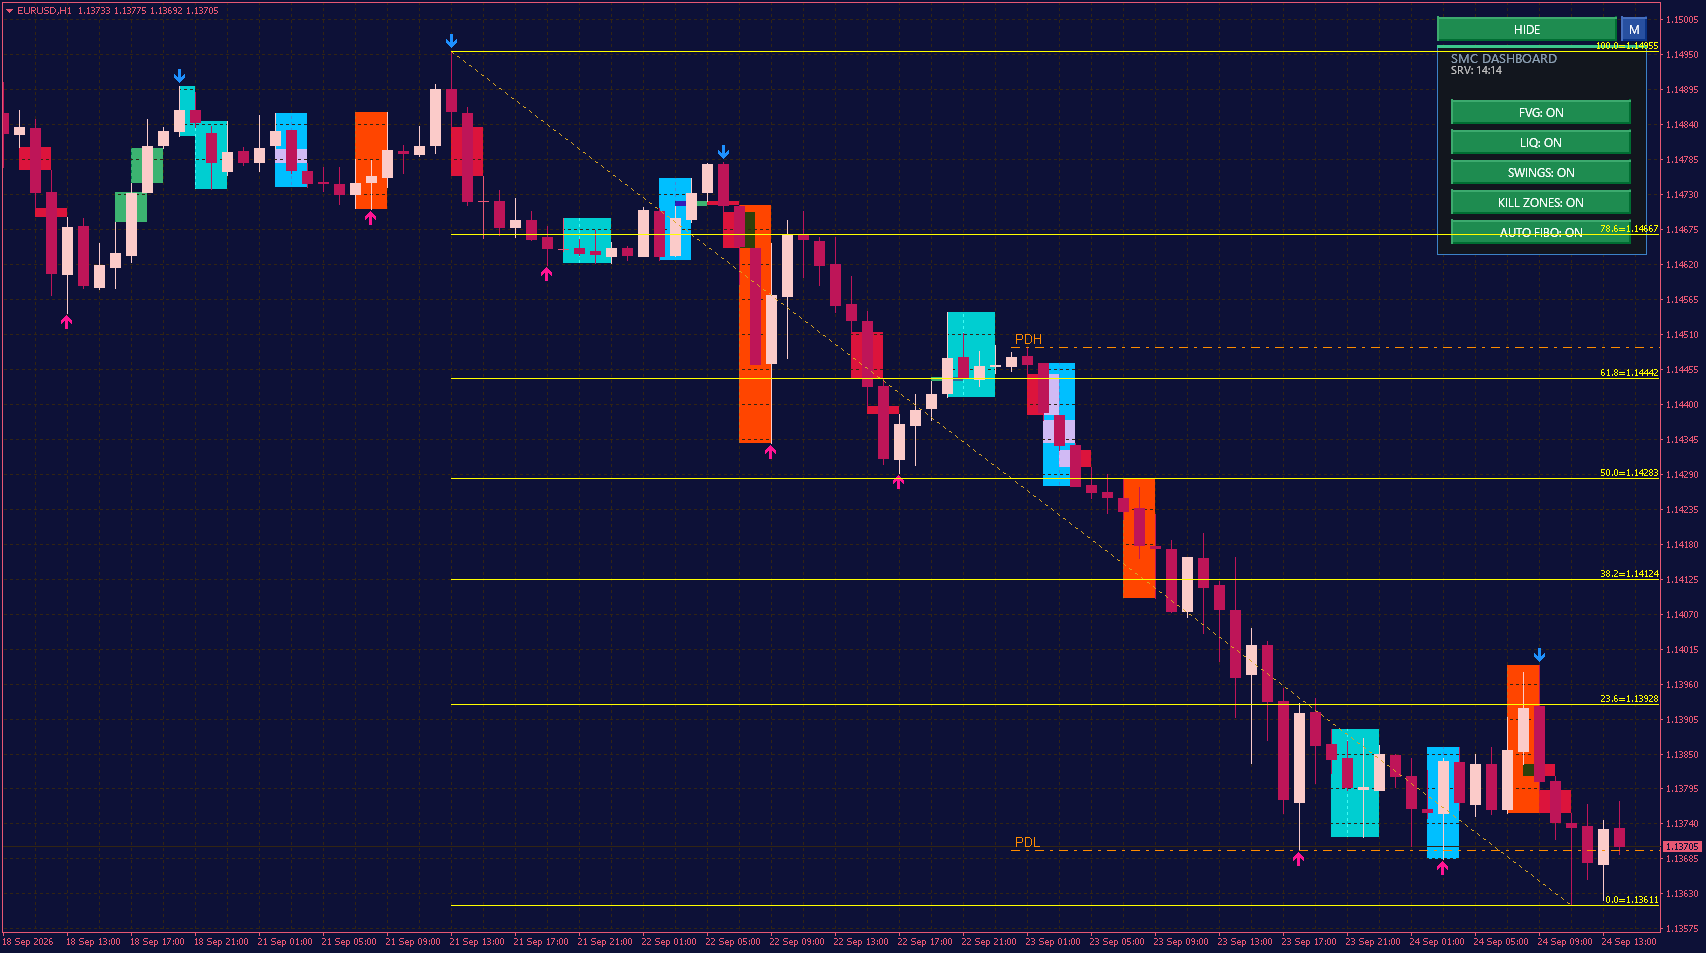
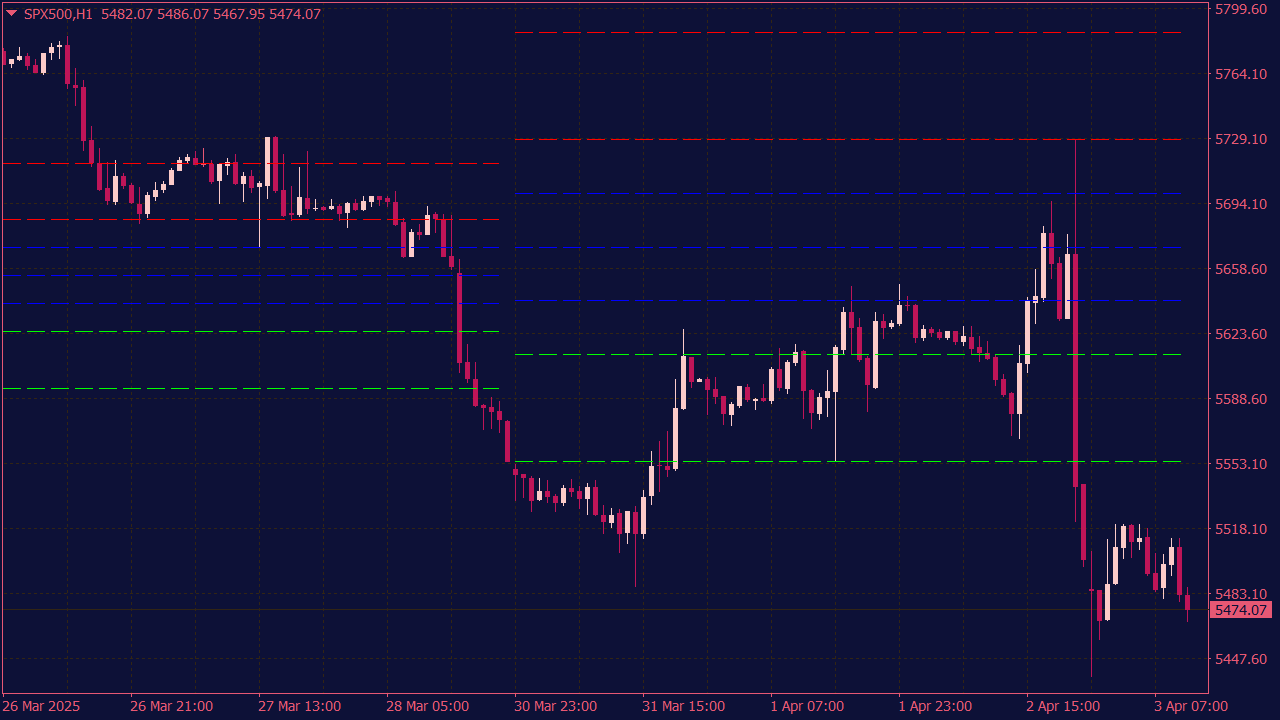
Pro Indicator for Swings, FVG, Liquidity & Kill Zones
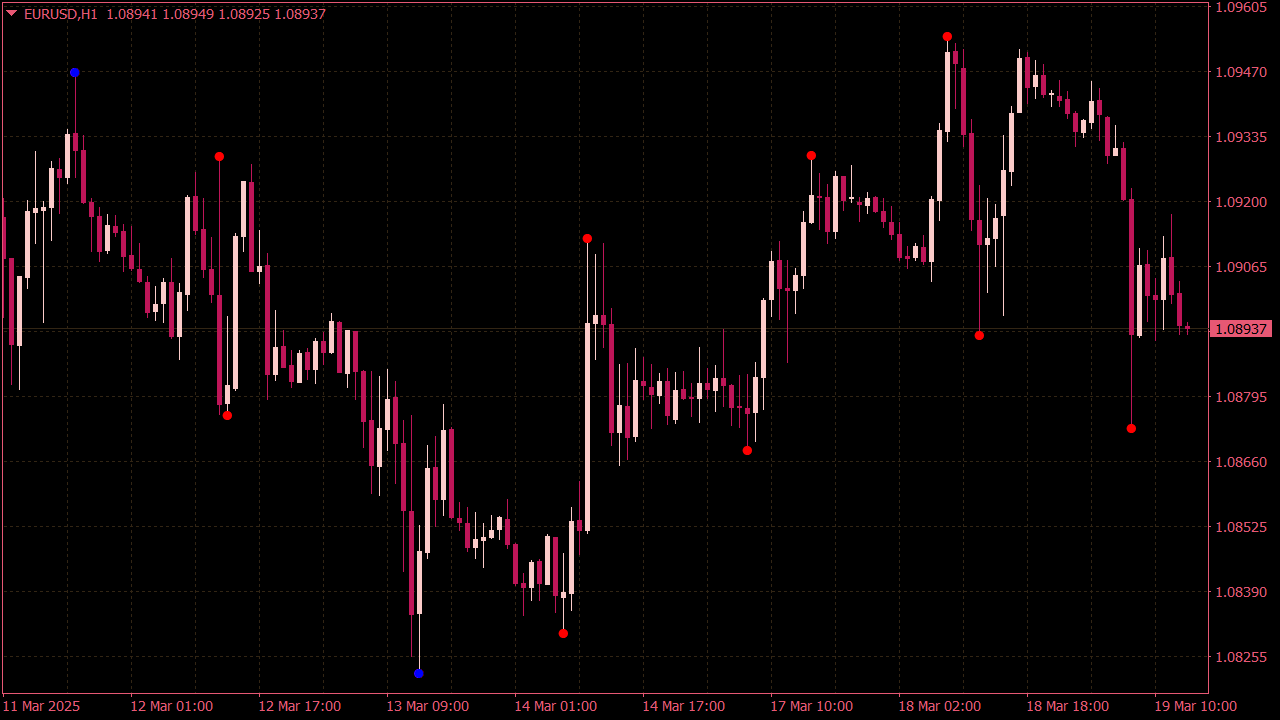
The Pro Indicator for Swings, FVG, Liquidity & Kill Zones combines several important market structure tools in one clean and practical indicator. It highlights Fair Value Gaps, liquidity levels, swing highs and lows, Kill Zones, and Fibonacci levels directly on your chart, helping you keep different concepts visible without loading multiple separate indicators. One of the most useful aspects is seeing when several elements appear in the same area. A liquidity level may sit close to a Fair Value Gap while an important trading session is approaching. These overlaps can help you identify areas that deserve closer attention. The built-in dashboard gives you full control over what is displayed. Each feature can be switched on or off individually, allowing you to keep the chart simple and focused on the information that matters to you. Designed specifically for MetaTrader 4, the indicator provides a clear visual overview of market structure while keeping the chart organized and easy to read.
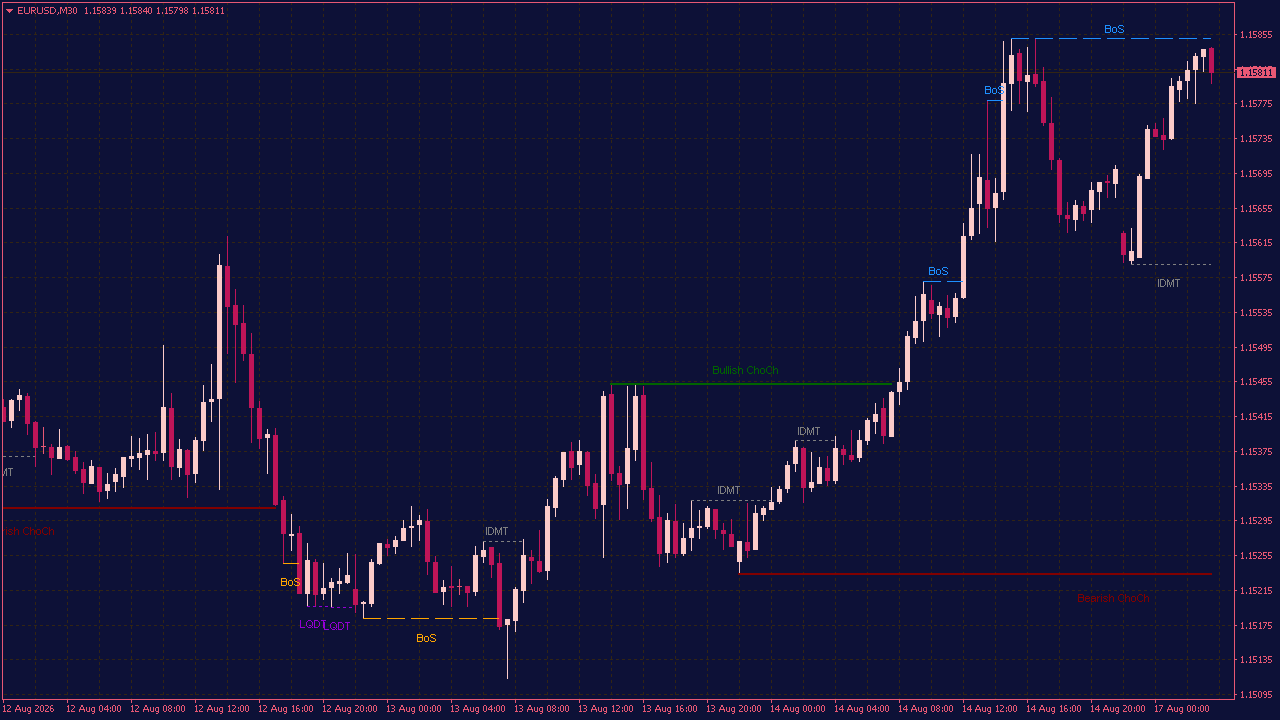
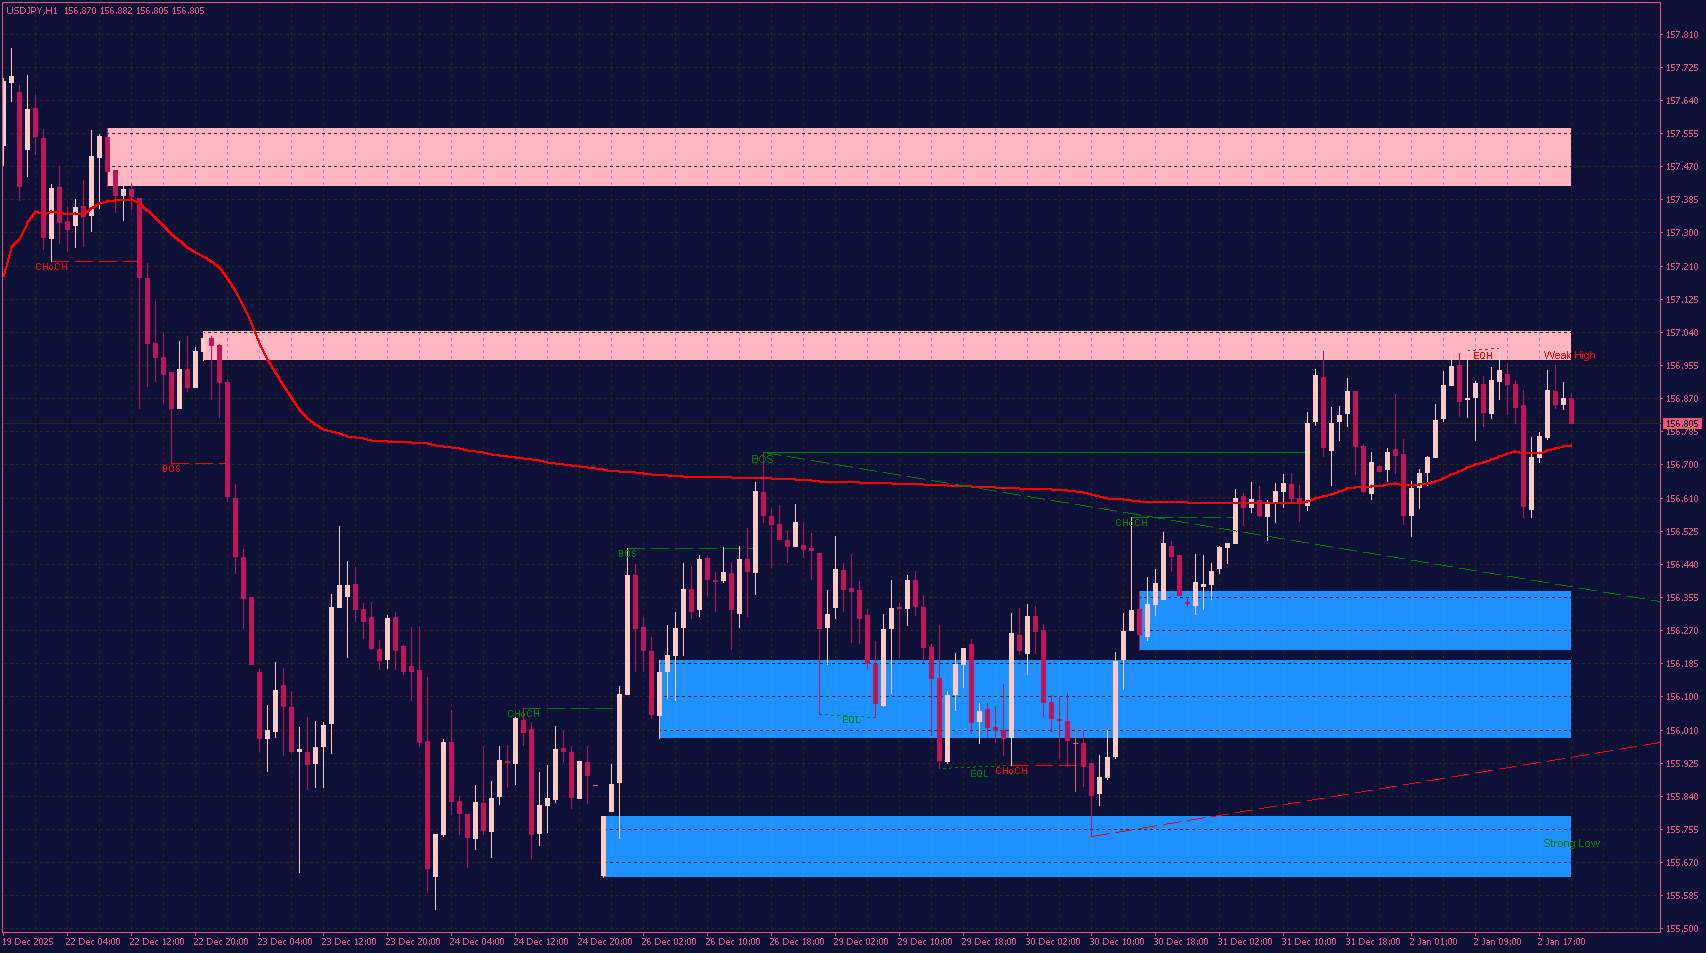
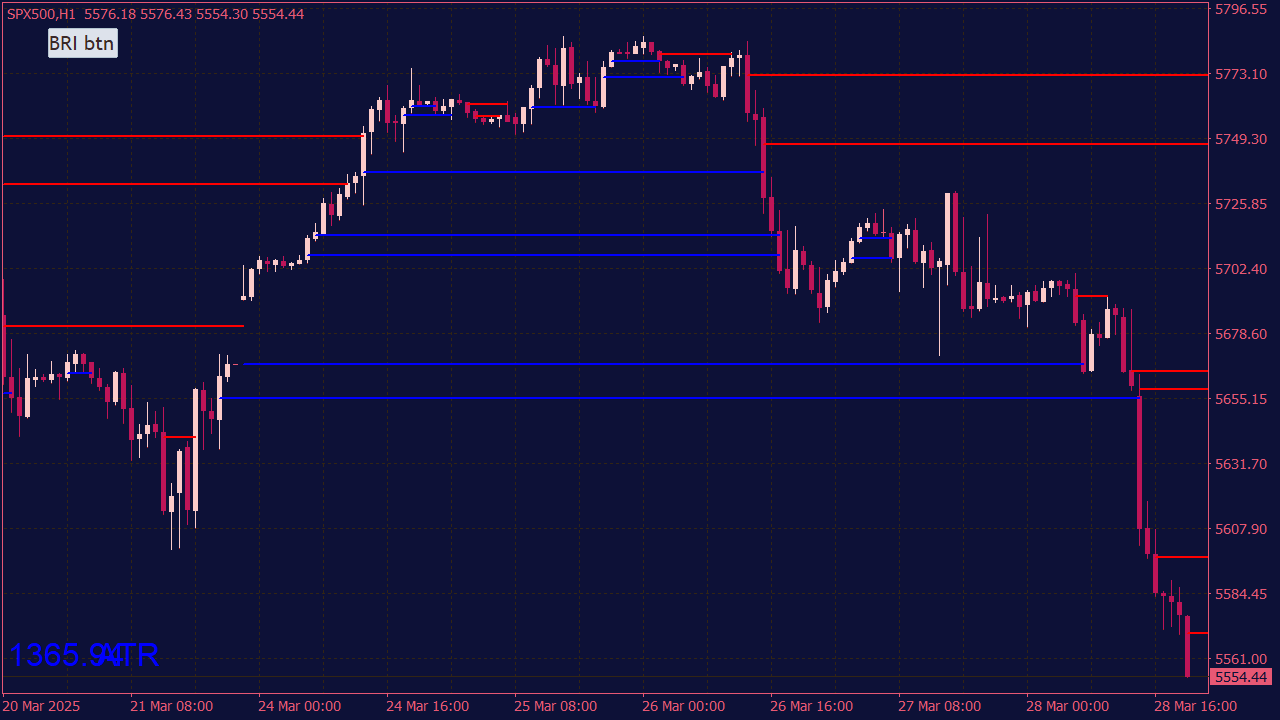
The Market Structure Indicator gives you a clearer view of what is actually happening behind the candles. Instead of marking every swing high, swing low, and structural break by hand, it organizes the important levels directly on the chart. This makes it easier to see whether price is still respecting the current trend or whether the character of the market is beginning to change. The indicator tracks events such as Break of Structure (BOS), Change of Character (CHoCH), Equal Highs, Equal Lows, inducement, and relevant liquidity areas.
Used together, these markings can provide useful context around continuation moves, possible reversals, and locations where price may first reach for liquidity before choosing a clearer direction. The goal is not to fill the chart with signals, but to make market structure easier to read at a glance. What becomes interesting is the order in which these events appear. A breakout on its own can be misleading. A liquidity sweep can look insignificant. But when price takes a key level, reacts, and then changes structure, the situation suddenly deserves more attention. The Market Structure Indicator brings these pieces together so you can focus less on drawing lines and more on understanding what price is doing.
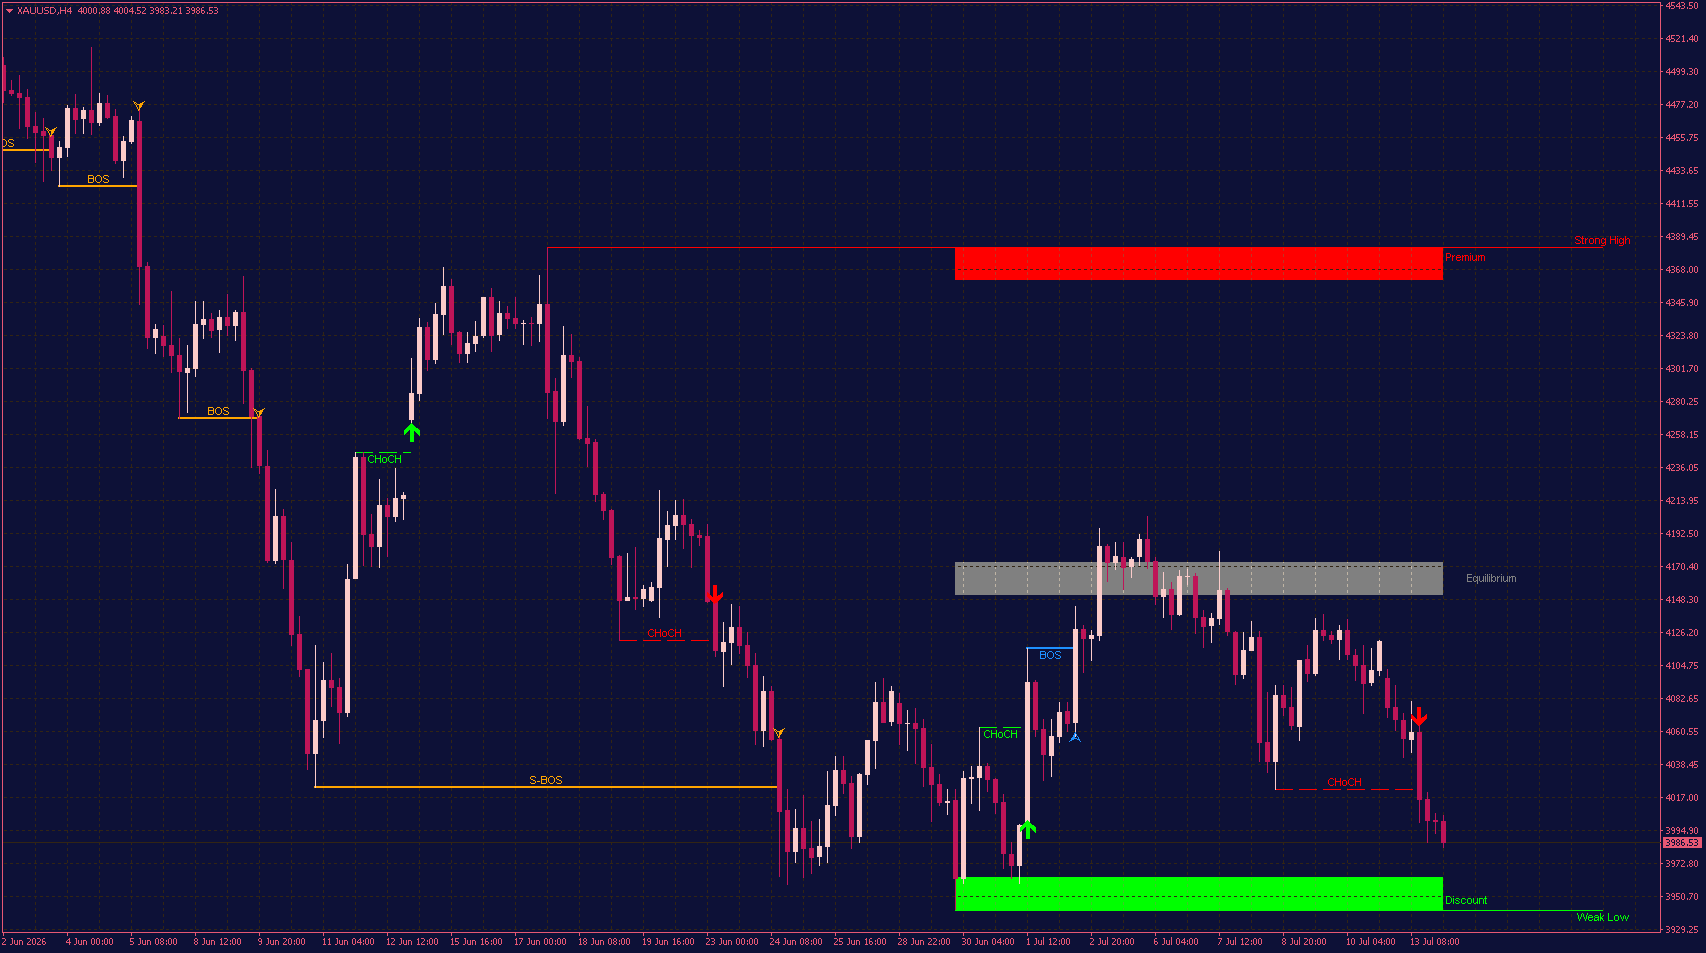
The Change of Character (CHoCH) Detector is designed to reveal the small structural shifts that often appear before a market move becomes obvious. It automatically marks Changes of Character and Breaks of Structure, helping you see whether buyers or sellers are starting to take control. By separating internal structure from broader swing structure, the indicator puts short-term price action into context. Premium, discount, and equilibrium zones add another layer, showing whether price is trading high, low, or near the middle of its current range. It also identifies strong and weak highs and lows—areas that price may respect, revisit, or move through. Sometimes the most important clue on a chart is not a large candle, but a quiet structural break that changes the entire picture.
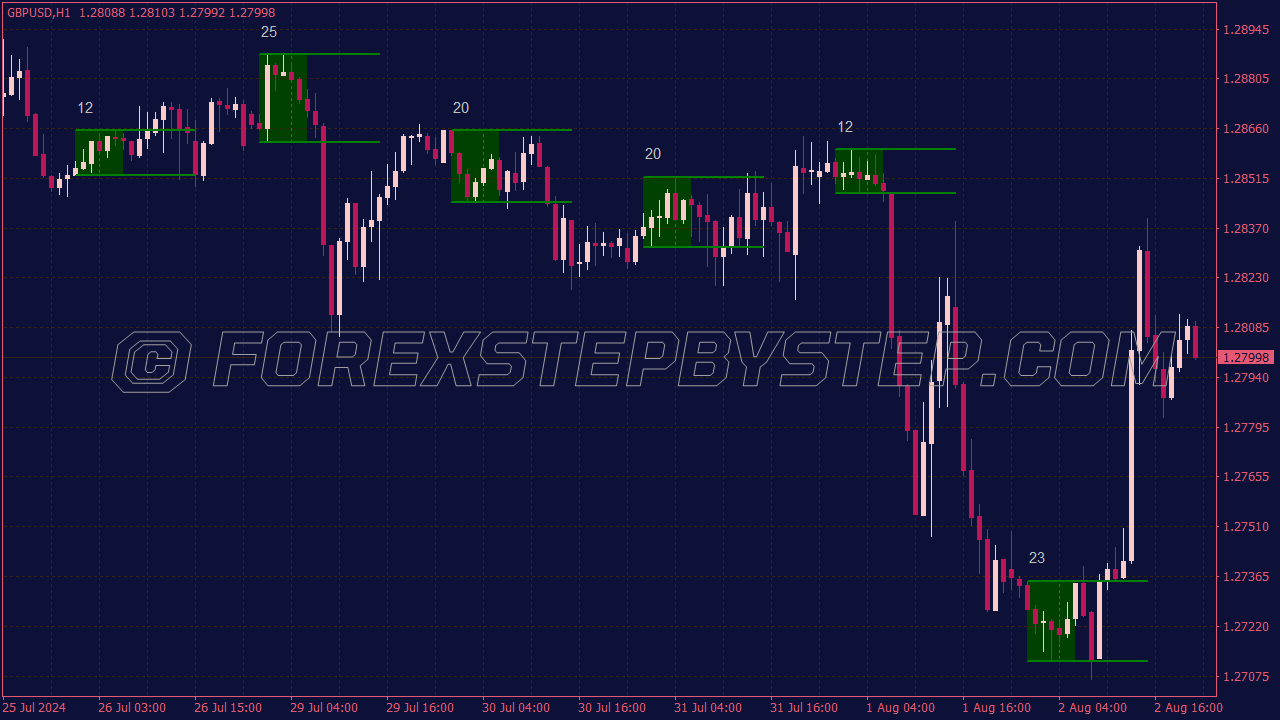
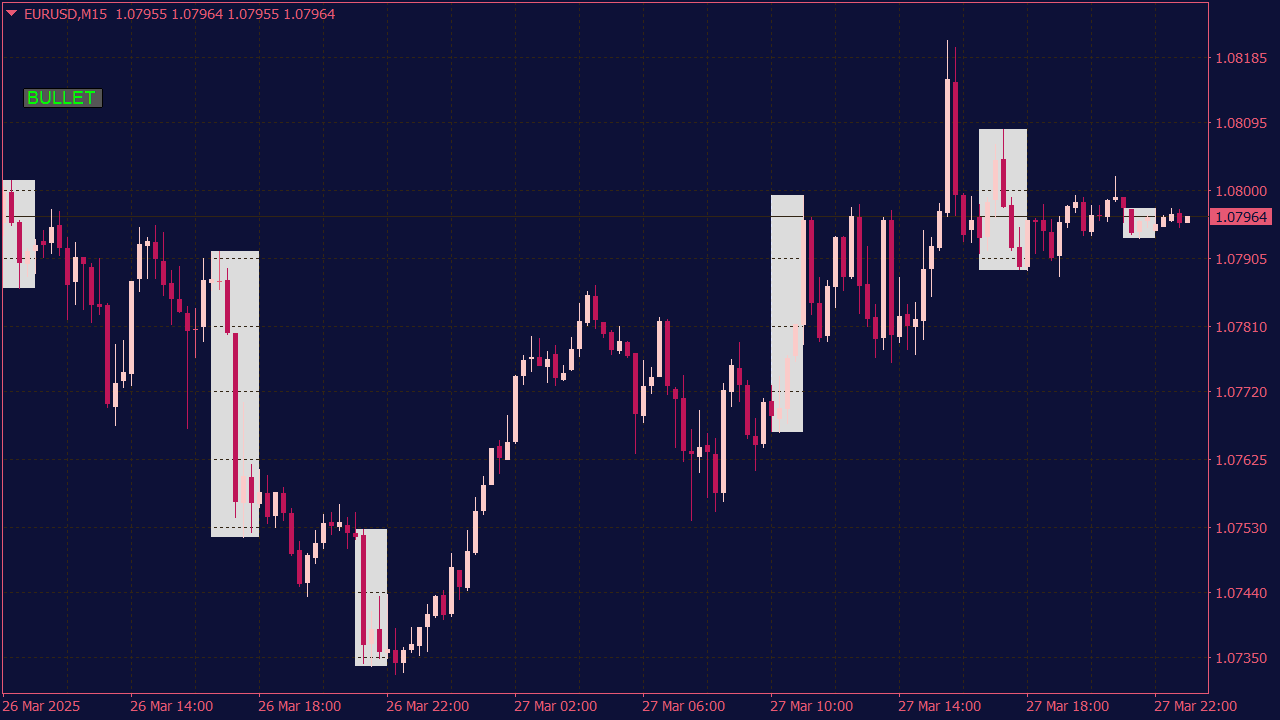
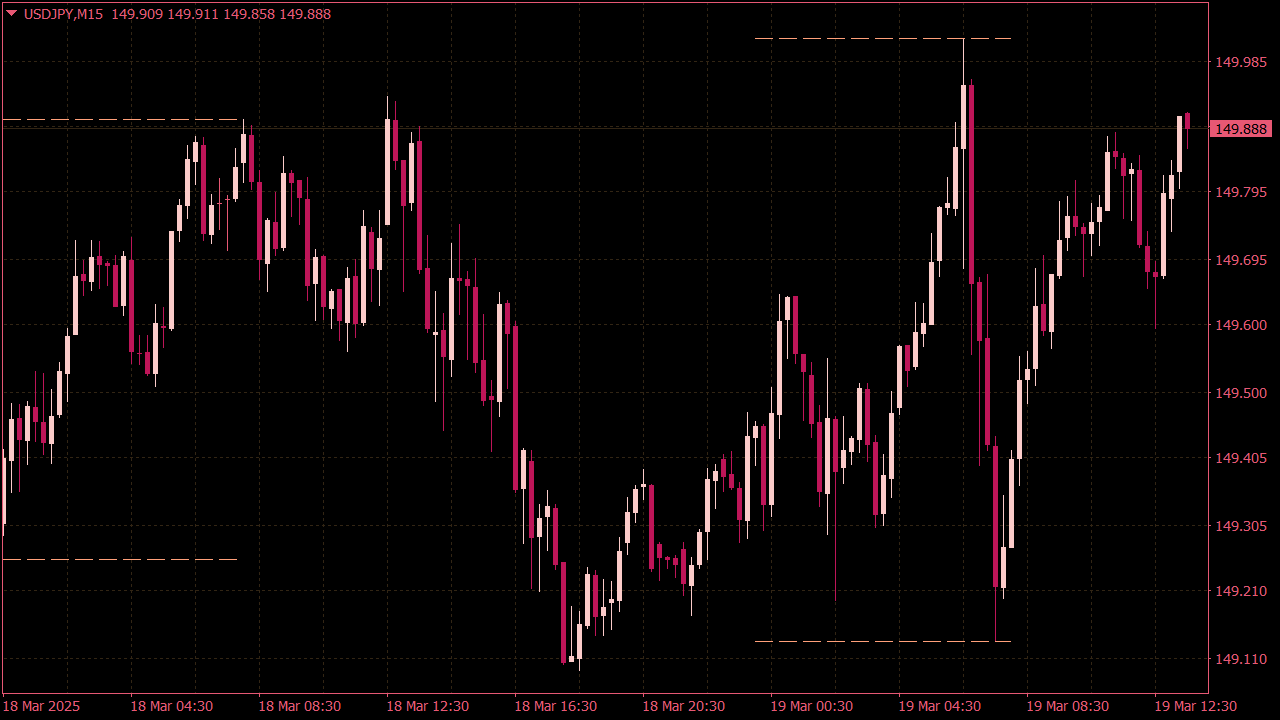
The ICT Daily Line Box Indicator is used to identify potential trading ranges and breakout points in the market. To trade using this indicator, first, observe the daily highs and lows to establish the trading range. Enter a long position if the price breaks above the upper line of the box with strong volume, and consider entering a short position if the price breaks below the lower line. Use stop-loss orders just outside the box boundaries to manage risk, and look for additional confirmation from other technical indicators or market conditions before making trades. Always ensure to have a clear risk management strategy in place.
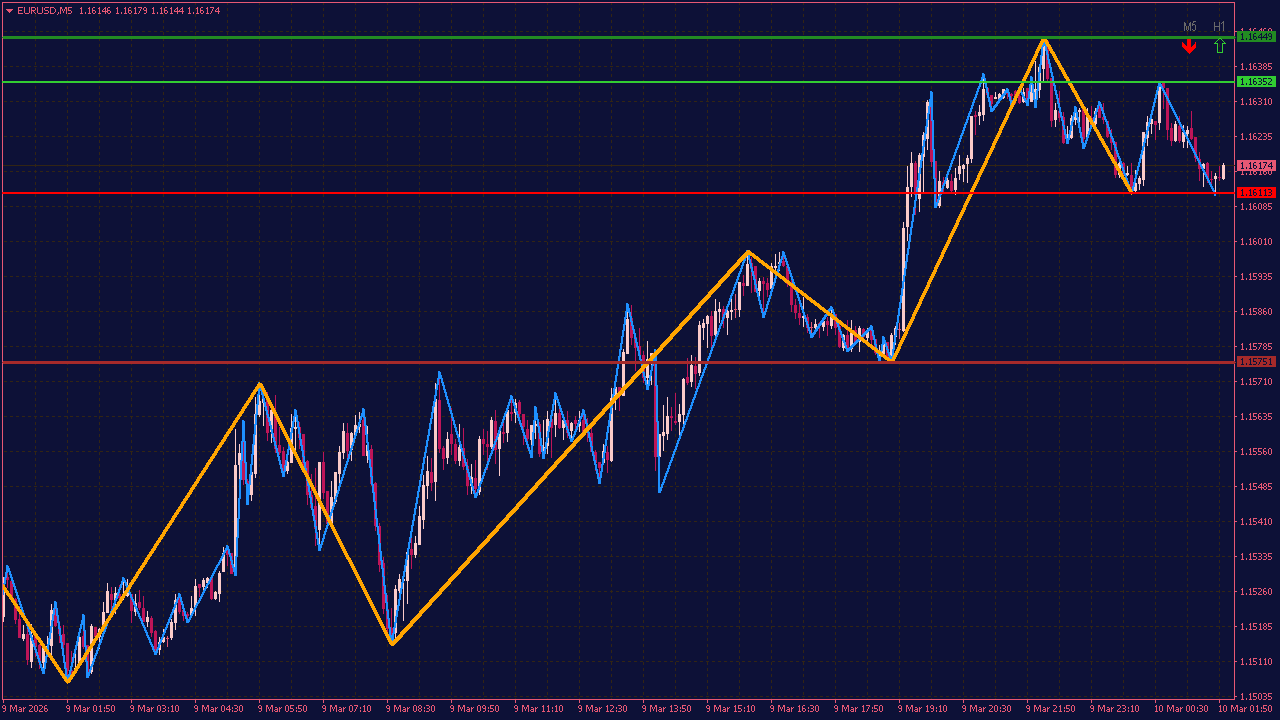
The Smart Market Structure MTF (Multi-Time Frame) Indicator is a tool used by traders to analyze the overall market structure across multiple time frames simultaneously, helping identify trend directions, support and resistance levels, and potential reversal points. To use it effectively, start by observing the primary trend on higher time frames (like daily or 4-hour) and then switch to lower time frames (like 1-hour or 15-minute) to pinpoint entry and exit points that align with the larger trend. The indicator often highlights key market structure shifts such as higher highs and higher lows in uptrends or lower lows and lower highs in downtrends, providing a comprehensive view of market momentum. Combining this with other indicators or price action can improve accuracy in your trading decisions.
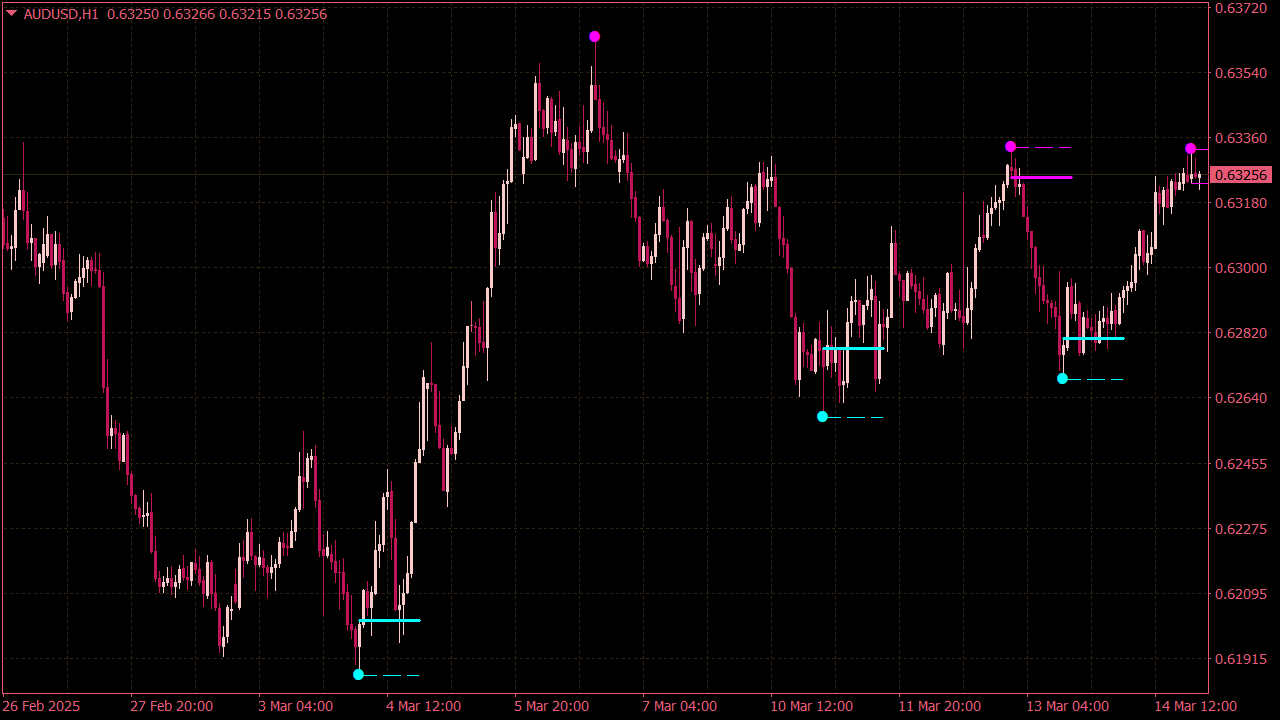
The Liquidity Zones Indicator with Arrows identifies key price areas where liquidity is concentrated around support and resistance levels, order blocks, or previous highs and lows. It visually highlights these zones on the chart and uses directional arrows to signal potential price reactions, such as reversals or breakouts. This helps traders anticipate high-probability entries and exits based on institutional activity and market structure.
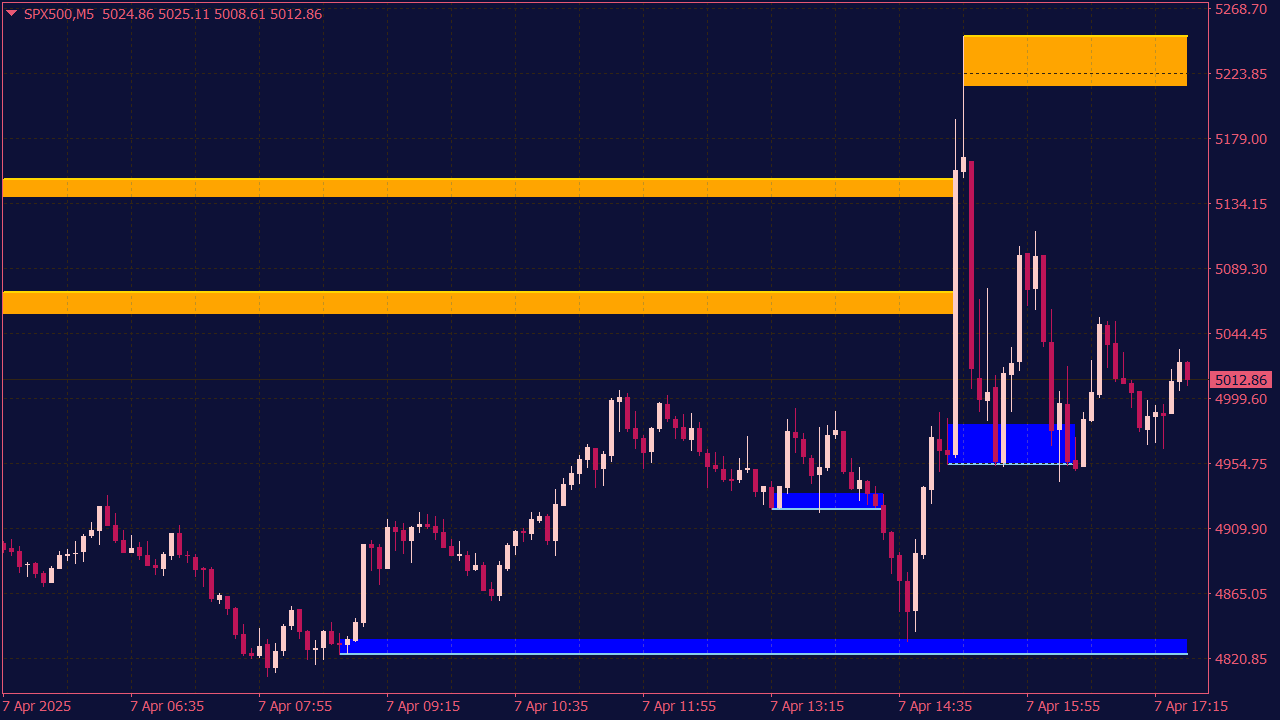
The Order Blocks Indicator identifies institutional buying and selling zones by detecting significant price imbalances where large orders are likely placed. It highlights these areas on the chart, helping traders spot potential reversal or continuation points based on smart money concepts. Ideal for traders using supply and demand or price action strategies.
Eight ICT and SMC setups that become more useful when traders stop treating every indicator label as a trade signal.
There is a stage in many traders’ development when the chart begins to look deceptively clear.
Order blocks are marked automatically. Fair value gaps appear as neat rectangles. Session highs and lows are easy to spot, and every minor swing seems to receive a label.
At first, this feels like progress. The chart looks organized, the terminology is familiar, and the number of potential trades increases. Yet the results often remain inconsistent.
The problem is rarely a lack of signals. More often, it is a lack of context.
An indicator can identify predefined conditions, but it cannot fully explain why a level matters, whether the surrounding liquidity has already been used, or whether a structural break is significant enough to change the broader market picture.
A fair value gap is not automatically an entry. A liquidity sweep is not automatically a reversal. A break of structure does not guarantee continuation.
In practice, some of the most useful information appears when price fails to behave as expected.
A breakout cannot hold. An order block gives way. A structure shift produces no follow-through. These failures often reveal more than the original pattern.
The better question is not simply, “Which signal appeared?”
It is, “What should price have done next, and why did that not happen?”
🚨 1. The Breakout That Could Not Hold
Breaking a level and holding beyond it are two different events.
Consider a currency pair trading below a well-observed weekly high. Breakout traders are waiting above the level, while traders holding short positions may have placed their stops in the same area. When price finally trades through the high, the initial move looks bullish.
That first move is only part of the story.
When price quickly returns below the old high, closes back inside the previous range, and creates bearish displacement, the breakout may have failed. Late buyers are now trapped, and the market may begin looking for liquidity on the opposite side of the range.
Details Worth Watching
The swept high was clearly visible on more than one timeframe.
Price spent little time above the level.
A strong candle closed back inside the previous range.
The reversal broke a meaningful lower-timeframe low.
The move left an imbalance that price could later revisit.
The first bearish candle is not always the best entry. By the time it closes, the move may already be extended. A retracement into the imbalance created by the reversal can offer a clearer invalidation point and more controlled risk.
The setup becomes less convincing when price continues closing above the old high or begins forming higher lows beyond it. That behavior suggests acceptance rather than rejection.
The useful information is not that price crossed the level. It is that the market could not remain there.
🔄 2. The Structure Shift That Changes Very Little
One weakness of automated SMC indicators is their ability to make insignificant movements look important.
On a one-minute or five-minute chart, price constantly breaks local highs and lows. An indicator may label each event as a change of character, market structure shift, or break of structure. Technically, the label may be correct. In practical terms, it may mean very little.
Suppose GBP/USD is trading inside a broad one-hour range. Price moves higher and breaks a small five-minute swing. A bullish structure label appears, but price is still sitting near the center of the larger range. No important liquidity has been taken, and the move contains little displacement.
Has the market genuinely turned bullish? Possibly. The label alone does not establish that.
A structural change becomes more relevant when it breaks a swing that was actually protecting the previous directional move. It deserves even more attention when it follows a liquidity event and is supported by clear momentum.
A Practical Structure Filter
Identify the swing that was broken.
Decide whether it was structurally important or merely local noise.
Check whether liquidity was taken before the break.
Look for displacement rather than a slow drift through the level.
Confirm that the break matters within the higher-timeframe range.
It can help to hide the indicator temporarily and study the chart without labels. When the movement no longer looks meaningful after the text disappears, the trader may be reacting to the software rather than the market.
⚡ 3. The Second Move May Be More Reliable Than the First
The first reaction after a liquidity sweep often receives the most attention. It is also where traders are most likely to enter too early.
Price trades below a previous low, reverses, and breaks a minor high. The sequence appears to confirm a bullish setup. Sometimes that first shift is enough. In other cases, it is only a temporary reaction inside an existing bearish structure.
A more patient approach is to wait for a second expansion.
After the initial bounce, price retraces without creating a new low. It then accelerates again, breaking a more important swing with stronger displacement. That second move may provide better evidence that the market is repricing rather than simply reacting.
The potential entry often appears inside the fair value gap created by the second displacement.
Waiting has a cost. The entry price may be less attractive, and the theoretical risk-to-reward ratio may be smaller. At the same time, the market has provided more information.
A slightly worse price can still produce a better trade when the confirmation is stronger.
This should not become a rule that the second signal is always superior. Its value lies in recognizing situations where the first break is too small, too slow, or too deeply embedded in consolidation to justify immediate action.
🧱 4. When an Order Block Fails
Most discussions about order blocks focus on zones that hold. Failed zones are often removed from the chart and forgotten.
That can be a mistake.
Imagine a bullish order block that previously supported an upward move. Traders expect price to return to the area and continue higher. Instead, price closes through the zone, breaks the protected low, and moves away with strong bearish momentum.
The original bullish idea is no longer valid, but the zone may still matter.
When price later returns from below, the former demand area can act as resistance. Traders who bought the original block may use the retracement to reduce or close their positions. New sellers may also view the failed zone as evidence that the earlier bullish structure has broken down.
This type of failed order block is often described as a breaker. The terminology matters less than the behavior.
Features of a Stronger Setup
A clear candle close through the original block.
A break of the protected structural swing.
Visible displacement away from the zone.
A controlled return rather than an immediate reversal.
Fresh lower-timeframe rejection inside the failed area.
Blindly entering at the first touch remains risky. A zone that failed once can fail again. The retest should still be evaluated through context, reaction, and invalidation.
A failed level is not always irrelevant. Sometimes the failure is the most useful information it provides.
🎯 5. The Entry That Looks Too Obvious
Some setups are attractive precisely because they appear so clean.
There is a well-defined bullish order block, a recent structure break, and an obvious location for the stop. The chart appears to offer a textbook entry.
Directly beneath that stop, however, sits a cluster of equal lows.
That should raise a question: Why should price reverse from the first zone when a visible pool of liquidity remains only a short distance below it?
The order block may still hold. There is no rule requiring every equal low to be swept. Even so, a setup located immediately in front of obvious liquidity deserves closer examination.
Some traders describe the first zone as inducement. The term is useful only when it is defined before the trade. Applied after every loss, it becomes an explanation that cannot be tested.
Questions to Ask Before Entering
Did the zone create meaningful displacement?
Was an important swing actually broken?
Is untouched liquidity sitting directly behind the proposed stop?
Does a deeper higher-timeframe zone offer a more logical location?
Has the larger liquidity objective already been completed?
When the first zone fails and price sweeps the lows beneath it, a different setup may emerge. The trader can then wait for fresh displacement and evaluate the newly formed imbalance instead of repeatedly buying the original block.
The point is not to assume that every clean setup is a trap. It is to recognize when the proposed entry sits in front of an unfinished market objective.
🌏 6. Reading the Asian Range Without Guessing
The Asian session range is one of the most widely followed structures in intraday forex trading. The London session often approaches a clearly defined high or low, creating an apparent opportunity around the edge of the range.
The difficulty is that the same initial move can lead to two very different outcomes.
Price may trade above the Asian high during the London session and quickly return inside the range. Alternatively, price may break the high, remain above it, and continue expanding.
The first situation suggests rejection. The second suggests acceptance.
Signs of Possible Rejection
Price spends little time outside the range.
A candle closes back inside it.
Opposing displacement follows the sweep.
A meaningful short-term swing breaks in the direction of the reversal.
Signs of Possible Acceptance
Several candles close beyond the range.
Retracements respect the broken boundary.
Price continues building structure outside the range.
The larger liquidity target remains in the breakout direction.
This distinction is more useful than assuming that every range sweep must reverse or every breakout must continue.
The range boundary provides the location. The reaction provides the information.
🗽 7. The New York Retracement After London
A strong London session often creates a familiar emotional problem. Traders who missed the initial move begin to believe that the opportunity is gone.
They enter late, often near the point at which a retracement becomes more likely.
A better opportunity can appear when price retraces during the New York session into part of the London displacement.
Suppose the London session produces a clear bullish move, breaks a meaningful high, and leaves an imbalance below the current price. The larger daily objective has not yet been reached. During the New York session, price retraces into that imbalance, removes short-term sell-side liquidity, and begins moving higher again.
The continuation entry may then be more controlled than buying near the top of the London expansion.
This setup becomes less convincing when the London session has already reached a major daily or weekly target. In that situation, the New York session may bring profit-taking, consolidation, or a full reversal.
The important condition is not simply that New York retraced the London move. The broader directional objective should still make sense.
Reasons to Avoid the Setup
The London session has already reached major external liquidity.
The retracement breaks the protected London swing.
High-impact news is due during the intended entry window.
The return into the zone shows strong opposing displacement.
Missing the first move does not justify chasing it. Sometimes the market offers another opportunity. Sometimes it does not.
⏳ 8. When Time Invalidates the Trade
Most trading plans define invalidation only through price. A bullish idea is wrong below a certain low; a bearish idea is wrong above a certain high.
Time can also reveal that a setup is weakening.
Suppose price enters a bullish fair value gap after a strong displacement move. The expectation is that the zone should produce a relatively quick response. Instead, candles overlap, price repeatedly crosses the entry level, and momentum disappears.
The stop has not been reached, but the market is no longer behaving as expected.
For short-term execution models, this may matter. A trader can decide in advance to reduce or close a position when price fails to show a minimum favorable reaction within a defined number of candles.
That rule must come from testing. It should not be created during a live trade because the trader feels impatient.
A swing strategy may tolerate several hours or days of consolidation. A one-minute displacement model may not. Time-based invalidation has to match the timeframe and logic of the setup.
Sometimes price does not prove that the idea is wrong. It simply fails to provide evidence that it is right.
🛠️ Using ICT and SMC Indicators More Intelligently
Indicators are most valuable when they reduce repetitive work. They can mark sessions, display imbalances, and identify potential swing points with greater consistency than manual charting.
Problems begin when the indicator is expected to make decisions that require interpretation.
A rectangle cannot determine whether an order block remains fresh. A structure label cannot decide whether the broken swing was significant. An alert cannot evaluate whether transaction costs are too high for the planned stop.
The trader still needs a market narrative.
Four Questions That Improve That Narrative
Where is price trading? Near the edge of a meaningful range or close to its center?
Which liquidity remains untouched? Previous highs, lows, session boundaries, or equal levels?
What has recently failed? A breakout, an order block, a structure shift, or a continuation attempt?
Where is the idea invalid? The answer should be known before the order is placed.
These questions are less exciting than a new indicator alert. They are also more useful.
🧪 The Part Most Traders Do Not Test Properly
A backtest that records only wins and losses leaves out much of the information needed to improve a strategy.
Two winning trades can behave very differently. One reacts immediately from the entry zone and never moves against the position. The other spends an hour near the stop before eventually reaching the target.
Both trades count as wins, but they do not provide the same information.
A detailed journal should record how the setup developed, not only how it ended.
How deeply did price enter the zone?
How long did the reaction take?
What was the maximum movement against the position?
How far did price move in favor before reversing?
Did the signal appear before candle close and later change?
Were spread and slippage significant relative to the stop?
These observations can expose weaknesses that a basic win-rate calculation misses.
A strategy may win often but require stops so wide that its long-term return remains poor. Another may lose frequently but produce occasional large moves that compensate for several smaller losses. Without proper records, both systems can be judged incorrectly.
The purpose of testing is not to prove that a preferred setup works. It is to understand how it behaves, where it performs best, and under which conditions it should be avoided.
💡 Final Perspective
The most useful trading opportunities are not always the patterns that look perfect. They are often the situations in which the market exposes a contradiction.
A breakout occurs, but price cannot hold beyond the level. An order block looks valid, but the protected swing collapses. A structure shift appears, but no continuation follows. A session range breaks, yet the market immediately returns inside it.
Those contradictions create information.
They may reveal trapped traders, unfinished liquidity objectives, or a market narrative that is no longer valid. None of this makes the next movement certain. Price-action concepts cannot remove uncertainty.
They can, however, help the trader ask a better question.
What was price expected to do here, and what does its failure tell us?
That question is more valuable than reacting mechanically to every colored zone, structure label, or notification on the chart.
The indicator should organize the information. The trader should still interpret it.
📝 Editor’s Note
The strategies and market concepts discussed in our content are designed to help readers better understand market behavior. They are not trading recommendations. Financial markets are volatile, and every trader should test ideas carefully, manage risk and make independent decisions.