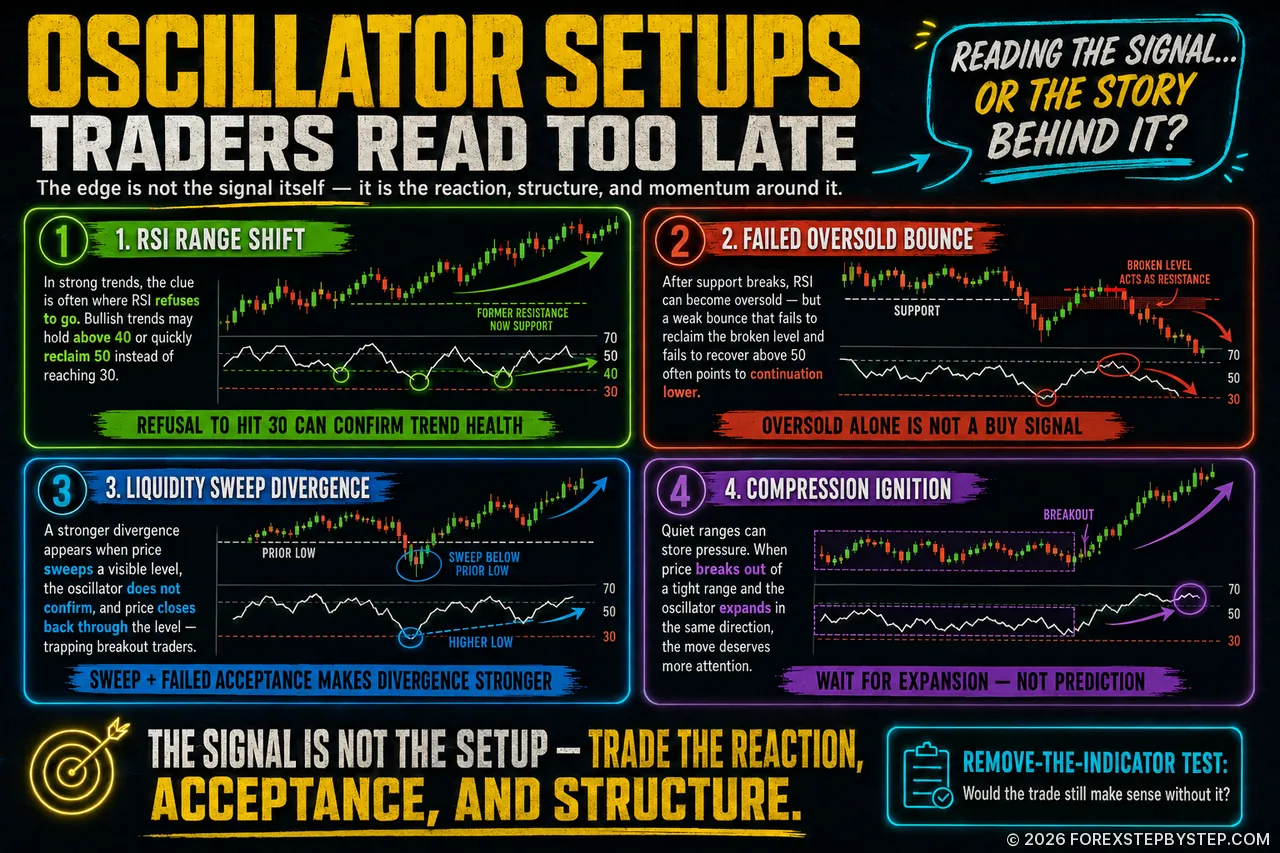
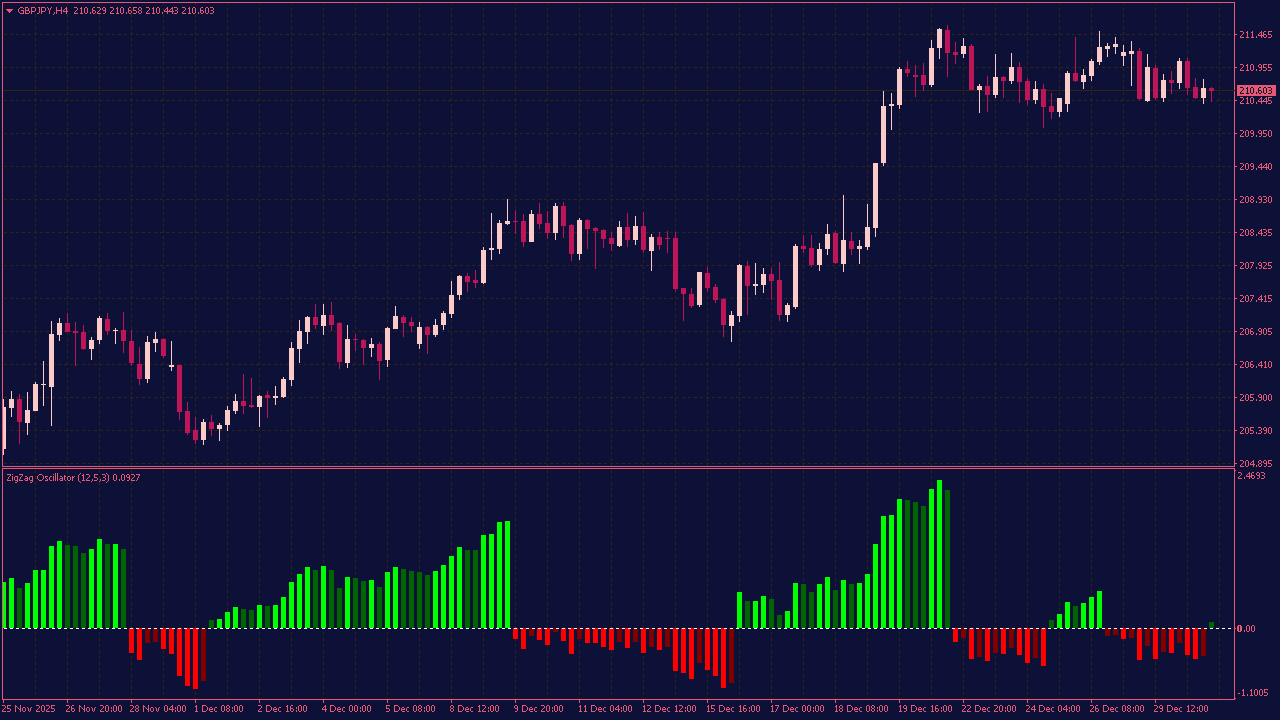
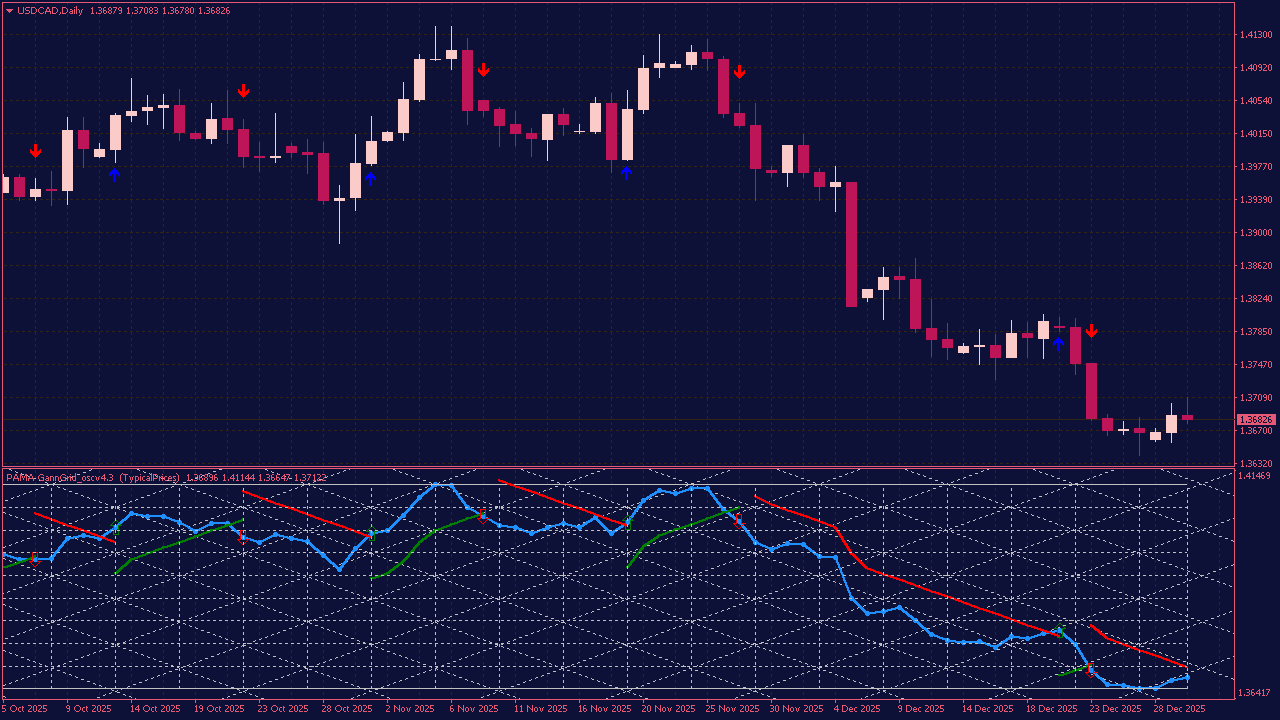
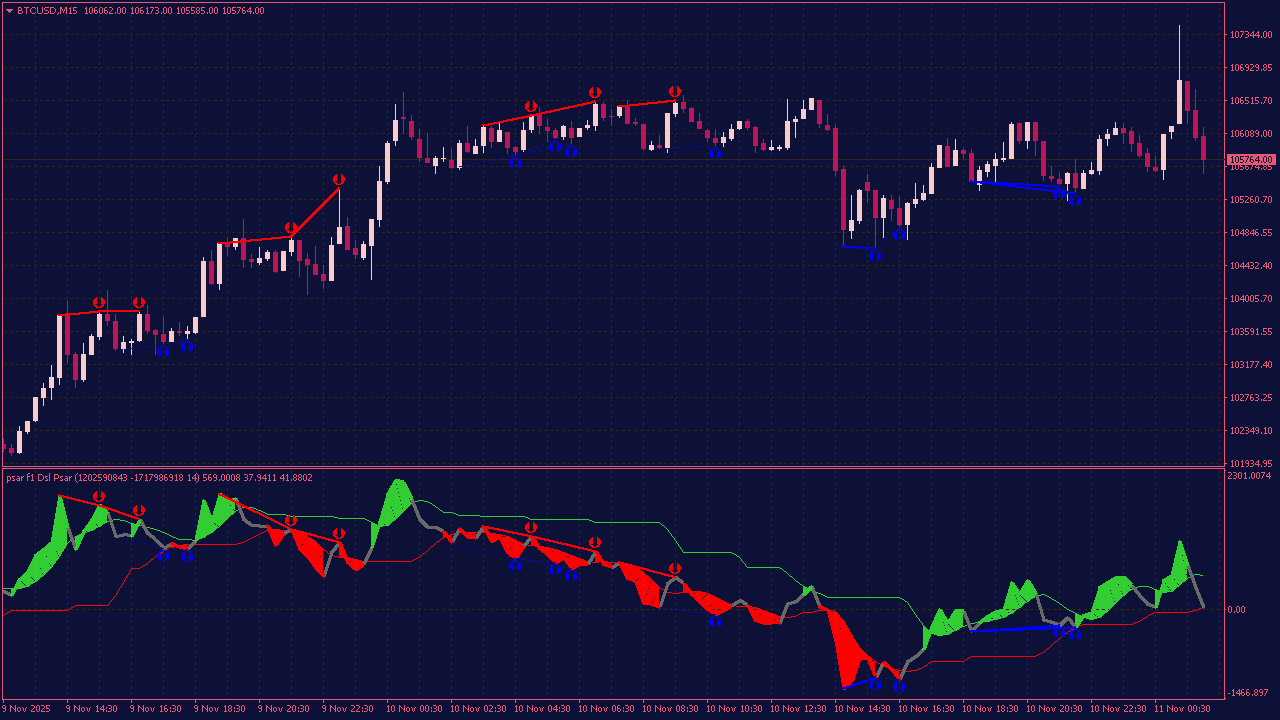
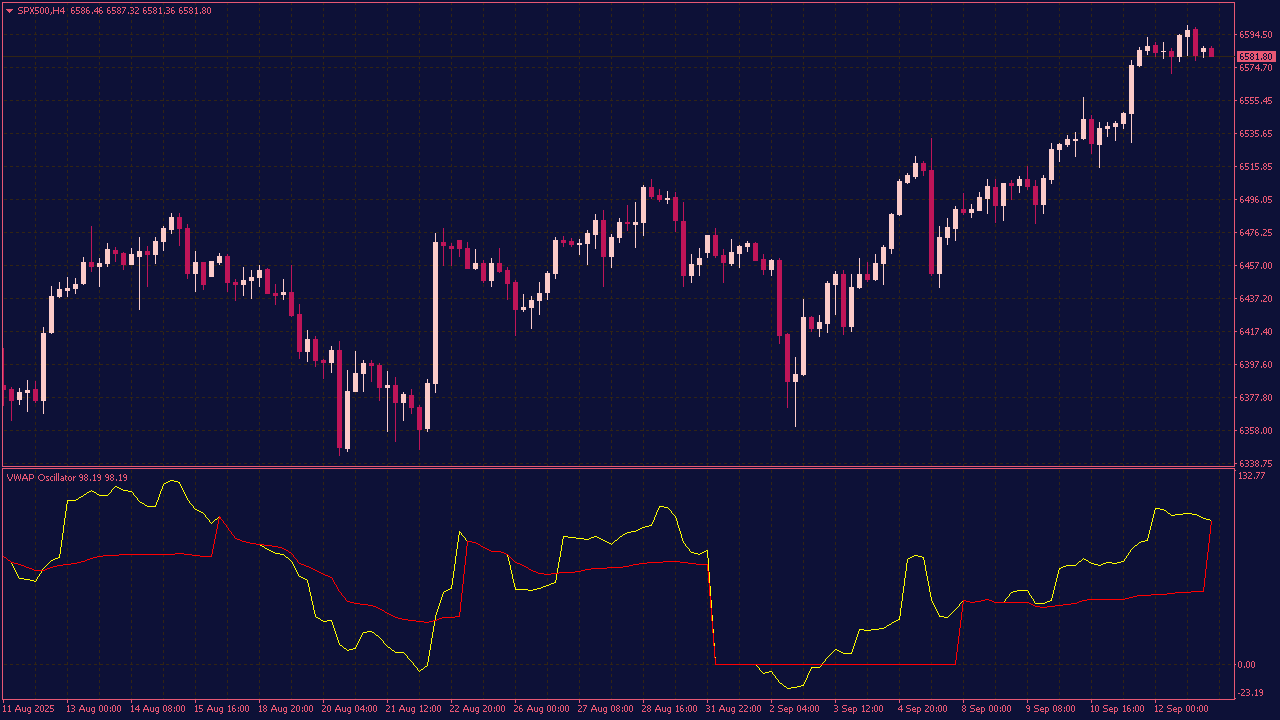
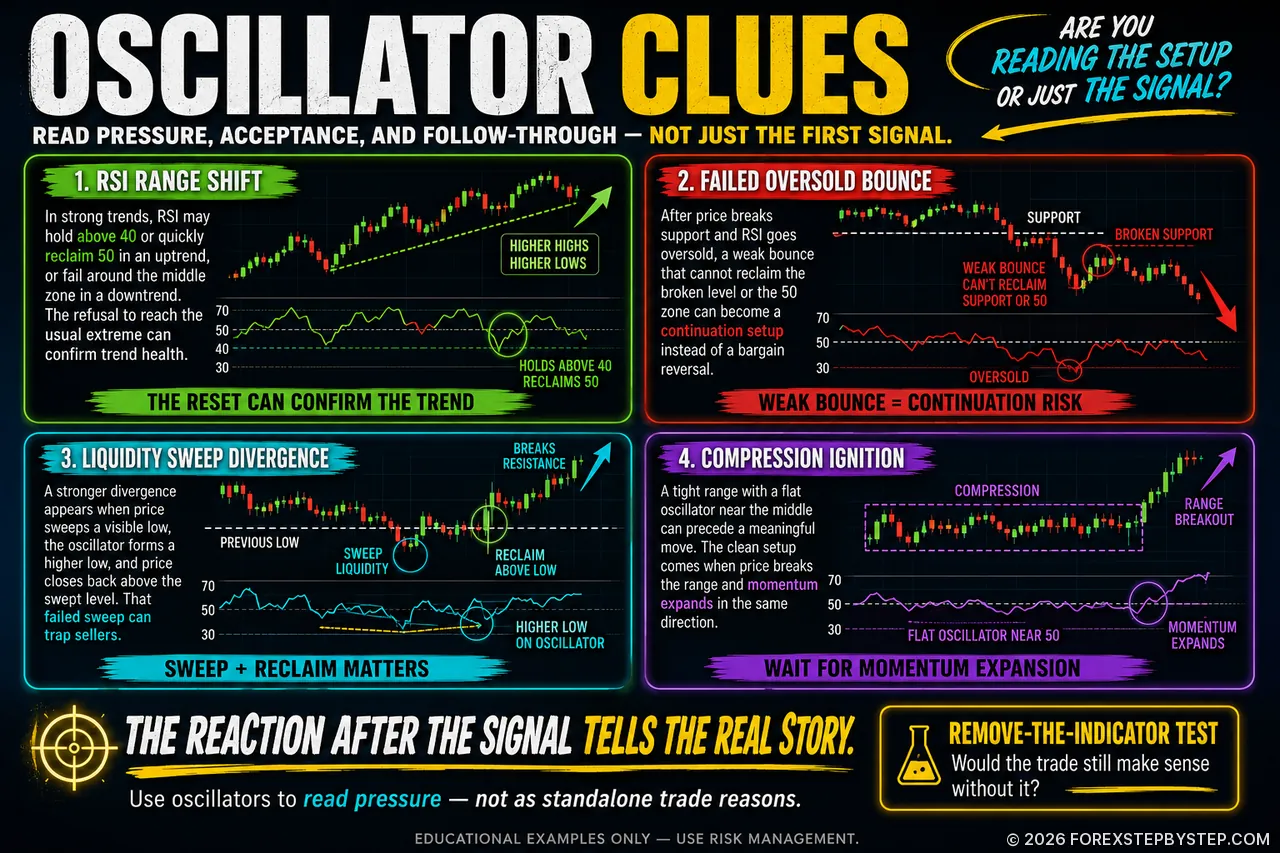
The oscillator gives the signal — but this visual shows why the real clue appears in what price does next.
🕵️ The Oscillator Signals Most Traders Notice Too Late
Most traders add an oscillator and immediately search for the familiar signals: overbought, oversold, divergence, or a clean cross. But Forex rarely rewards the most obvious read. Often, the better clue appears after the first signal fails.
An oversold pair that cannot bounce may not be cheap; it may still be weak. An overbought pair that refuses to pull back may not be exhausted; it may be under real demand. This article looks beyond textbook indicator rules and follows the moments traders often recognize too late: failed bounces, overbought holds, liquidity sweeps, round-number fakeouts, London range traps, MACD histogram fades, and the remove-the-indicator test.
The point is not to trade every signal. It is to understand what price does next—because that reaction often tells the real story.
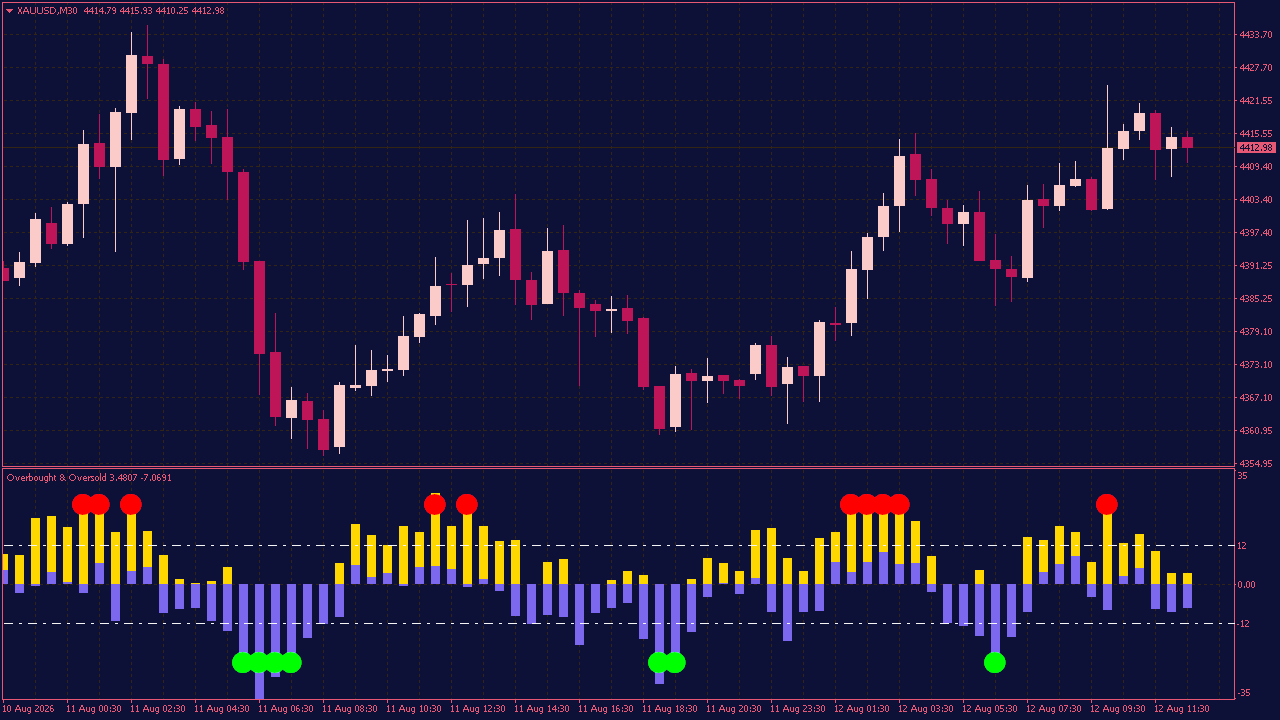
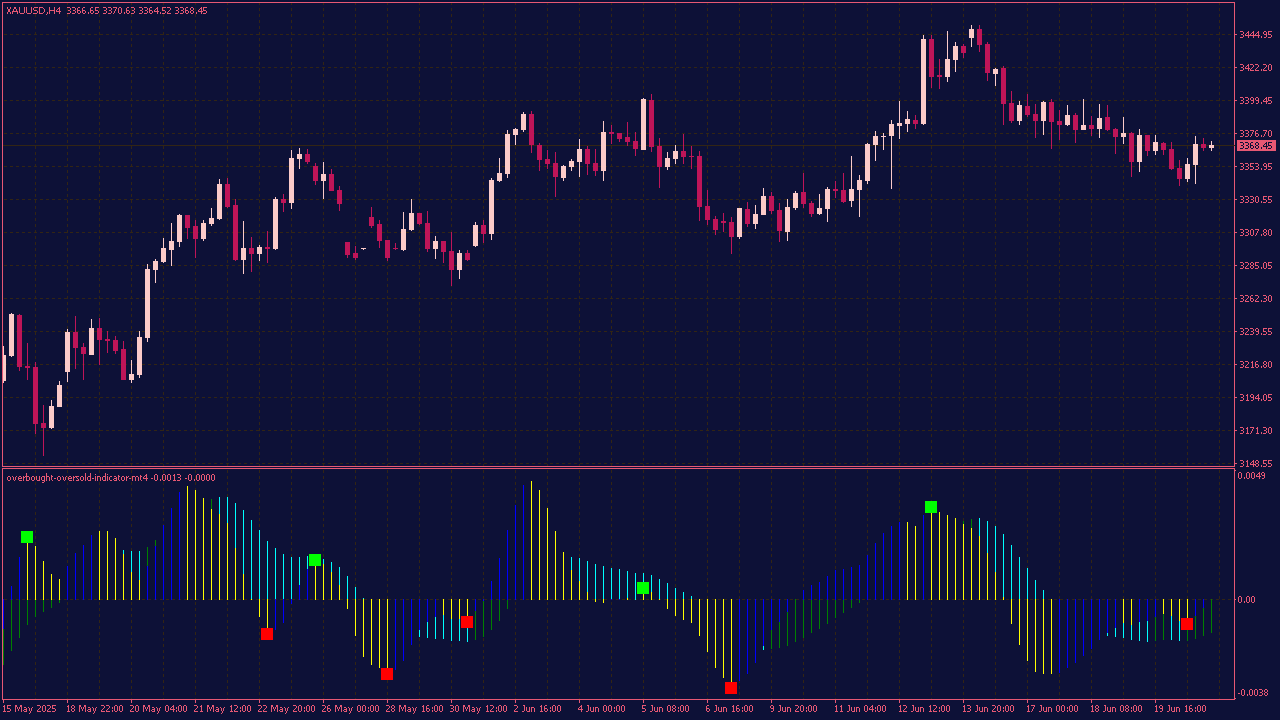
The OBOS Indicator is made for those moments when price starts to look a little stretched. You know the situation: the market has already made a strong move, everyone is watching the same candles, and the obvious question is whether there is still room left—or whether things are about to change. Instead of throwing constant signals at the chart, the indicator helps bring attention to unusually strong buying or selling pressure. That does not automatically mean a reversal is coming. Sometimes price turns around quickly. Sometimes it keeps going much further than expected. And that is exactly why these areas are worth watching. Think of it as a simple way to notice when the market is entering a more interesting zone. It gives you a reason to look closer, check the price action and see how the market reacts. Is the move losing strength, or is there still more behind it? That part is up to the market to reveal.
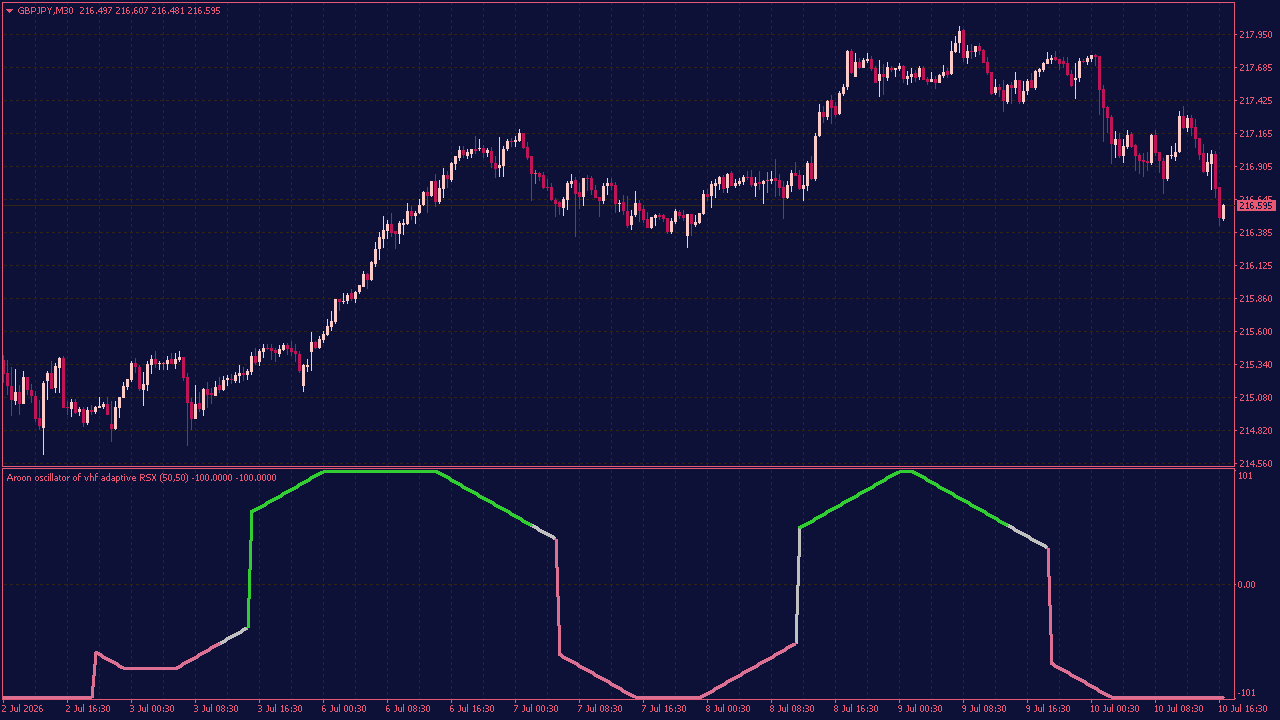
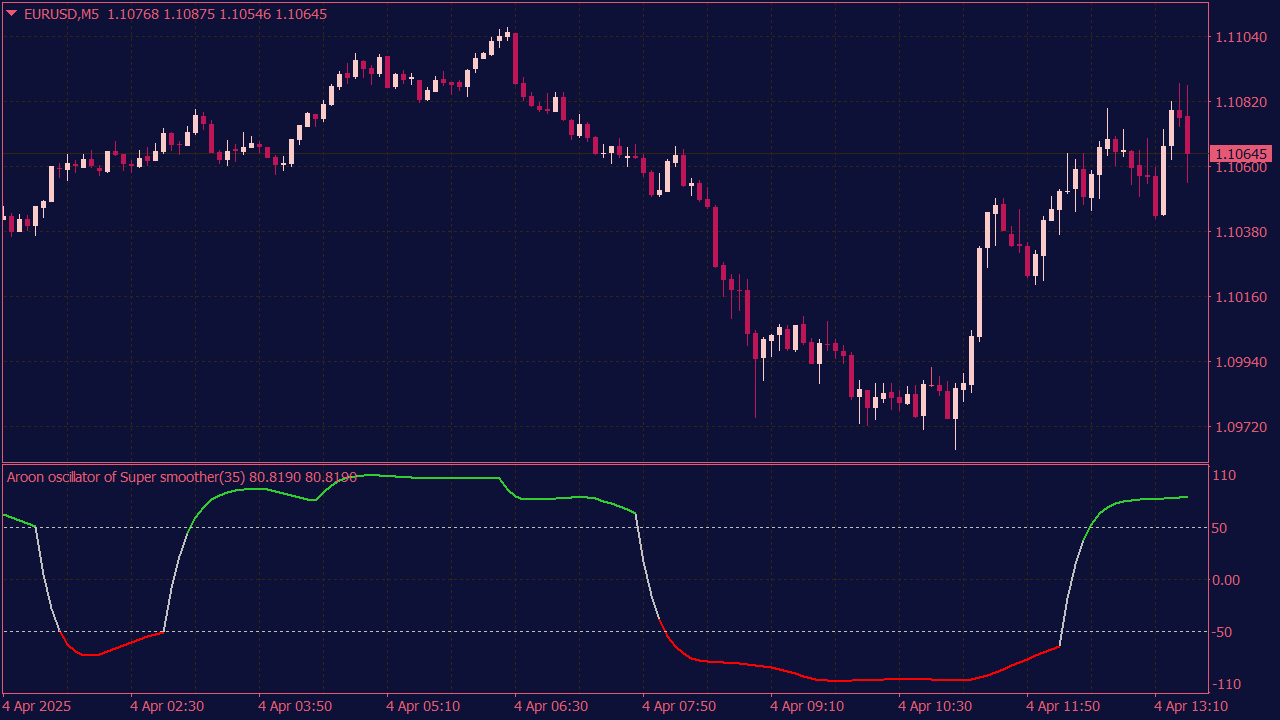
The Aroon Oscillator of VHF Adaptive MTF RSI is made for traders who want to see more than a standard momentum reading. It looks at how recently bullish and bearish momentum reached important levels, giving a clearer picture of what is happening behind the price movement. The indicator adjusts its RSI period as market conditions change. During faster moves it can react more quickly, while in slower conditions it may become more selective. The oscillator then turns this information into an easy-to-read view of market pressure. The interesting part begins when price still looks strong, but the oscillator starts to hesitate or move in the opposite direction. That does not always mean a reversal is coming, but it can be a useful warning that the current move is no longer as healthy as it appears.
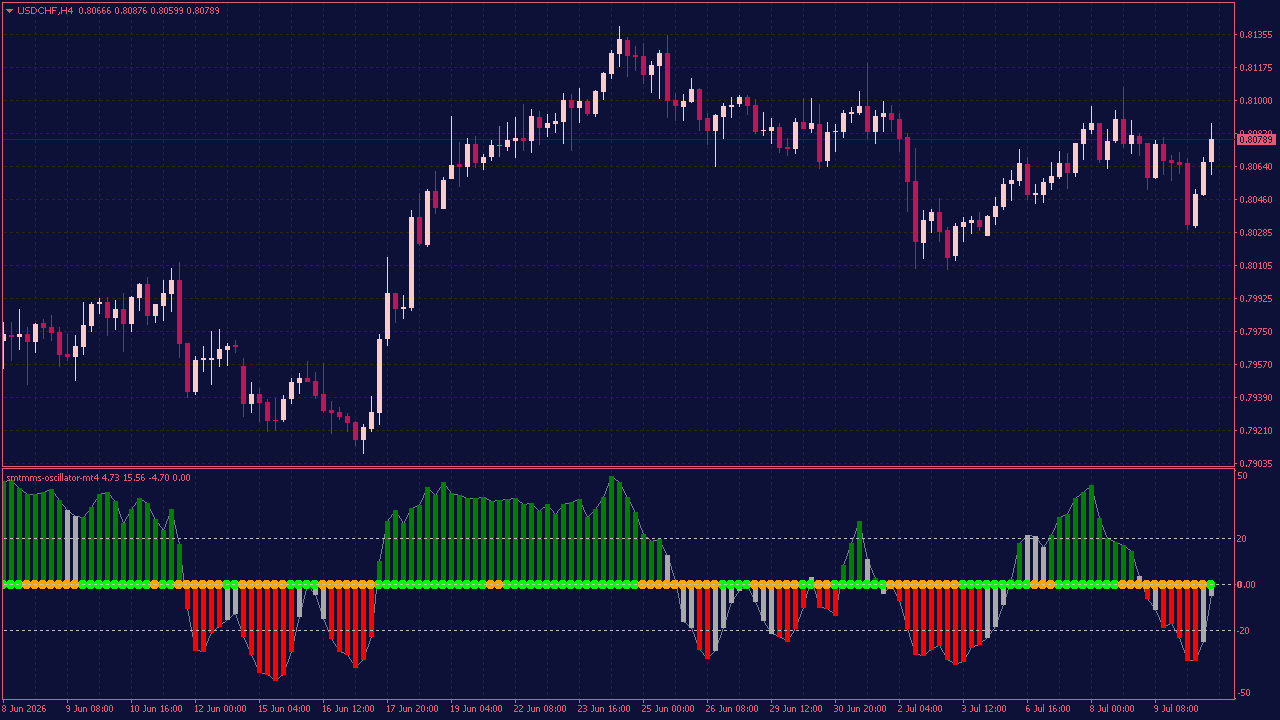
The smTMMS Oscillator brings several momentum readings together in one simple display. It combines RSI, two Stochastic settings, and Hull-based trend direction, making it easier to see whether the market is moving with real strength or simply drifting without a clear direction. The histogram shows when the different components agree and when the signals remain mixed. This can be useful because a market often looks convincing on the chart even though the underlying momentum tells a different story. The additional trend markers provide extra context without making the setup feel overloaded. What makes the indicator interesting is the moment when separate readings suddenly begin to line up. Sometimes nothing follows. Sometimes it is the first clue that market behaviour is starting to change. The smTMMS Oscillator helps bring those moments into focus before they become obvious at first glance.
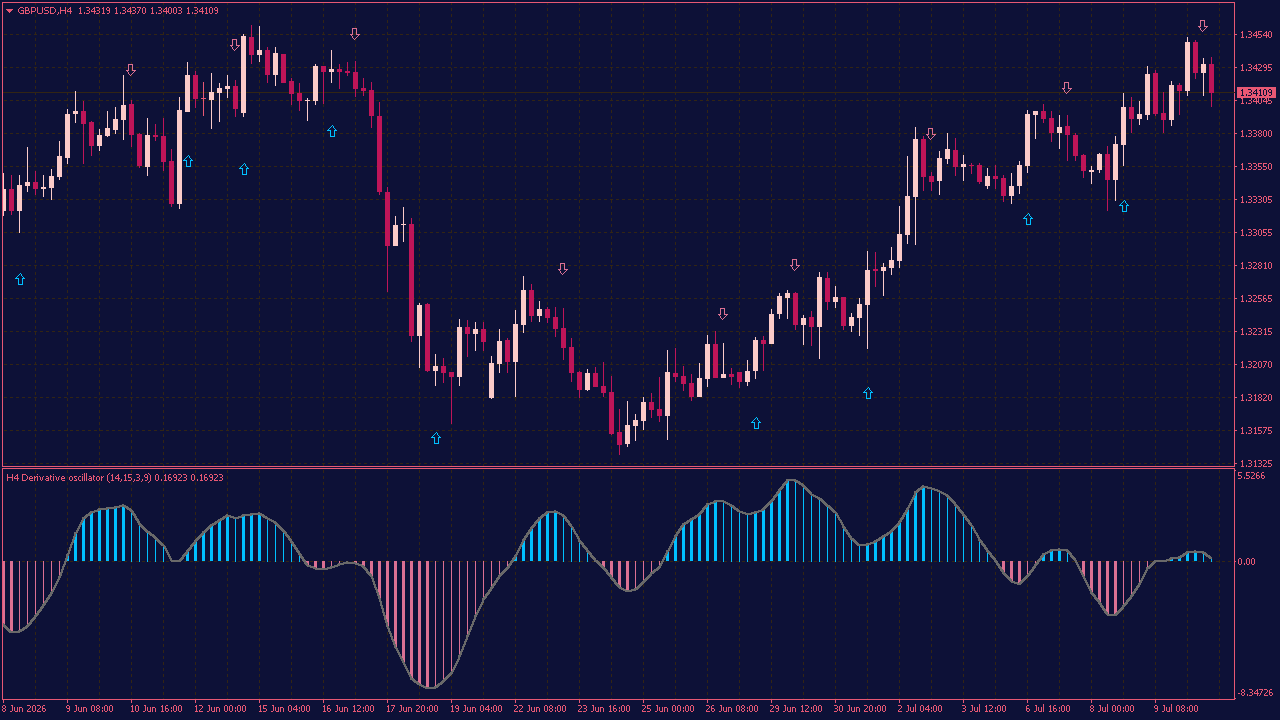
The Derivative Oscillator with Alerts and Arrows gives traders a clearer view of how momentum is changing behind price movements. It combines RSI-based calculations with smoothing to create an oscillator that is easy to read without adding unnecessary complexity to the chart. The histogram changes depending on whether momentum is rising, falling, positive or negative. Arrows can highlight changes in direction, while optional alerts make it easier to follow the market without watching every candle. Sometimes price continues moving in one direction even though the underlying momentum has already started to weaken. That is where the indicator becomes interesting: it can help you notice those subtle shifts and take a closer look before the change becomes more visible on the chart.
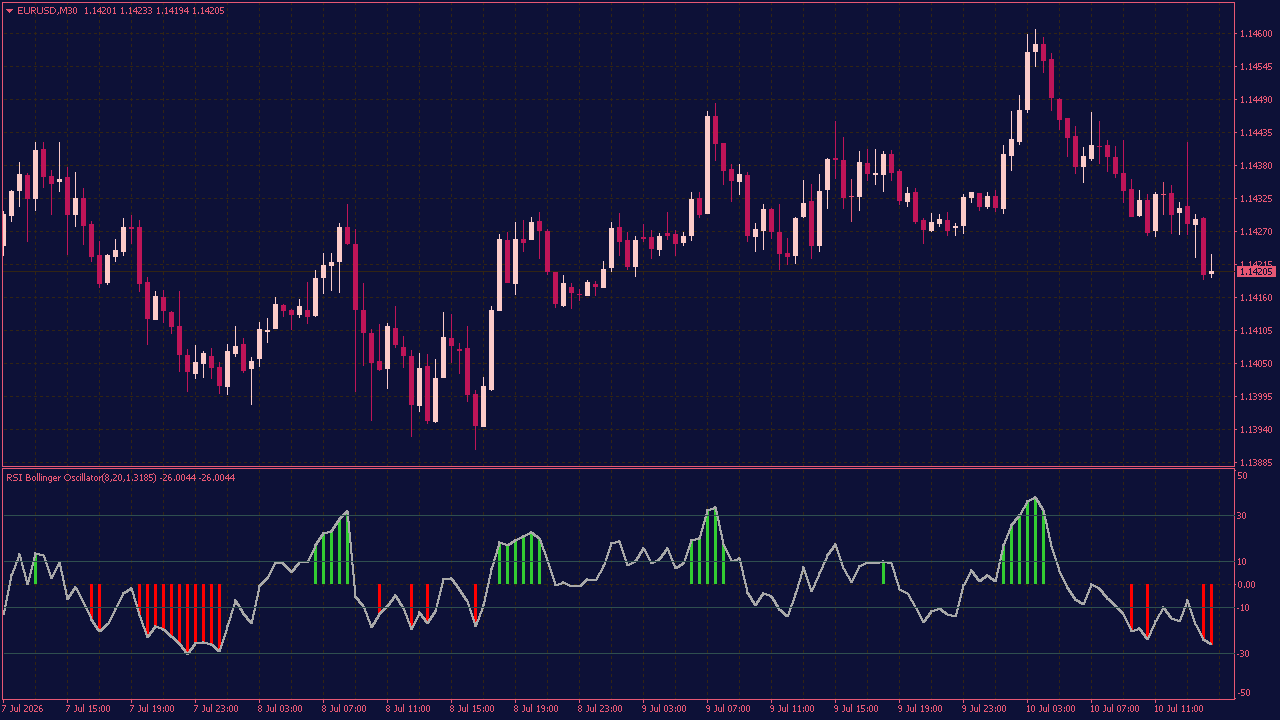
The RSI Bollinger Oscillator helps highlight moments when the market begins to behave differently from normal. Rather than treating every Bollinger Band breakout as a trading opportunity, it also checks the RSI. This extra confirmation can help separate ordinary price movement from situations where momentum is becoming noticeably stronger or weaker. The indicator does not try to predict the future. It simply draws your attention to conditions that may be easy to miss—and sometimes that is exactly where an interesting move begins.
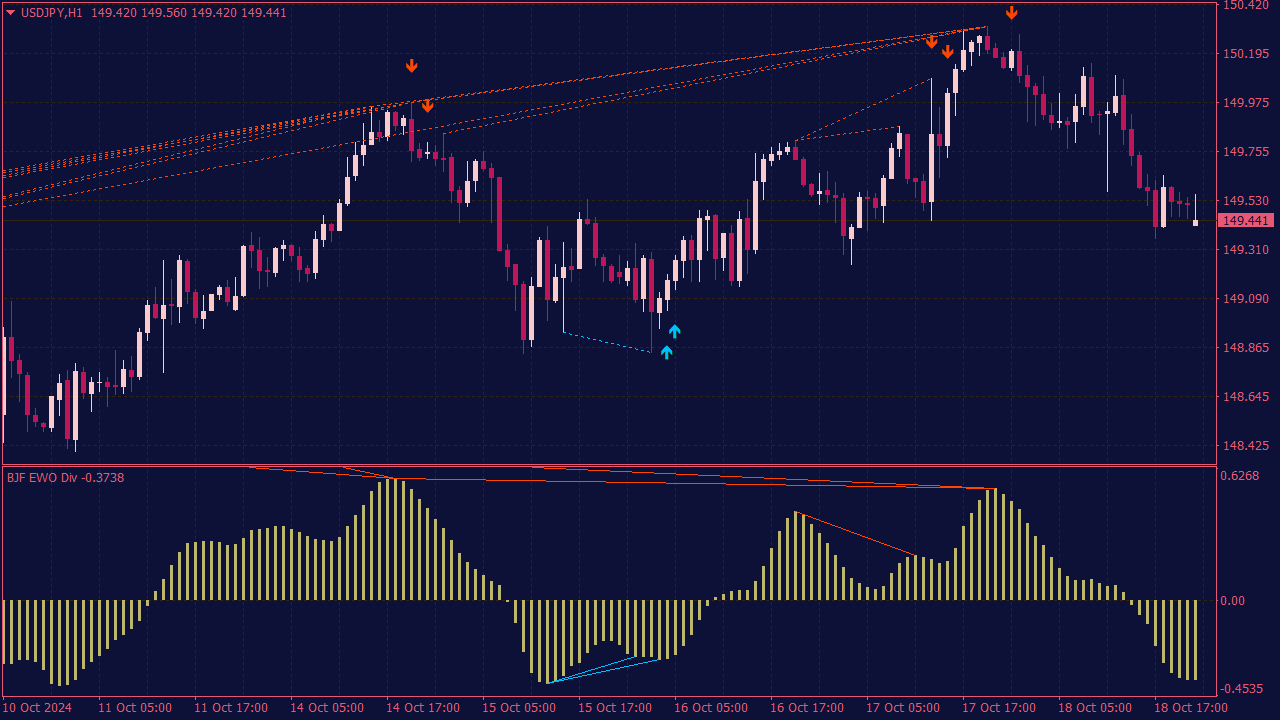
When using the Elliott Waves Oscillator (EWO) in conjunction with divergence for trading, look for confirmation of trend reversals by identifying discrepancies between the price action and the oscillator's readings. For instance, if the price is making a higher high but the EWO is making a lower high, it indicates potential bearish divergence, suggesting a trend reversal might occur. Conversely, bullish divergence occurs when the price hits a lower low while the EWO makes a higher low, indicating a potential upward reversal. To enhance your trading strategy, combine these signals with other technical indicators, such as moving averages or support and resistance levels, ensuring you have a solid risk management plan in place.
The REX Oscillator (Range Expansion Index Oscillator) is a momentum-based technical indicator that measures the strength and direction of price movements. It helps identify overbought and oversold conditions by analyzing price range expansion.
Values above zero suggest bullish momentum.
Values below zero indicate bearish momentum.
Traders use it to spot potential trend reversals, entry/exit points, and short-term trading opportunities. It’s especially useful when combined with trend-following tools or support/resistance levels.
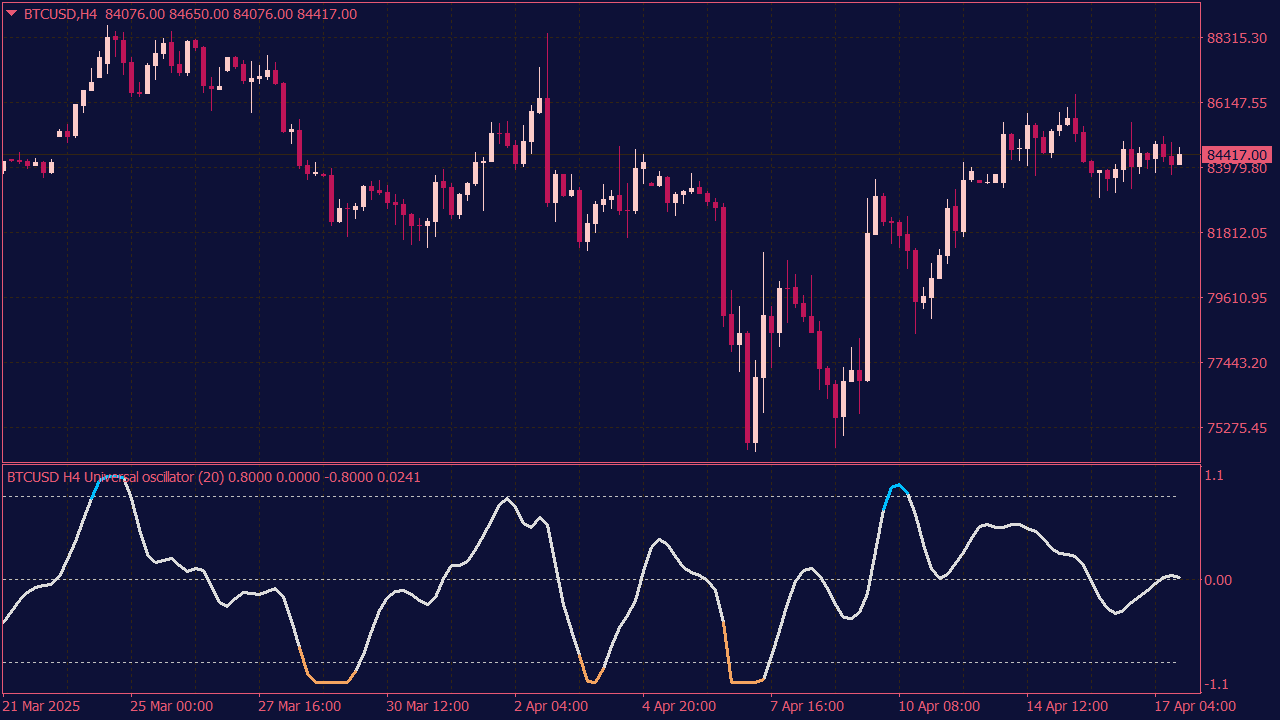
An Overbought/Oversold Indicator is a technical analysis tool used to assess whether an asset's price is trading at an extreme level, suggesting it may be due for a reversal. When an asset is overbought, its price is considered to have risen too quickly and may be at risk of a downturn. Conversely, when an asset is oversold, its price has dropped too sharply and could be set for a bounce.
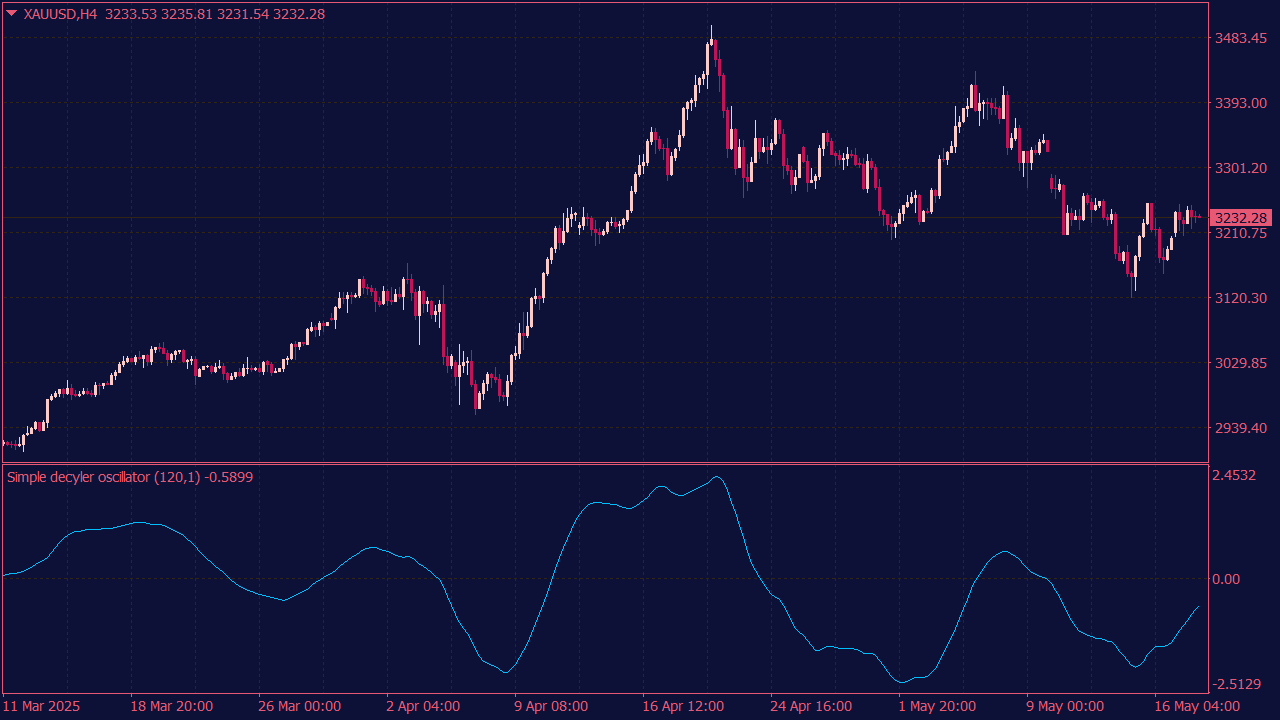
The Simple Decycler Oscillator is a momentum indicator that removes cyclical noise from price data to highlight the underlying trend direction more clearly.
It uses a decycler filter to smooth out short-term fluctuations.
The oscillator shows bullish or bearish momentum based on price movement relative to the decycled trend.
Traders use it to identify clean trend shifts, avoid false signals, and improve entry/exit timing in trending markets.
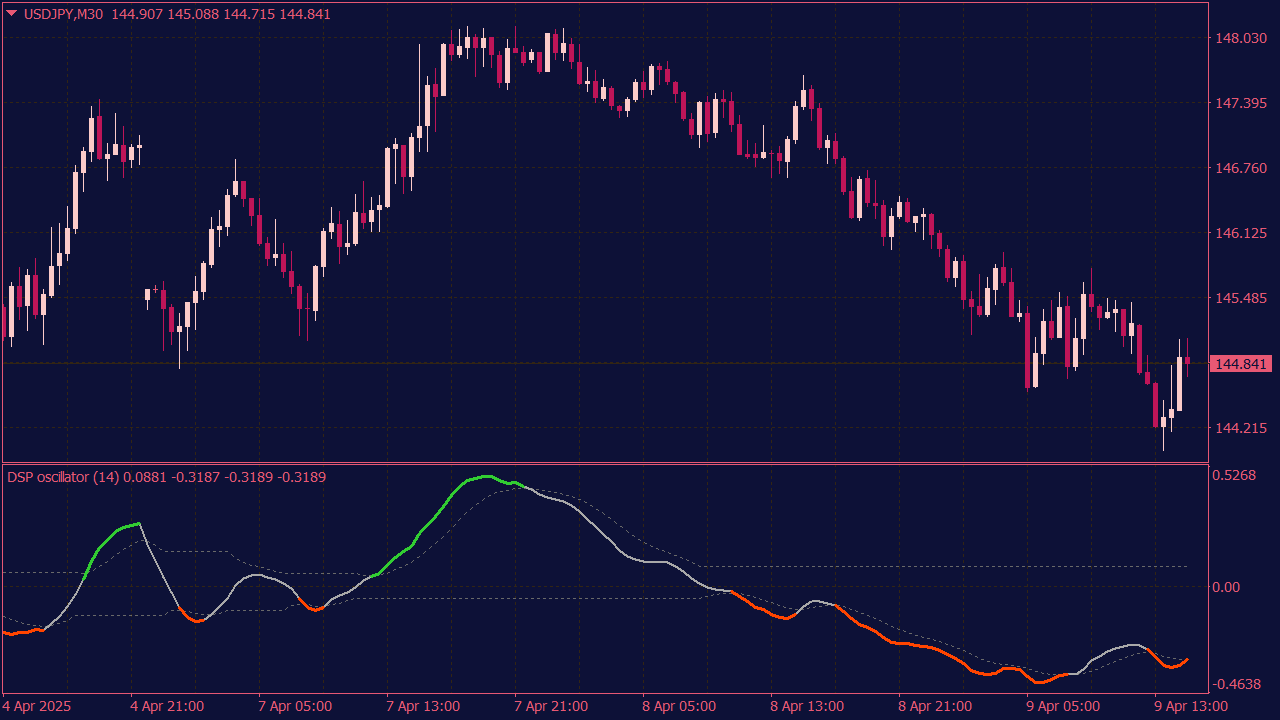
The Detrended Synthetic Price Oscillator is a technical indicator that removes short-term cycles and noise to highlight the underlying trend of price movements.
It uses synthetic price calculations and detrending filters to smooth the signal.
The oscillator fluctuates around a zero line, indicating bullish momentum when above zero and bearish when below.
Traders use it to detect trend direction, reduce lag, and improve entry/exit timing by focusing on the core price action without short-term fluctuations.
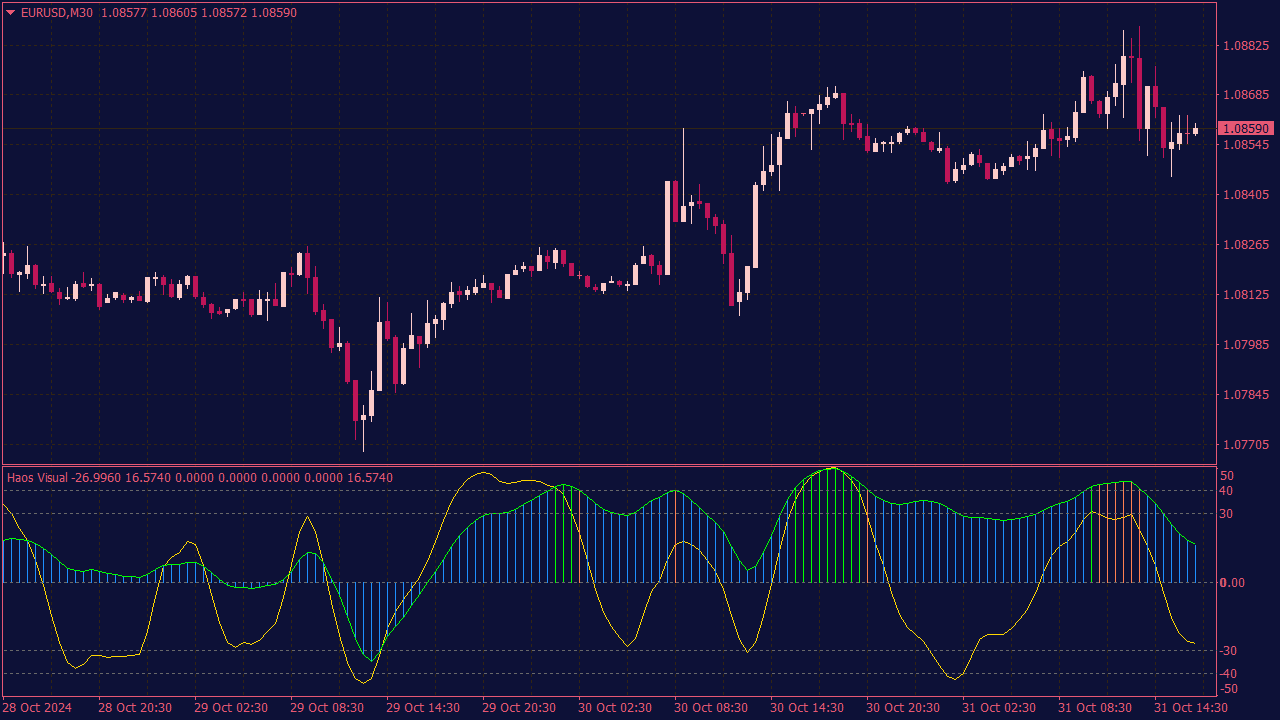
When trading with the Haos Visual Oscillator, consider the following tips: first, use it in conjunction with other indicators for confirmation, as it helps identify trends and potential reversals. Look for divergences between the oscillator and price movements to spot potential entry points. Focus on higher time frames to reduce noise and improve accuracy. Set clear stop-loss levels to manage risk and be patient, allowing trades to mature based on the oscillator signals rather than short-term fluctuations. Finally, always stay updated on market conditions, as they can influence the effectiveness of the indicator.
🕵️ The Oscillator Setups Traders Often Read Too Late
Most Forex traders have used RSI, Stochastic, CCI, or MACD at some point. These tools are easy to add to a chart and even easier to misunderstand.
The problem is not the oscillator itself. The problem is the way many traders read it. An overbought signal becomes a reason to sell, an oversold signal becomes a reason to buy, a divergence becomes a reversal call, and a line cross becomes an entry. That kind of thinking feels structured, but it is often too mechanical for live markets.
Forex rarely moves like a textbook example. A currency pair can stay overbought throughout a strong rally. It can remain oversold while sellers continue to press. Divergence can appear early, repeat several times, and still fail to produce a clean reversal.
That does not make oscillators useless. It simply means they should not be treated as standalone signals.
A better way to use them is to ask what the oscillator is saying about pressure. Is momentum expanding or fading? Is price accepting a level or rejecting it? Did a breakout attract follow-through, or did it trap late traders? Did the oscillator reset while the trend stayed intact?
The useful information is rarely in the first reading. More often, it appears in the reaction that follows.
🧬 1. The RSI Range-Shift
Many traders use RSI the same way in every market. They wait for 70 to consider selling and 30 to consider buying.
That can work in a clean range. It often fails in a strong trend.
In an uptrend, RSI may never fall to 30. It may pull back only toward 40 or 50 before buyers return. In a downtrend, RSI may struggle to reach 70 and fail around the 50–60 area before sellers regain control.
That range shift is useful because it shows whether the trend is still healthy.
In a bullish environment, watch for price making higher highs and higher lows while RSI holds above 40 or quickly reclaims 50. If price is also holding above a former resistance zone or higher-time-frame support, the pullback may be a reset rather than a reversal.
In a bearish environment, the opposite applies. Price continues to form lower highs, RSI recovers only into the middle zone, and the rally fails near resistance. If short-term support breaks after that, sellers may still have the upper hand.
The important point is simple: in strong trends, the best oscillator signal is not always an extreme reading. Sometimes it is the refusal to reach one.
🪤 2. The Failed Oversold Bounce
Oversold readings can be dangerous because they make a market look cheap.
Price drops sharply. RSI falls below 30. The candles look stretched. Traders begin looking for a bounce because the move feels overdone.
Then the bounce comes, but it is weak. Price cannot reclaim the broken level. RSI barely recovers. Buyers appear, but they do not change the structure. Instead of reversing, the market pauses and then continues lower.
A failed oversold bounce often develops like this:
Price breaks below support.
RSI moves into oversold territory.
Price bounces into the broken support area.
RSI fails to reclaim the 50 zone.
Price forms a lower high.
Sellers break the next intraday low.
This is not a bargain setup. It is a continuation setup that looks like a bargain at first glance.
Oversold tells us that downside momentum has been intense. It does not tell us that buyers are strong. The bounce after the oversold reading is what matters.
If the bounce is aggressive, there may be demand. If the bounce is weak, the market may only be preparing for another leg lower.
🔥 3. The Overbought Hold
The overbought hold is one of the setups many traders misread because it goes against the usual beginner logic.
Price breaks above resistance. RSI moves above 70. Traders expect a pullback. Some start shorting immediately because the market looks stretched.
But price does not fall. It holds near the highs. Pullbacks stay shallow. RSI cools down, but remains above the middle zone. Eventually, price pushes higher again.
That behavior suggests acceptance, not exhaustion.
A bullish overbought hold may include:
A break above an important resistance area
RSI moving into overbought territory
A shallow pullback rather than a sharp rejection
RSI staying above 50 during the reset
Price holding above the breakout zone
A fresh push into new highs
The reading itself is not the key. The reaction after the reading is the key.
Overbought with rejection can warn of exhaustion. Overbought with acceptance can confirm strong demand. The same indicator reading can mean two different things depending on what price does next.
💧 4. Liquidity Sweep Divergence
Basic divergence is easy to spot, but it is often early. A stronger version appears after price sweeps a visible level and fails to continue.
Imagine price breaking below a previous low. Stops are triggered. Breakout sellers enter. The chart looks bearish. But RSI or Stochastic does not confirm the new low. Price then closes back above the broken level.
That is more interesting than ordinary divergence. It means price made a new low, but momentum did not support it. It also means traders who sold the breakdown may now be trapped.
A bullish version may look like this:
Price sweeps below a previous low.
The oscillator forms a higher low.
Price closes back above the swept level.
Sellers fail to push price back down.
Price breaks short-term resistance.
The bearish version is similar. Price sweeps above a previous high, the oscillator forms a lower high, price closes back below the breakout level, and buyers fail to reclaim control.
The sweep gives the divergence context. Without the sweep, divergence is only a warning. After a failed sweep, it may show that one side of the market has used its fuel and failed to continue.
Location matters. Divergence in the middle of a noisy chart is weak. Divergence after a failed break of a visible level deserves closer attention.
🕰️ 5. The Second Signal
The first oscillator signal often attracts impatient traders. The first oversold reading attracts early buyers; the first overbought reading attracts early sellers; and the first divergence attracts traders who want to catch the exact turning point.
The second signal is often cleaner because it tells us whether the first reaction had any real follow-through.
A bullish second signal may develop when RSI becomes oversold near support and price bounces, but not strongly enough to confirm a reversal. Price then retests the low. This time, RSI forms a higher low. If price reclaims minor resistance after that, sellers may be losing control.
A bearish version works in reverse. RSI becomes overbought near resistance, price pulls back, and then price retests the high while RSI forms a lower high. If price then breaks short-term support, buyers have failed on the second attempt.
This setup is not exciting because it requires patience. It usually means missing the absolute high or low. But that is the point: the first signal feels early, while the second signal is often more informative.
🧲 6. The Round Number Fakeout
Round numbers matter in Forex because traders react to them.
Levels such as 1.1000, 1.2500, 1.3000, 150.00, and 160.00 often attract stops, breakout orders, profit-taking, and emotional decisions. They are not magic levels, but they can become useful reference points.
A bearish round-number fakeout may unfold like this:
Price pushes above a major round number.
RSI becomes overbought.
Breakout buyers enter.
Price fails to hold above the level.
Momentum weakens.
Price closes back below the round number.
Structure turns bearish.
A bullish fakeout is the reverse: price breaks below a round number, RSI becomes oversold, sellers enter the breakdown, but price fails to stay below the level. If momentum refuses to confirm and price closes back above the number, the breakdown becomes suspicious.
The setup is not based on the round number alone. It is based on the failed acceptance around that number.
Price crossed the level, momentum did not support continuation, and the market rejected the move. That combination is what makes the level useful.
🏦 7. The Candle Close Verdict
A wick shows emotion. A close shows acceptance or rejection.
That distinction matters when using oscillators.
During a candle, a breakout can look convincing. Price spikes above resistance, RSI becomes overbought, and momentum appears strong. But if the candle closes back below resistance, the story changes. The market tested higher prices and refused to accept them.
A bearish version may appear when price spikes above resistance while RSI is overbought or diverging. The breakout looks valid intrabar, but the candle closes back below the level. If the next candle fails to reclaim the high, the rejection becomes more meaningful.
A bullish version appears when price spikes below support while RSI is oversold or diverging. The breakdown looks convincing during the candle, but price closes back above support. If the next pullback holds above the low, the market may have rejected lower prices.
This is especially useful on the one-hour, four-hour, and daily charts. A level can look broken during the candle, but if the market refuses to close beyond it, the breakout may not have been accepted.
The oscillator gives the pressure reading. The candle close gives the verdict.
🧨 8. Compression Ignition
Many traders ignore quiet charts. That can be a mistake.
Before strong moves, oscillators often go flat. RSI sits around 45–55. CCI hovers near zero. The MACD histogram becomes small. Candles narrow. Nothing seems to be happening.
Sometimes that quiet phase is not useless. It is compression.
A compression ignition setup usually has three parts:
Price forms a tight range.
The oscillator flattens near the middle.
Price breaks the range and the oscillator expands in the same direction.
The goal is not to predict the breakout before it happens. The goal is to wait until momentum wakes up.
If price breaks the range but the oscillator remains flat, the move may be weak. If price breaks and momentum expands at the same time, the move deserves more attention.
Quiet markets can be frustrating. But when pressure has been building for hours, the first clean expansion can matter.
🌍 9. The London Range Trap
Forex has rhythm. The Asian session often builds the range. London often tests it. New York often decides whether the move continues or reverses.
One useful intraday setup appears when London breaks one side of the Asian range and then fails.
A bullish London trap may look like this:
The Asian session forms a tight range.
London breaks below the Asian low.
Sellers enter the breakdown.
RSI fails to expand lower.
Price returns inside the range.
Price later breaks above the Asian high.
A bearish version is the opposite. London breaks above the Asian high, buyers enter, momentum fails to expand, price falls back inside the range, and the market later breaks below the Asian low.
The first move is not always the real move. Sometimes it is only a liquidity test.
The oscillator helps answer a useful question: did momentum support the breakout, or did price move without real participation?
If price breaks and momentum does not follow, the breakout deserves suspicion.
📉 10. The MACD Histogram Fade
Many traders use MACD too late. They wait for the lines to cross, but by then a large part of the move may already be underway.
The histogram can give earlier clues because it shows whether momentum is expanding or fading.
A bearish MACD fade may look like this:
Price rallies into resistance.
The MACD histogram is positive.
Positive bars begin shrinking.
Price fails to make a convincing new high.
The histogram flips negative.
Price breaks short-term support.
A bullish version begins with price falling into support while the histogram is negative. If the negative bars begin shrinking, price stops making strong lower lows, and the histogram later flips positive as price breaks short-term resistance, momentum may be transferring from sellers to buyers.
The histogram is not about catching the exact top or bottom. It is about watching one side lose control.
Shrinking bars suggest the current move is losing force. Expanding bars suggest pressure is building. Around important levels, that transition can be valuable.
🪙 11. Cross-Pair Confirmation
Forex pairs do not move in isolation.
If EUR/USD shows bullish divergence, but GBP/USD, AUD/USD, and NZD/USD are still falling while the dollar remains strong, the EUR/USD signal may be weaker than it looks.
A better question is whether the setup is supported by broader currency flow.
A simple check:
Identify the oscillator setup on the main pair.
Check related pairs.
Look at whether the same currency is strong or weak elsewhere.
Avoid trades where the signal is isolated and the broader theme disagrees.
For example, EUR/USD bullish divergence carries more weight if GBP/USD is also stabilizing, AUD/USD is reclaiming support, and USD/CHF is rejecting resistance.
The goal is not to overcomplicate the chart. It is to avoid treating one isolated signal as if it represents the whole market.
Momentum is more interesting when it appears across related pairs.
🧱 12. The Remove-the-Indicator Test
This may be the most useful filter of all.
Before entering, mentally remove the oscillator from the chart and ask: Would this trade still make sense?
If the answer is no, the setup is probably weak.
A strong trade should still have a reason based on price:
A key support or resistance level
A failed breakout
A liquidity sweep
A trend pullback
A session high or low
A structure shift
A clear invalidation point
The oscillator should improve timing. It should not be the entire reason for the trade.
If the only argument is “RSI is oversold,” there is no real setup. There is only an indicator reading.
🧠 The Real Desk Edge
The real edge is not a hidden RSI setting, a secret Stochastic formula, or a perfect MACD combination.
It is interpretation.
Most traders see a signal and react. Better traders read the situation around the signal.
They ask:
Did price accept or reject the level?
Did momentum confirm the breakout?
Did the move sweep liquidity first?
Did the oscillator reset without damaging the trend?
Did the first signal fail?
Did the second signal confirm?
Is the setup aligned with the higher time frame?
Does the trade still make sense without the indicator?
Oscillators do not tell traders what will happen next. They show pressure, exhaustion, hesitation, and momentum transfer. They can reveal when a move is being supported — or quietly abandoned.
The beginner trades the indicator.
The stronger trader trades the story the indicator helps reveal.
And in Forex, that story often begins exactly where the obvious signal fails.
📝 Editor’s Note
The strategies and market concepts discussed in our content are designed to help readers better understand market behavior. They are not trading recommendations. Financial markets are volatile, and every trader should test ideas carefully, manage risk and make independent decisions.