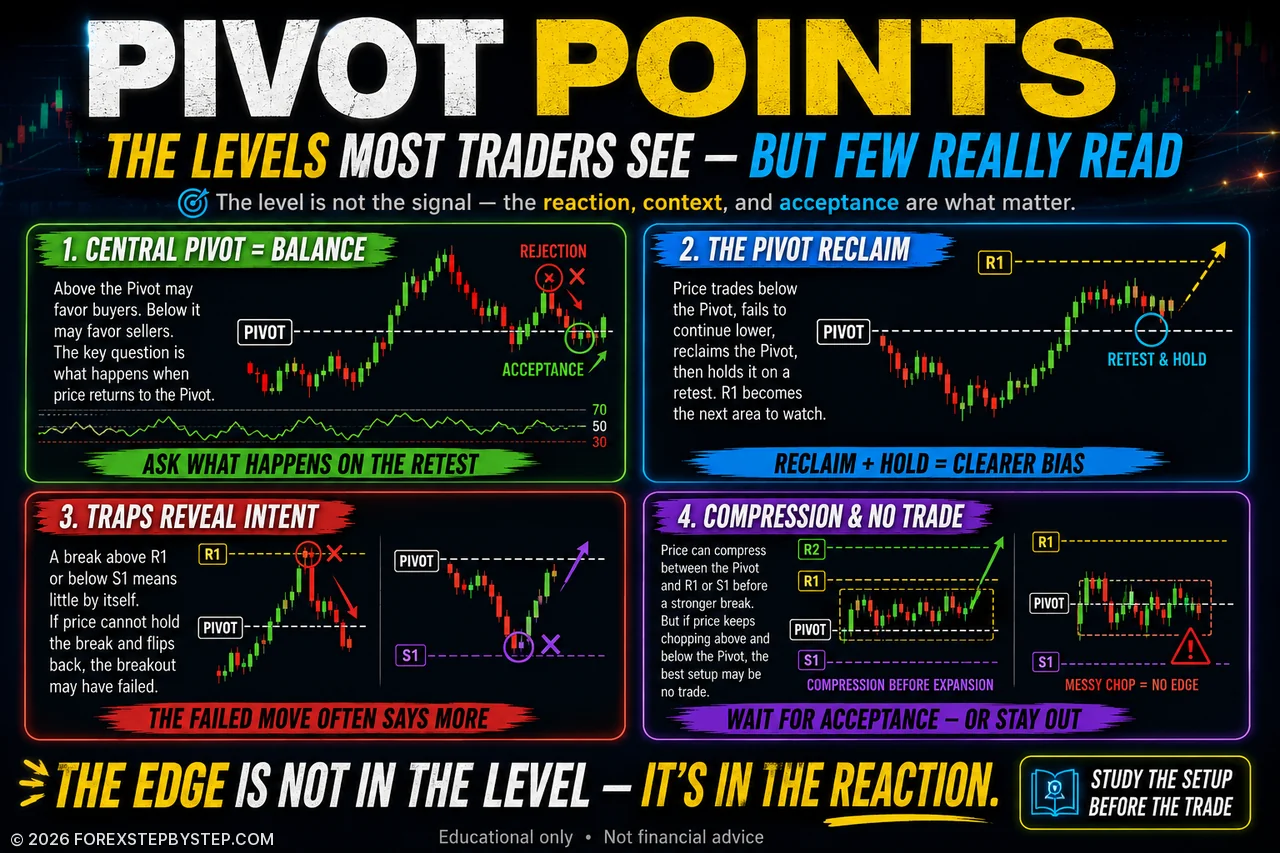
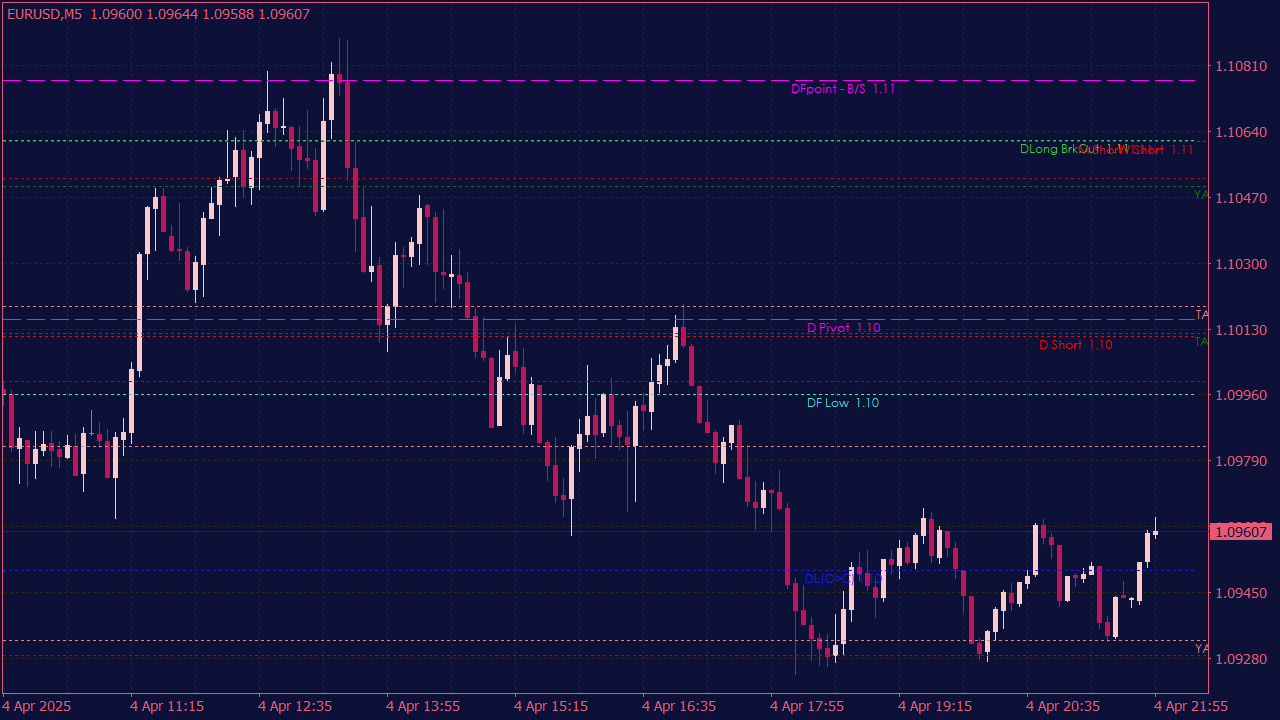
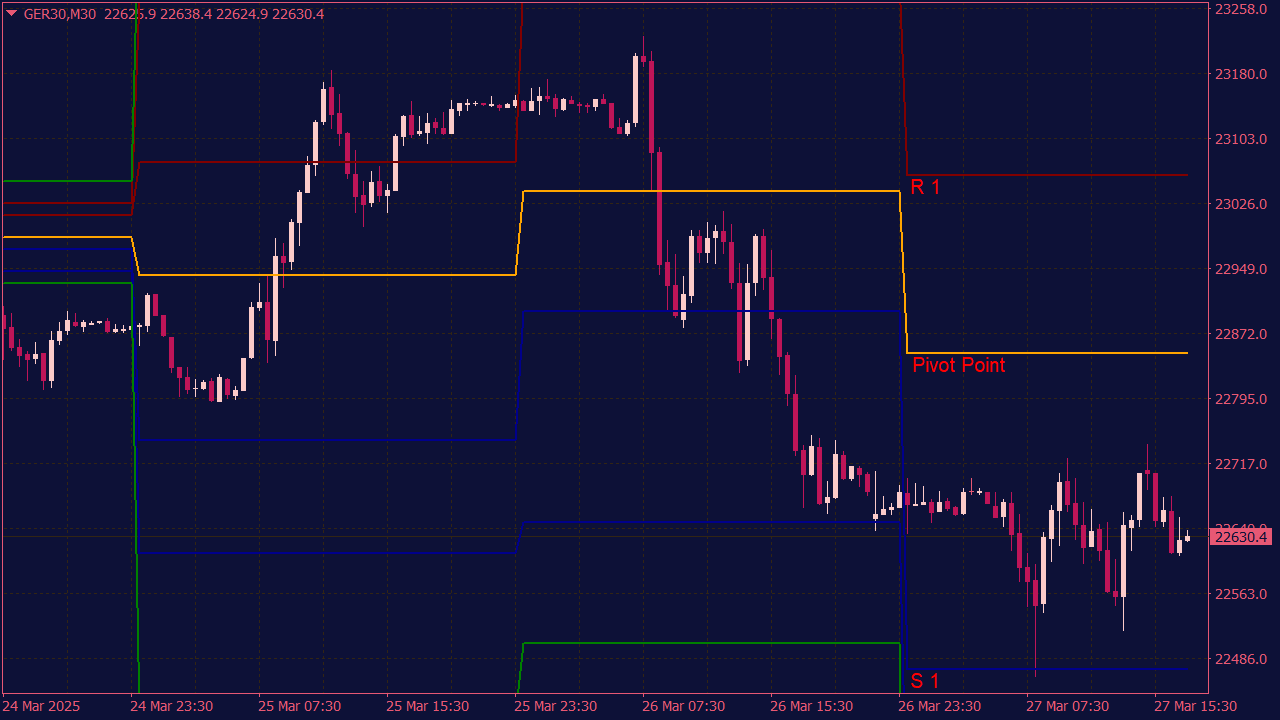
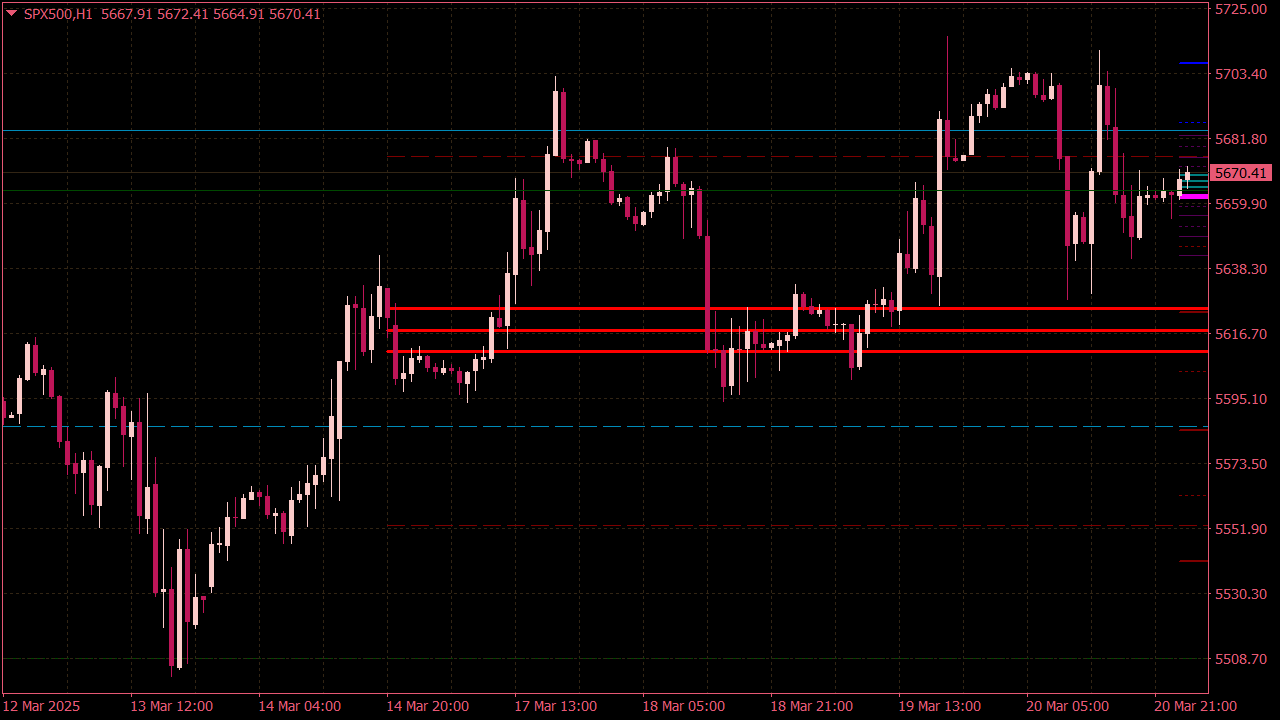
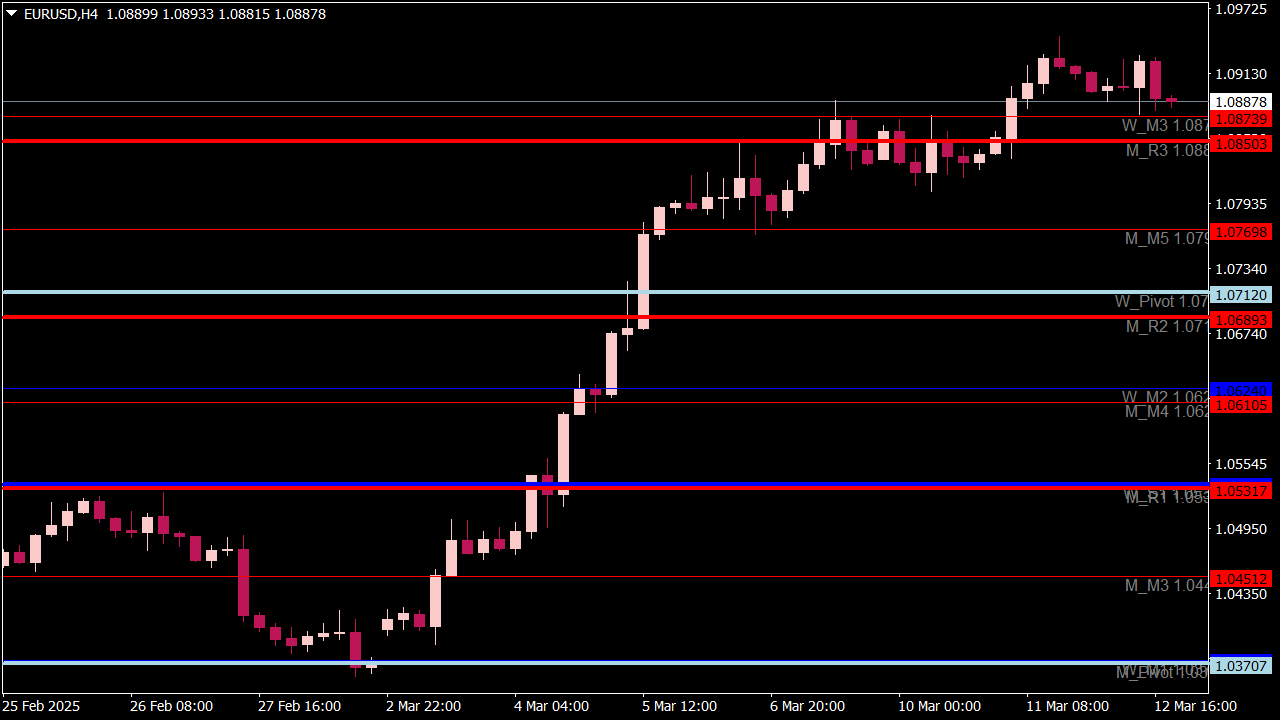
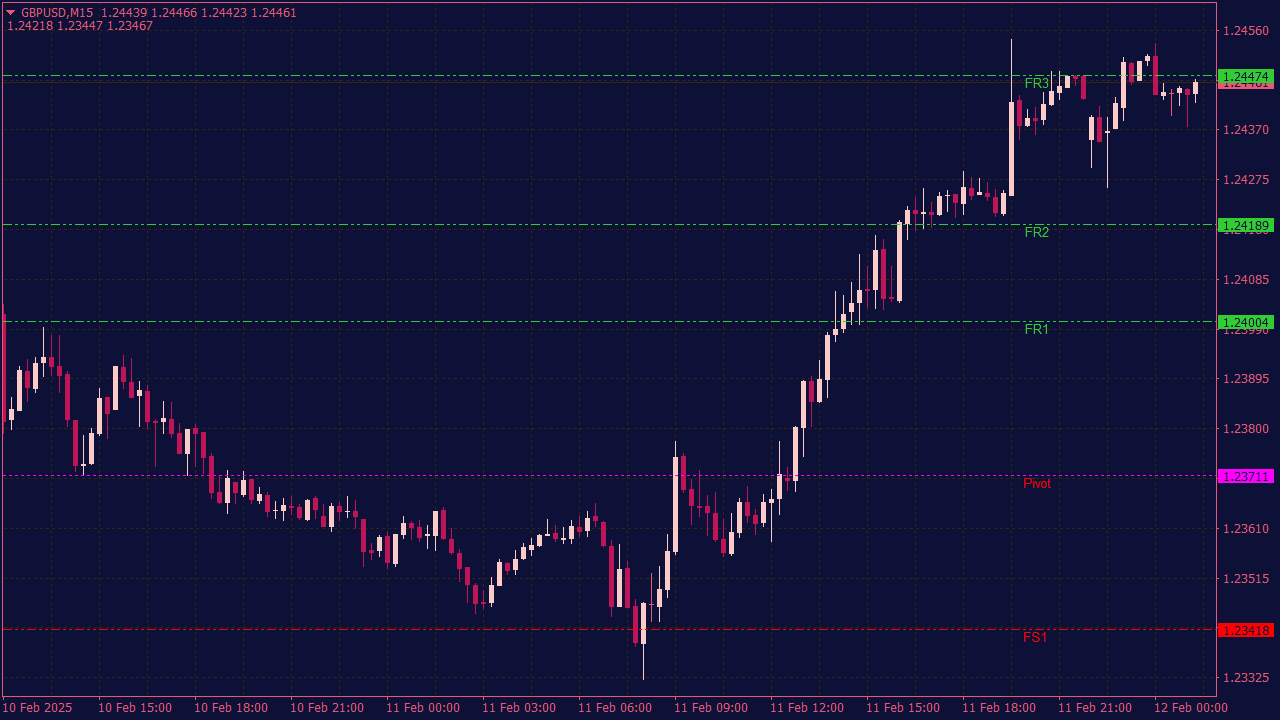
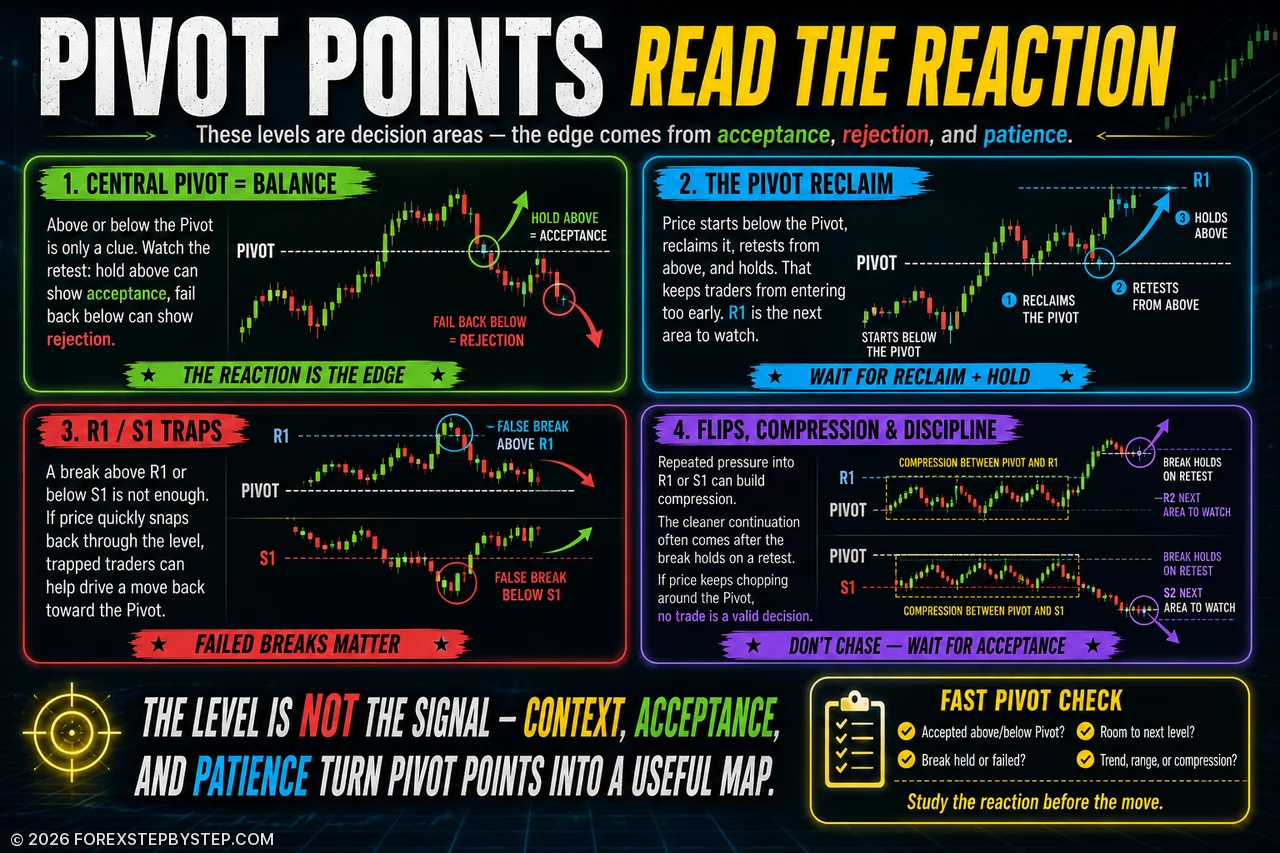
A Pivot level sets the stage—but the retest reveals whether price is accepting, rejecting, or trapping traders.
🪤 Pivot Points: Where Most Traders Read the Chart Wrong
Most traders add Pivot Points to their charts and treat them like clean lines: support here, resistance there. But the chart usually has more to say.
A touch of R1 might be a real rejection, or it might be bait for late buyers. A break below S1 can signal weakness, or it can trap sellers before price snaps back toward the central Pivot.
This short guide looks at the moments most traders rush through: reclaims, failed breaks, London sweeps, level flips, compression, exhaustion, and the setup that sounds boring but often saves capital: no trade.
Before you follow another Pivot level blindly, look closer. The real question is not where the line is. It is what price does when everyone else is already reacting.
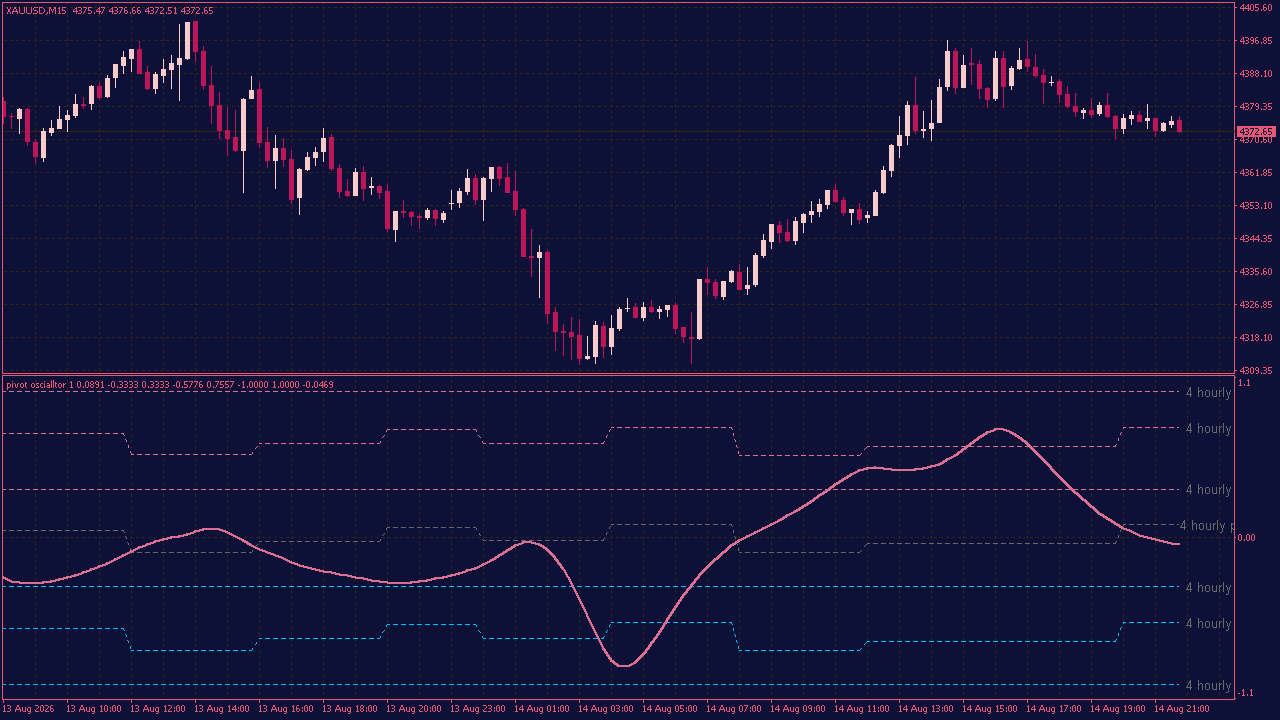
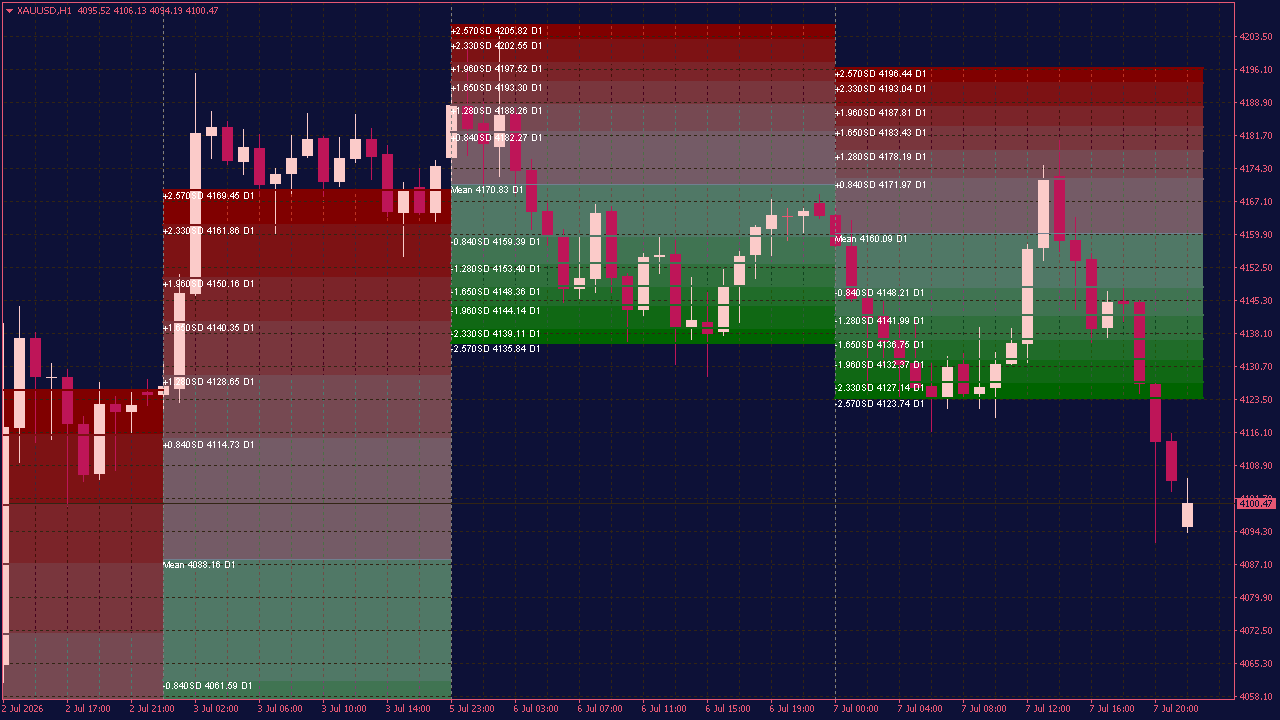
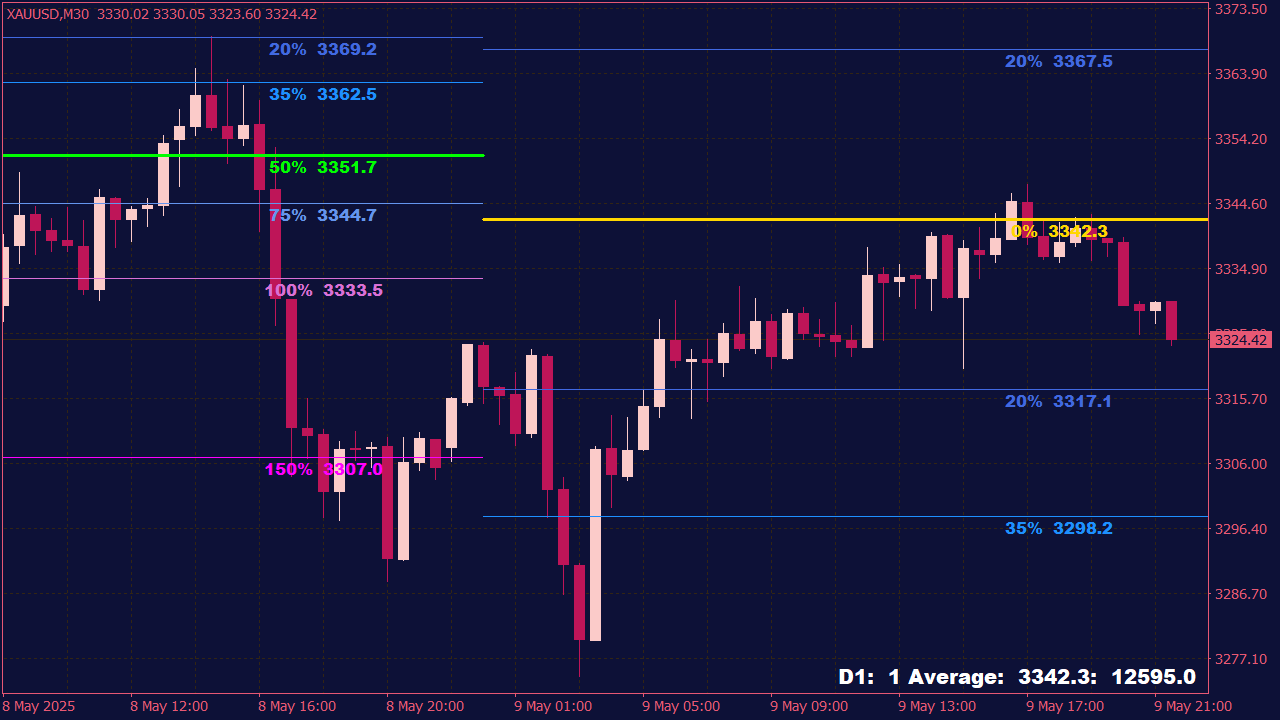
The Pivot Oscillator Smoothed Indicator takes the usual pivot-point idea and turns it into something that feels much easier to read. Instead of checking several levels across the chart, you can follow how price moves through the pivot structure inside one oscillator and quickly see whether the market is closer to support, resistance, or somewhere in between. What makes it interesting is how differently the oscillator can behave around the same type of level. Sometimes it reacts straight away. Sometimes it slows down, stays near the zone, and only then decides where to go next. And every now and then, it moves through a level with almost no reaction at all. Those small details can tell you more than the level itself. There is no need to look for one perfect signal. The interesting part is simply watching how the line behaves and comparing that with what price is doing on the chart. After a while, you may start noticing certain reactions earlier—and that is usually where this indicator becomes much more interesting.
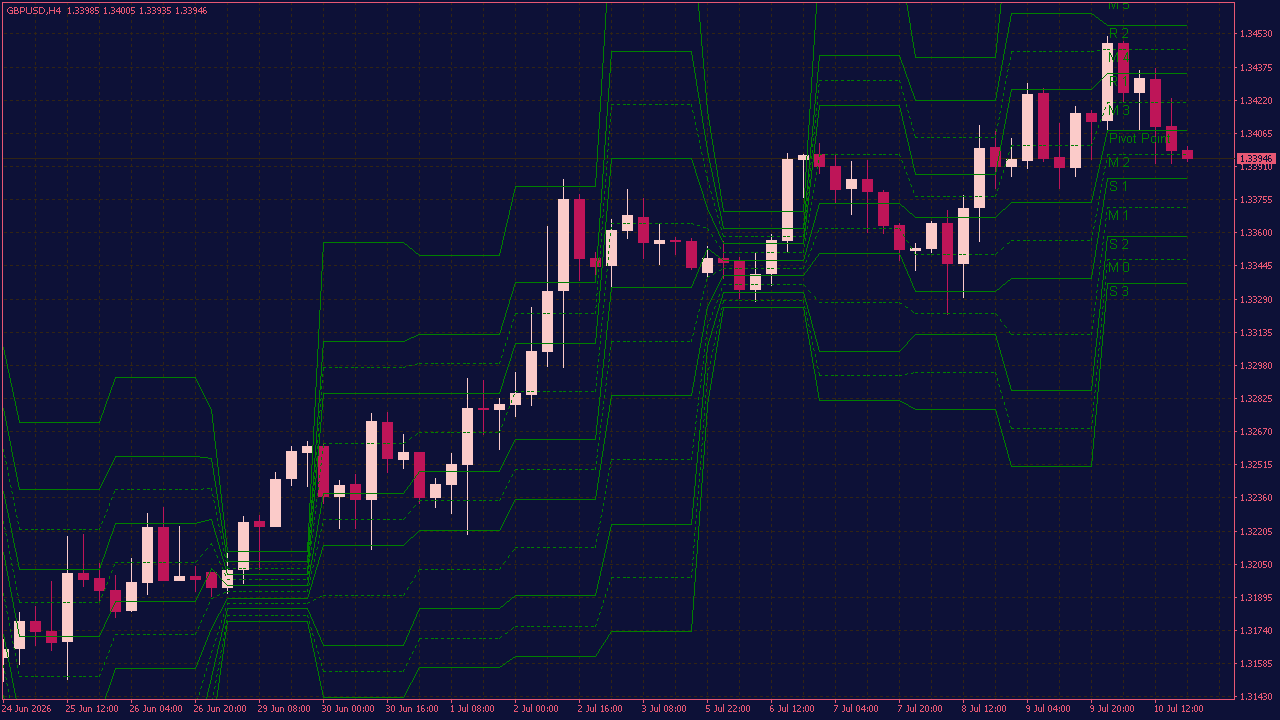
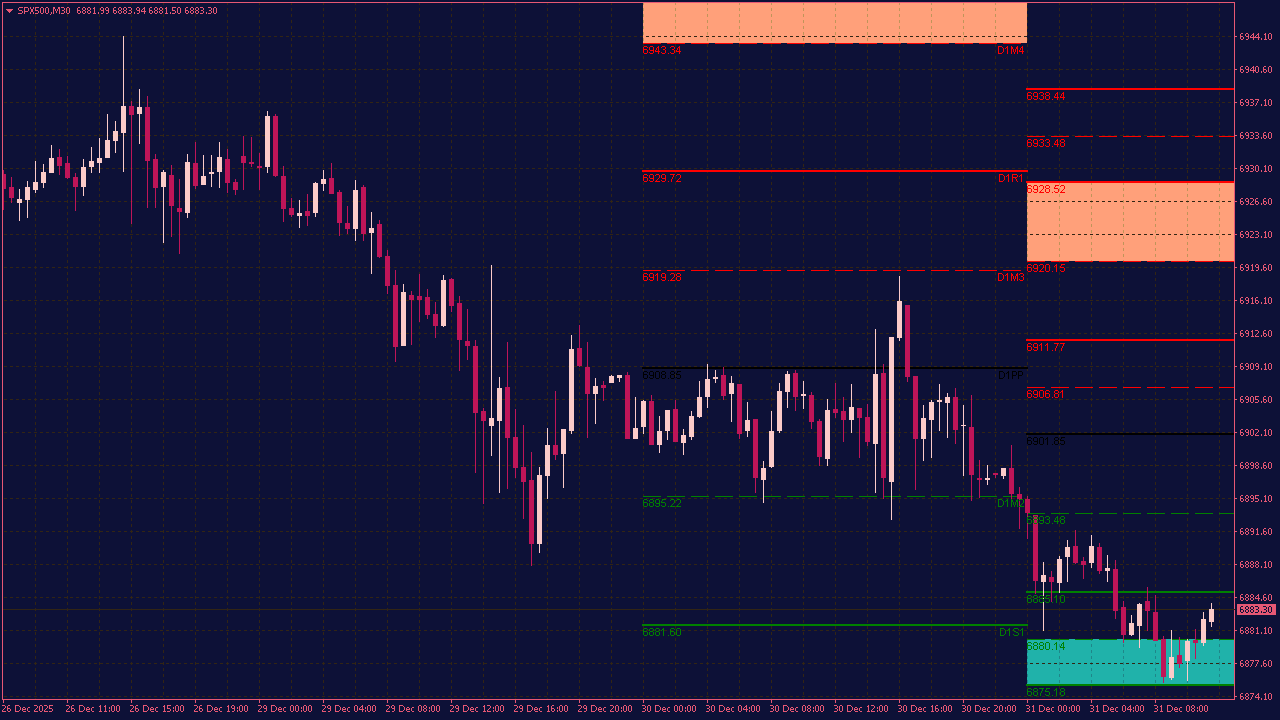
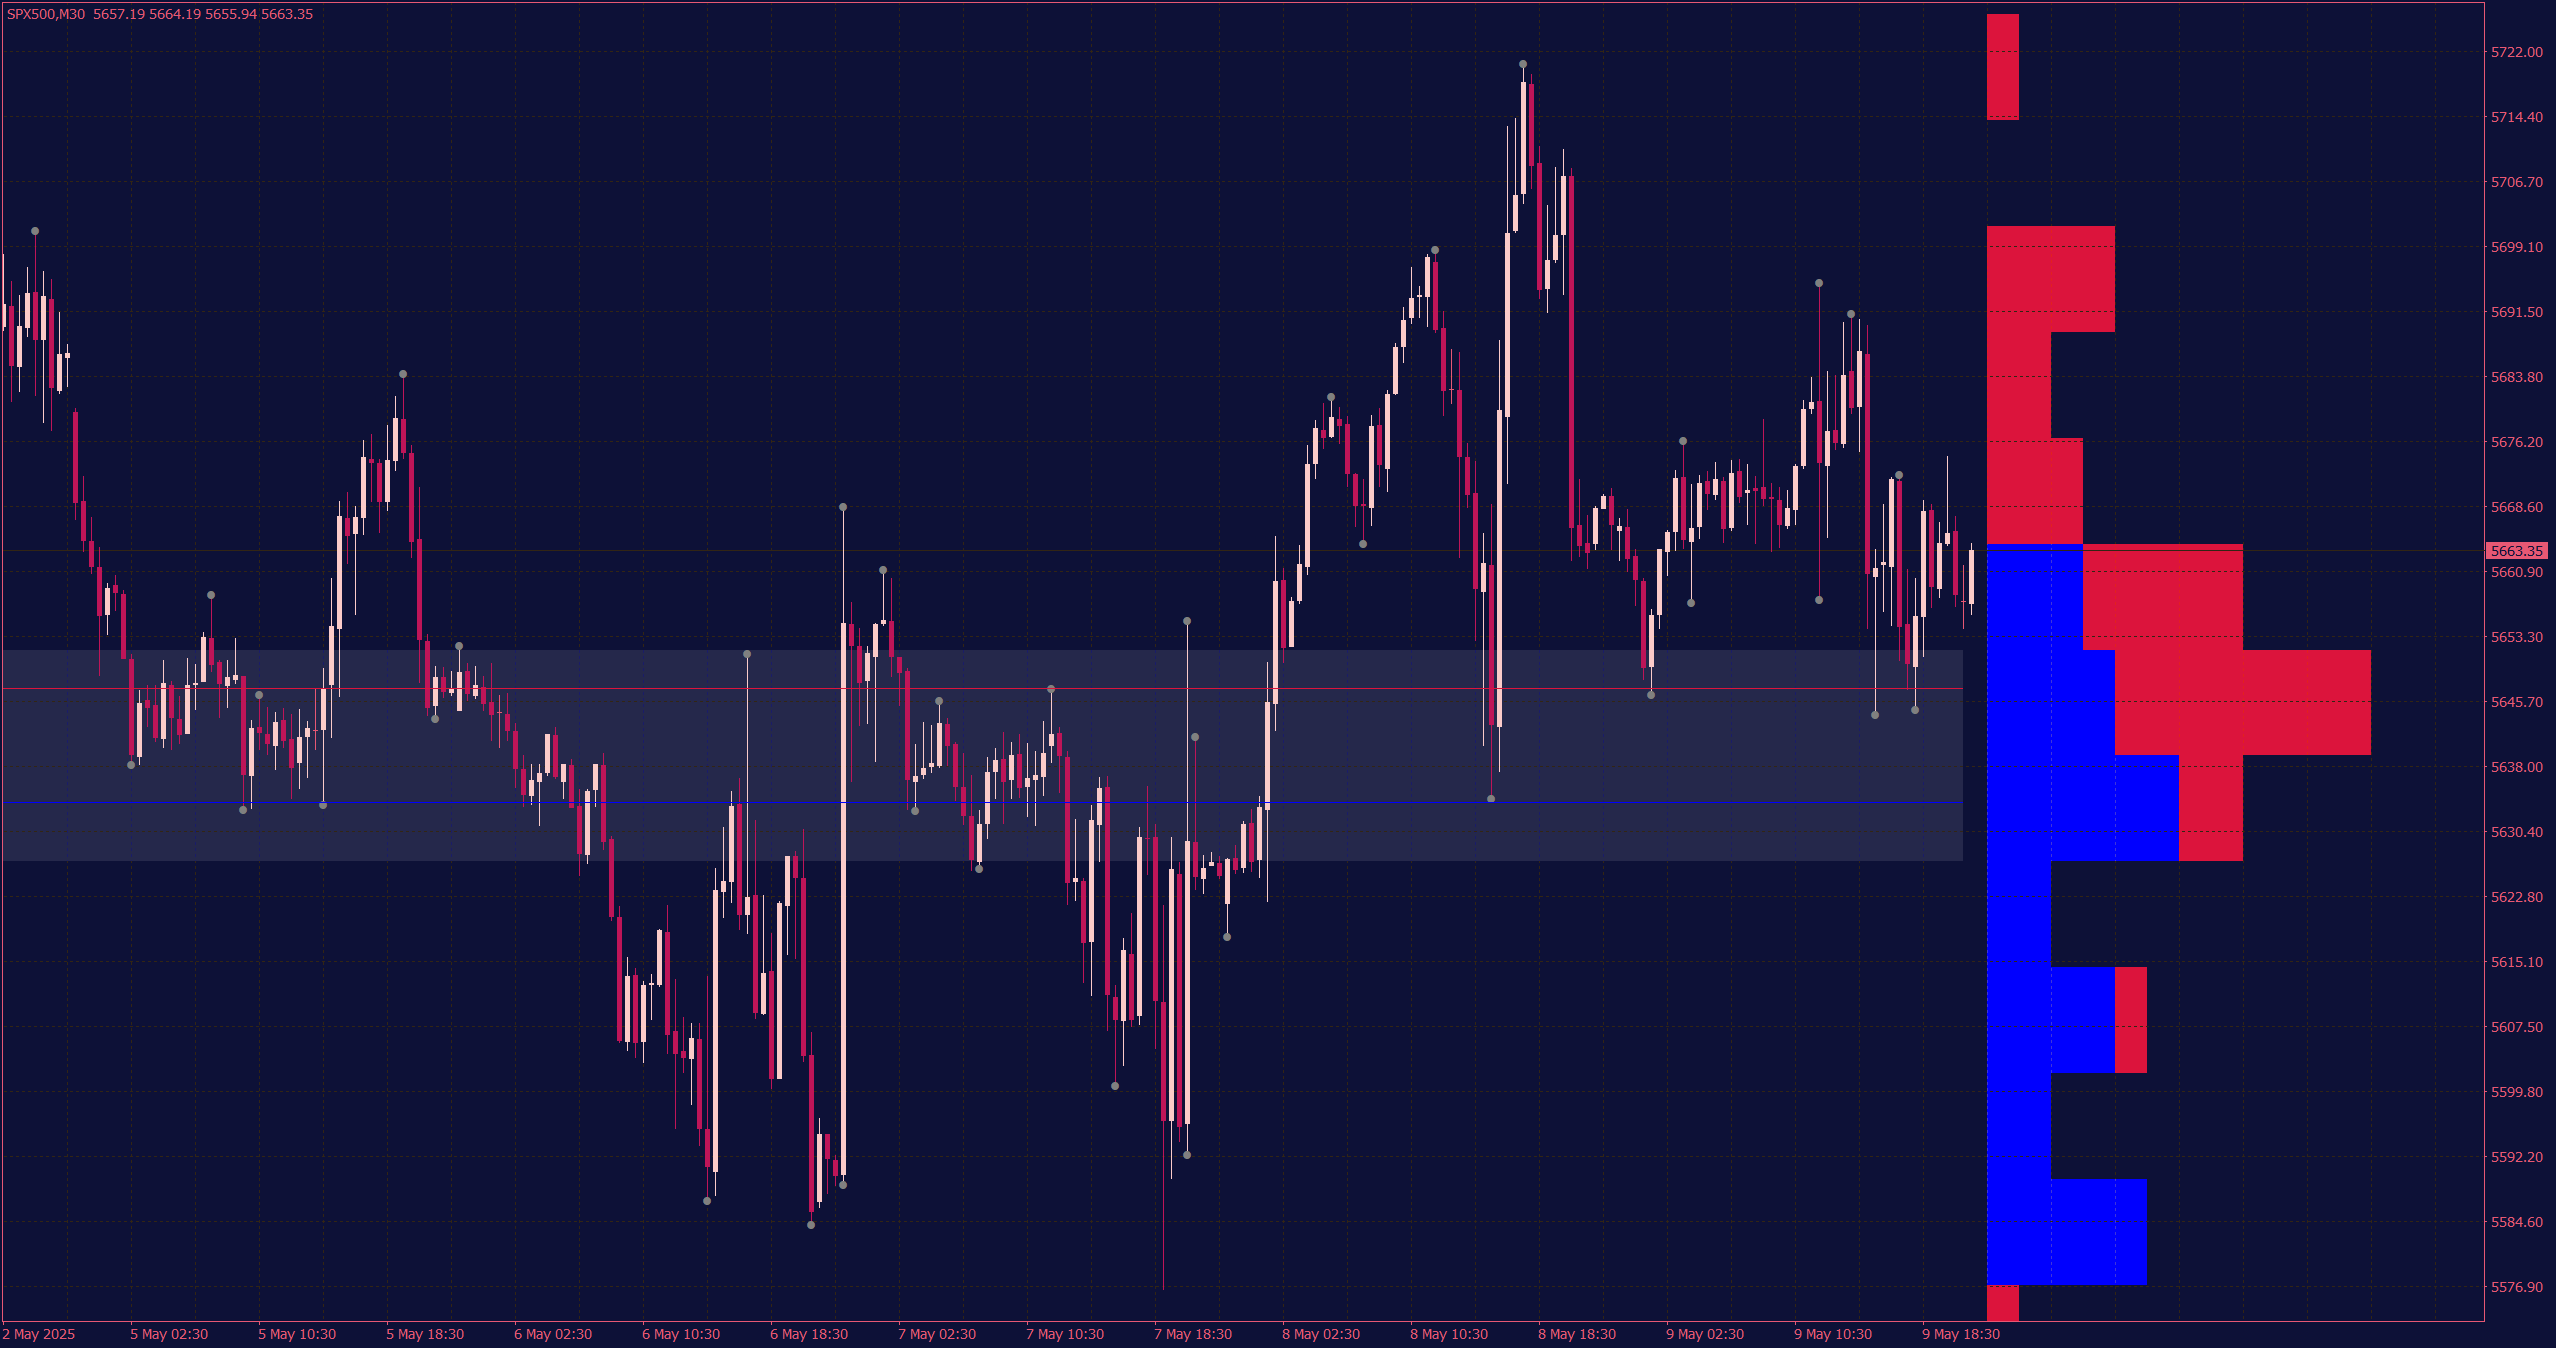
The Pivots with Mid Levels Indicator adds a practical set of price levels to the chart, including the main pivot point, support and resistance areas, and several levels in between. This makes it easier to see where the market may slow down or become more active during the day. The mid-levels are especially useful because price does not always move directly from one major level to another. It may pause, bounce, or change direction somewhere in between. These smaller reaction zones can provide helpful context when watching short-term price movements. No level can predict what the market will do next, but they can make certain reactions easier to notice. After using the indicator for a while, you may start to see that some of the quieter levels are often more interesting than the obvious ones.
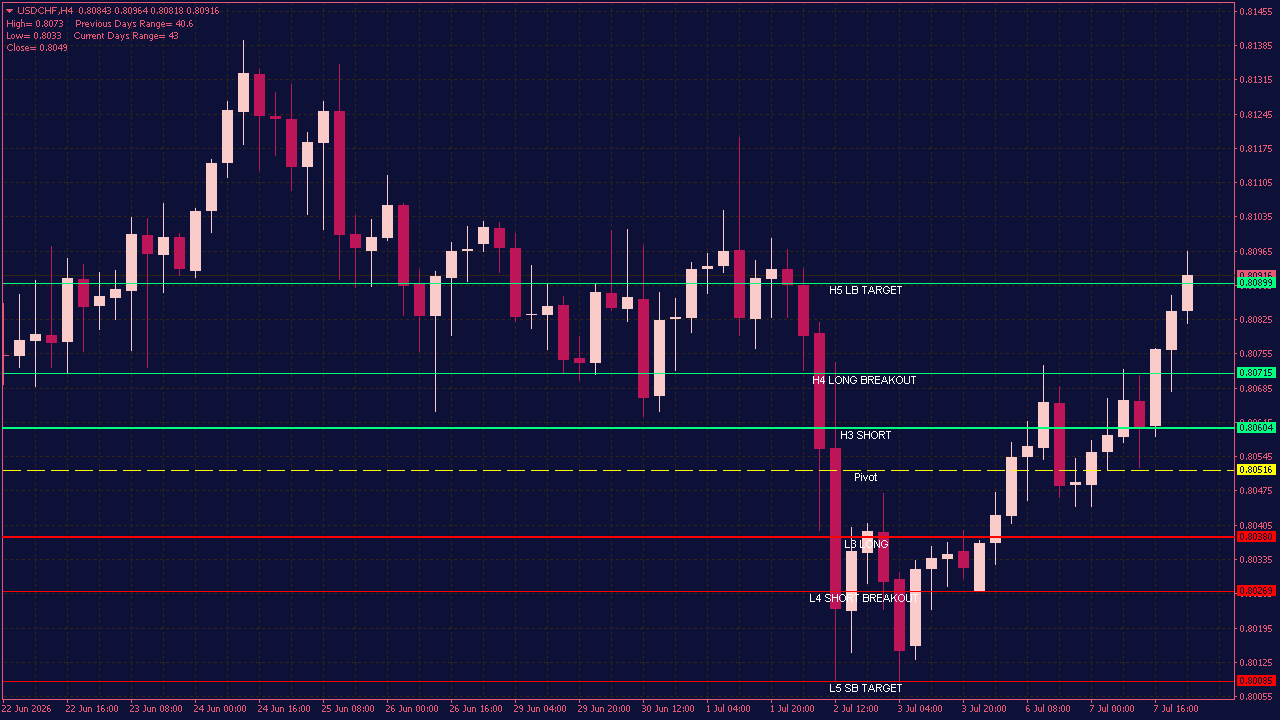
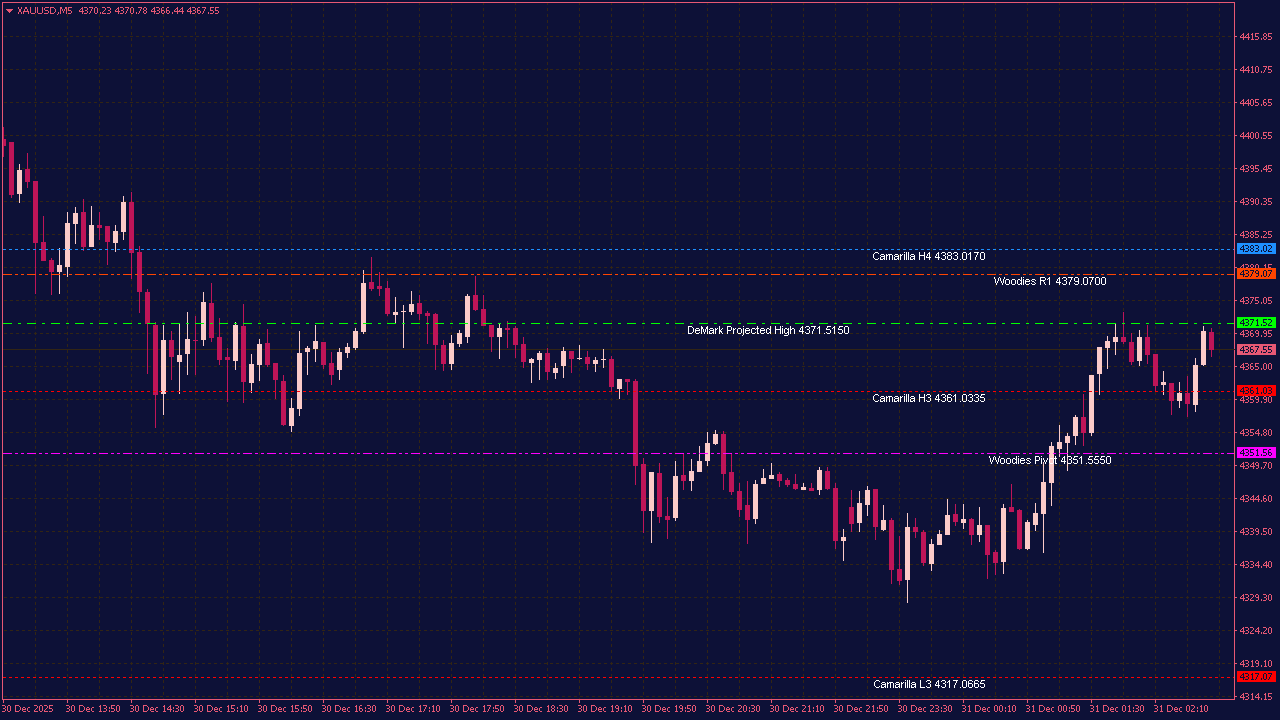
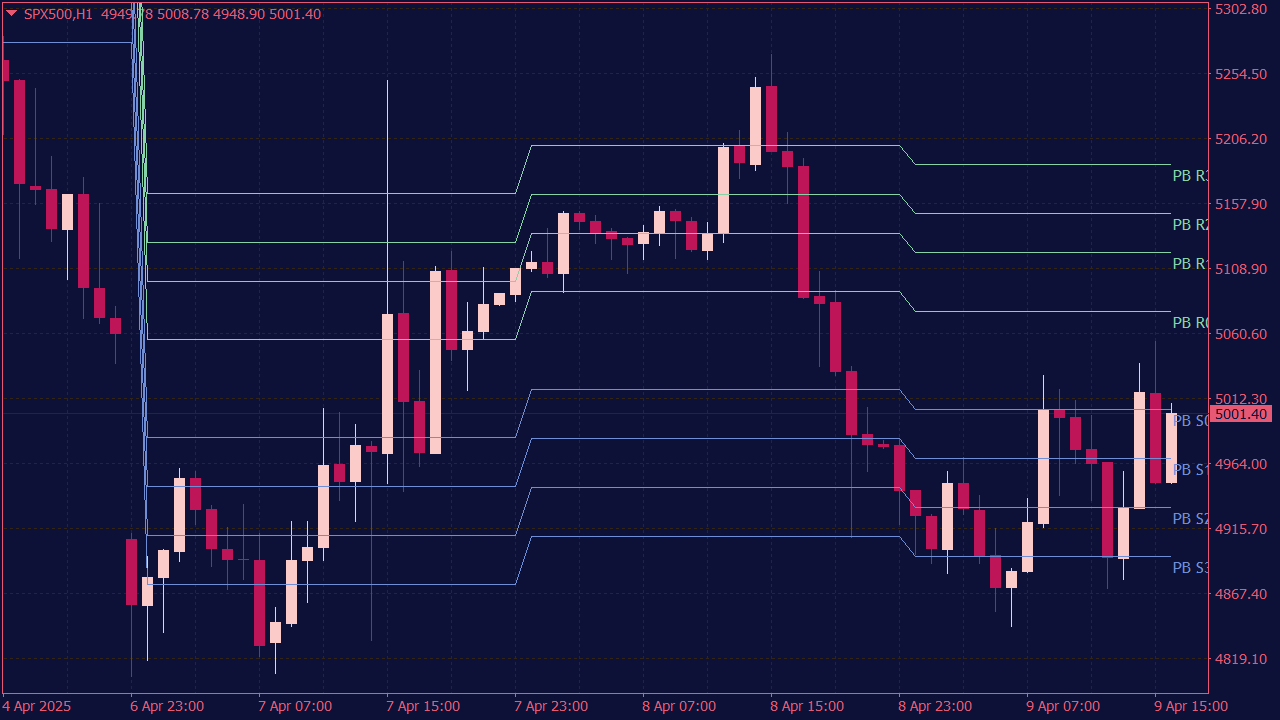
The Camarilla Pivot Points Indicator helps traders focus on price levels that may matter before the market actually reaches them. Instead of looking at a blank chart and guessing where the next reaction could happen, you get a clear set of Camarilla support and resistance zones to work with. What makes these levels interesting is not that price reacts to them every time, but that they often mark areas worth paying attention to. When price approaches levels such as H3, L3, H4, or L4, it can be a good moment to watch how the market behaves — whether it rejects the level, breaks through it, or starts to slow down. You can adjust the indicator to match your own chart setup, including alerts, pivot levels, Fibonacci levels, standard pivots, and mid-pivots. It is a practical tool for traders who like to plan ahead instead of reacting only after the move has already happened.
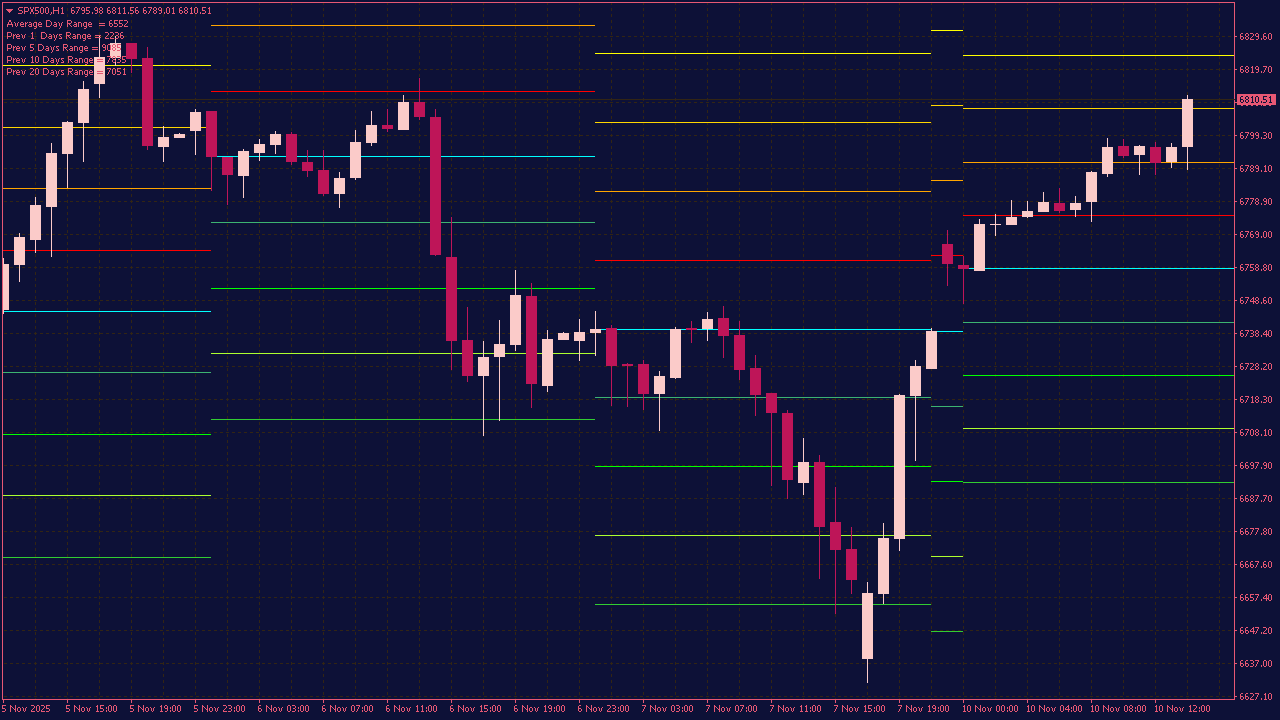
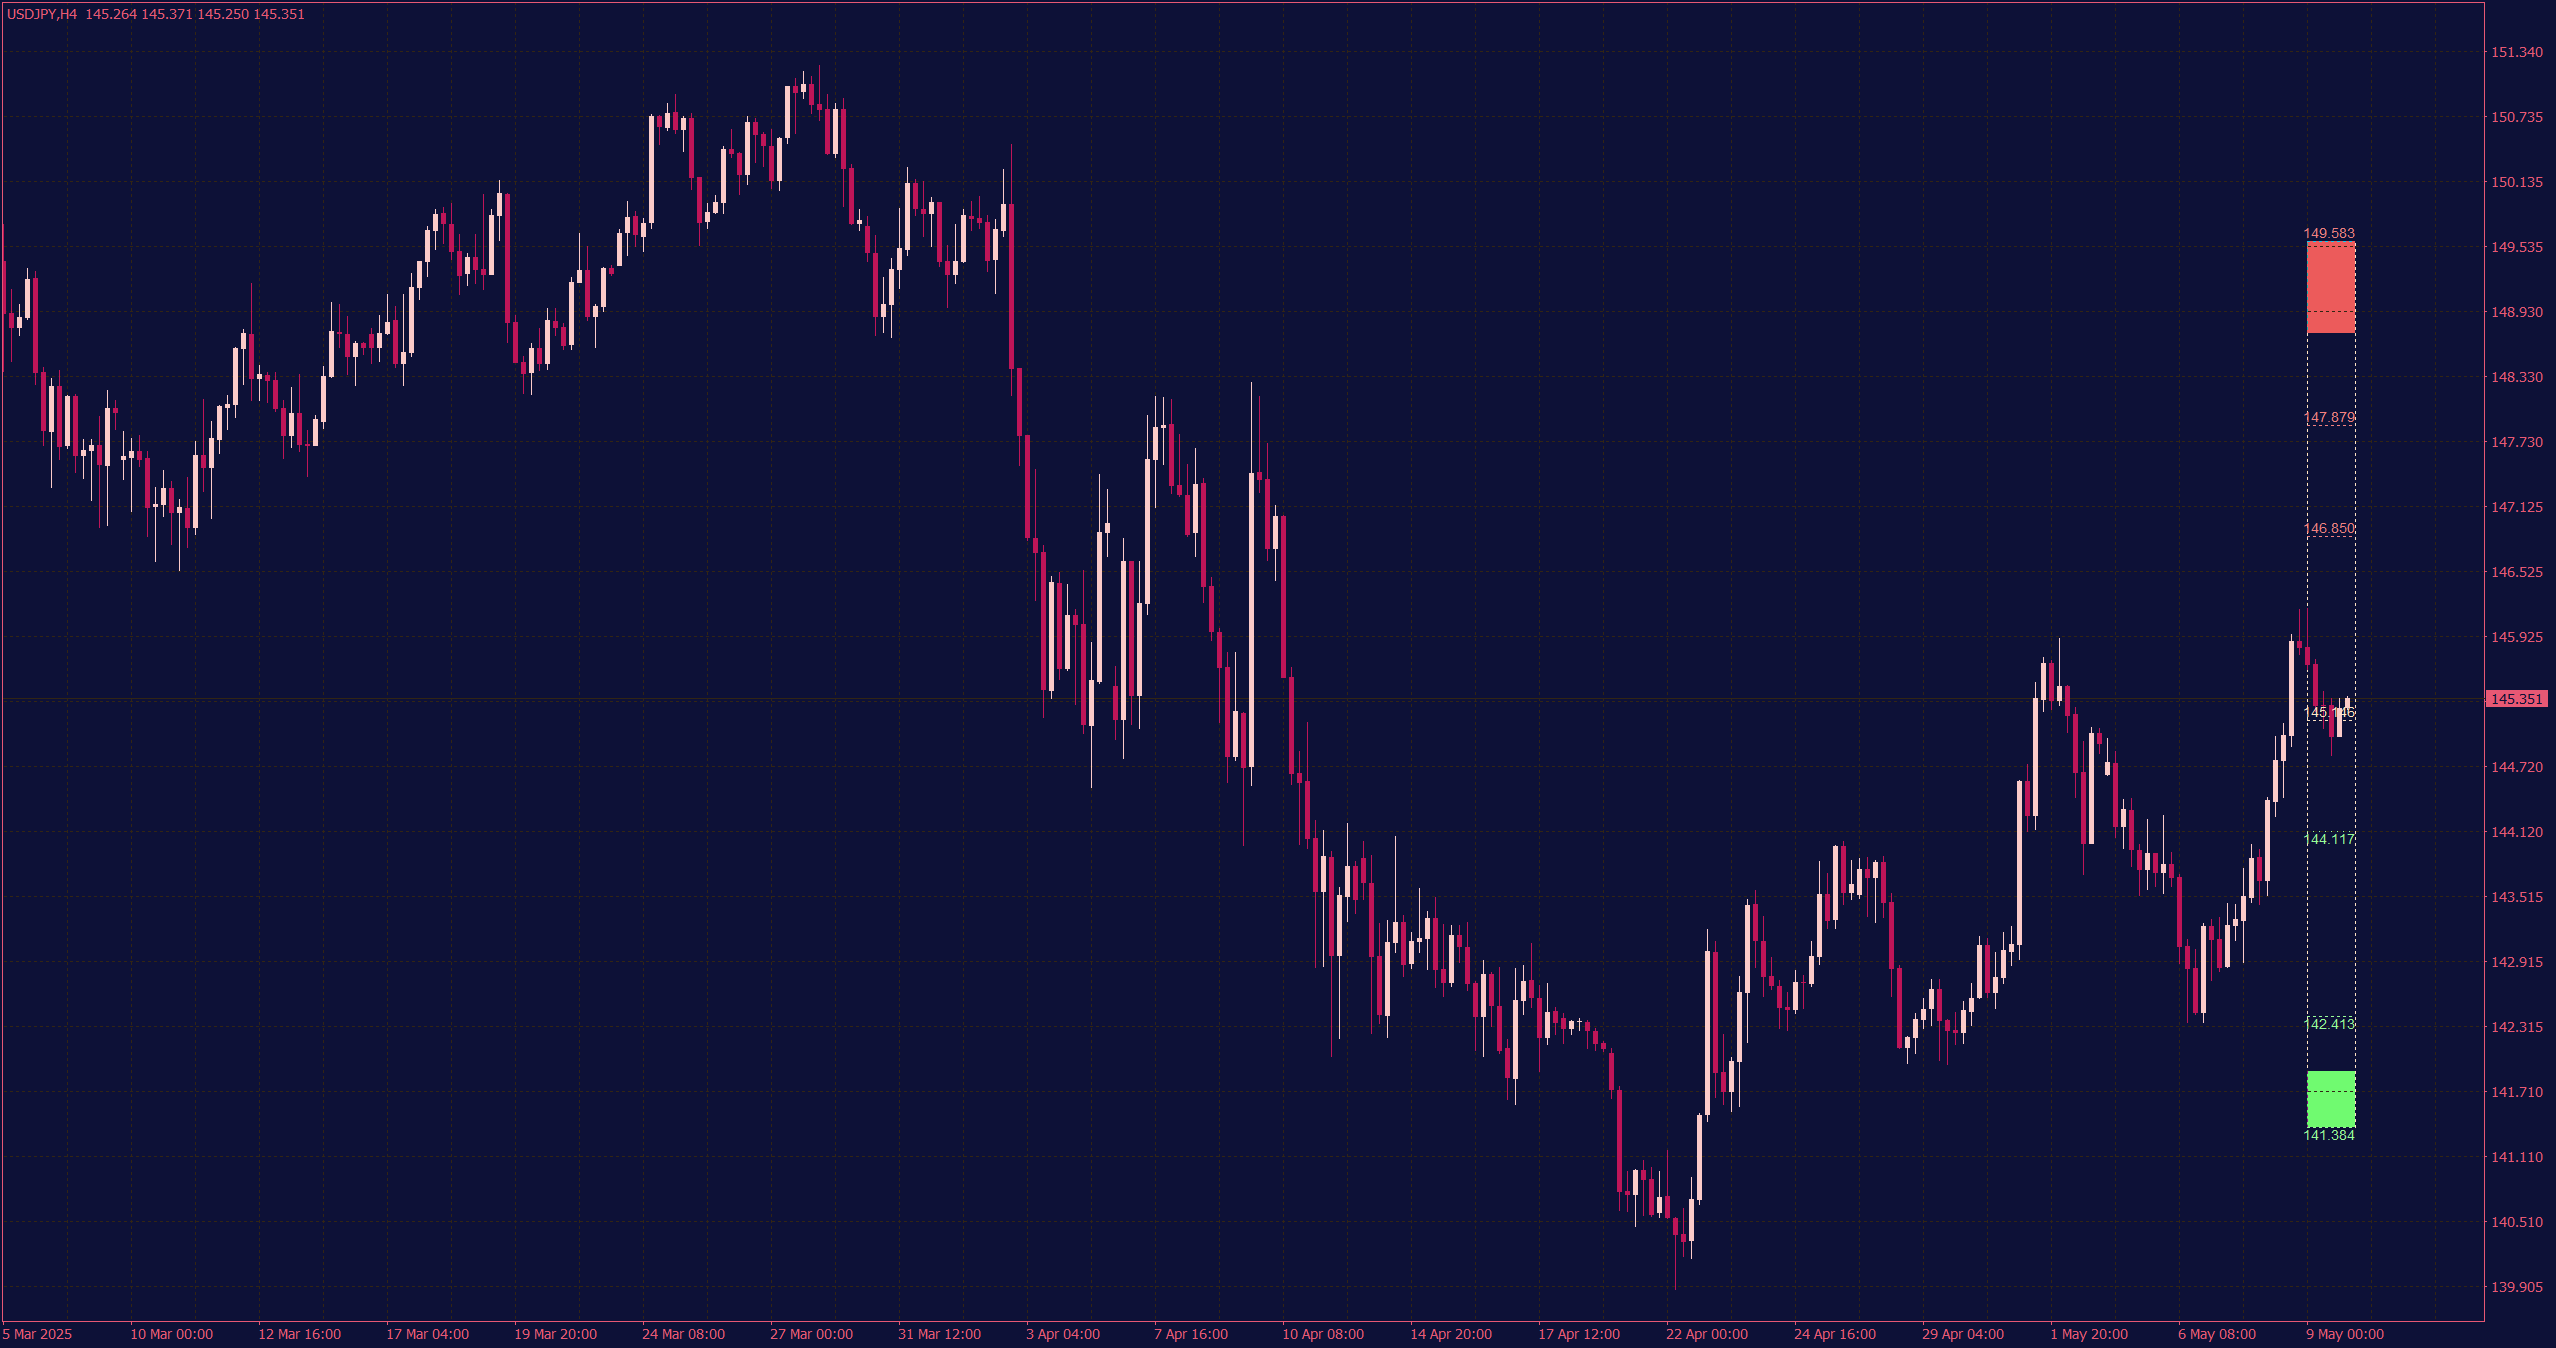
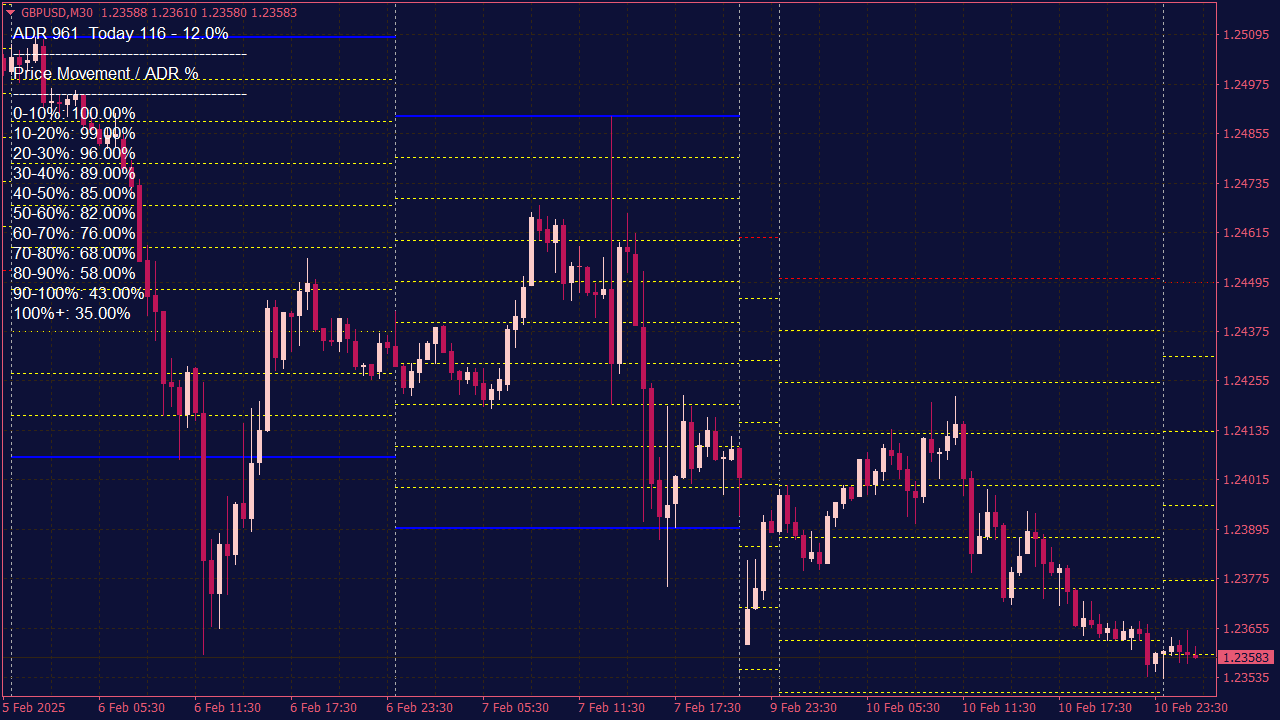
The All Pivots V6 Indicator helps traders find price areas that may become important during the trading day. It combines several pivot level calculations and displays them directly on the chart, so you can quickly see possible support, resistance, breakout, and reversal zones. This can be useful when you want a cleaner way to understand where the market might react next. What makes it worth watching is not only the level itself, but what price does when it gets there. Will it reject the zone, move through it, or start building momentum? The All Pivots V6 Indicator gives you those areas to keep an eye on.
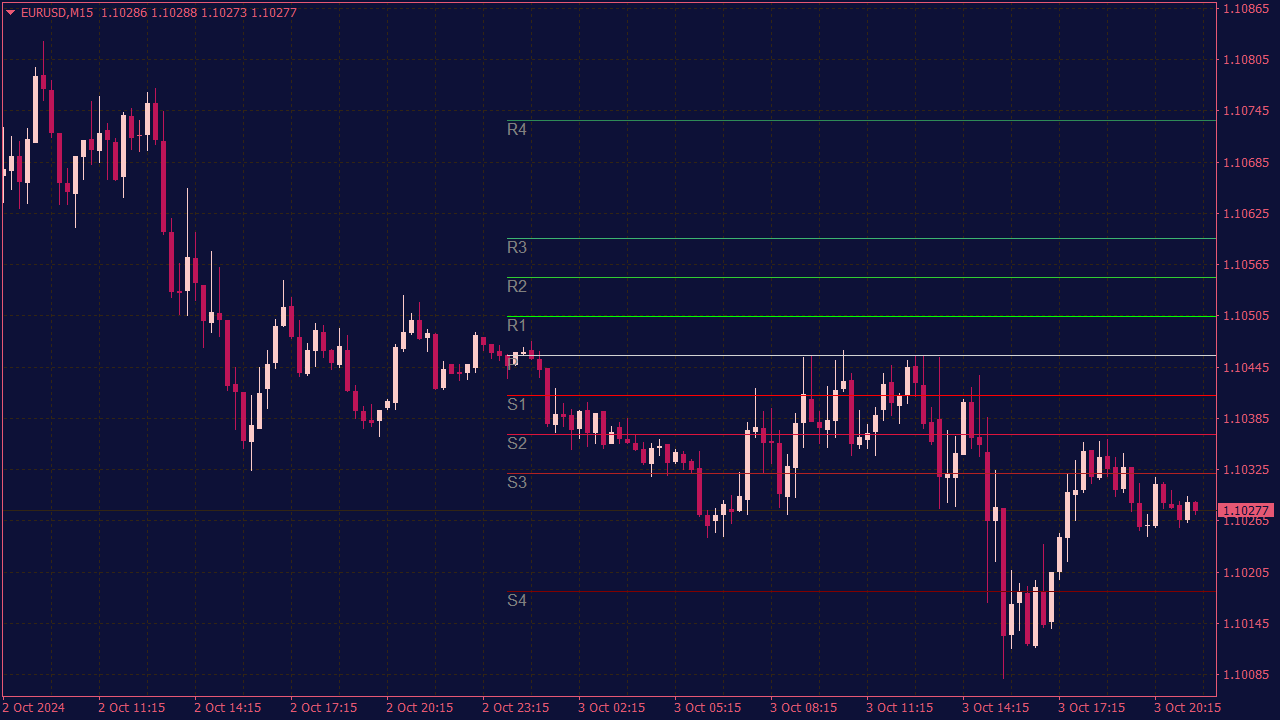
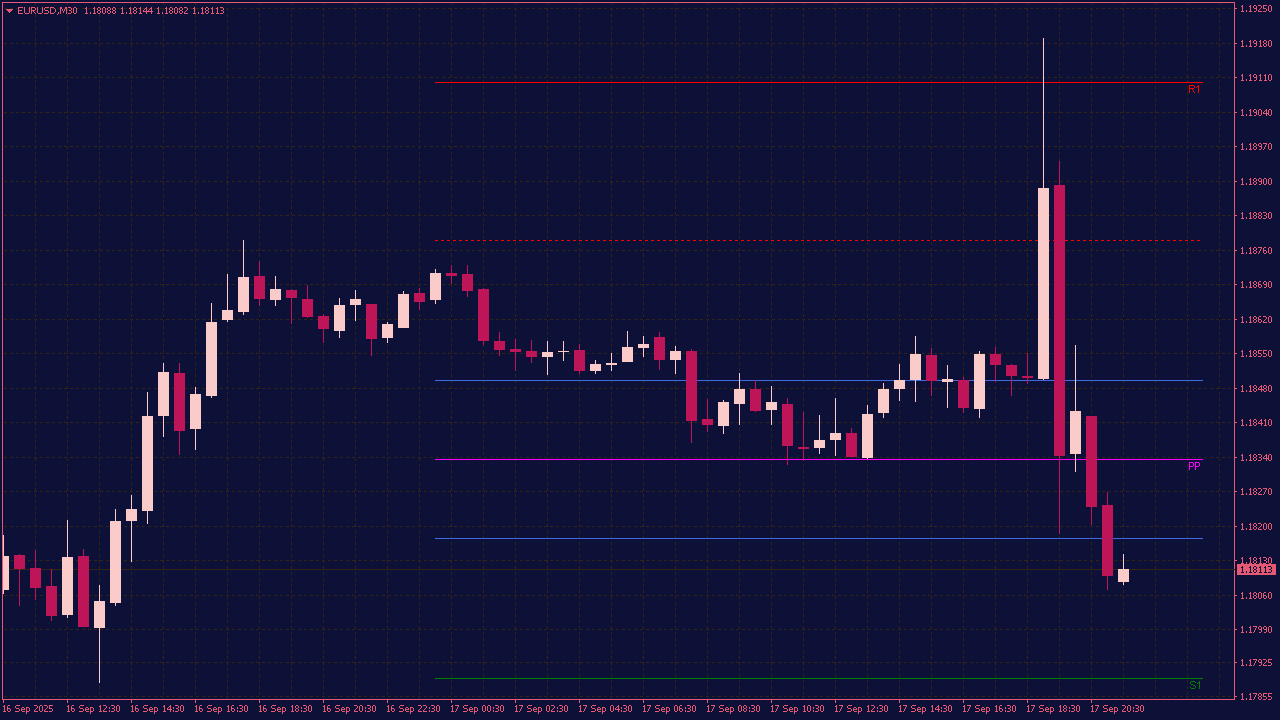
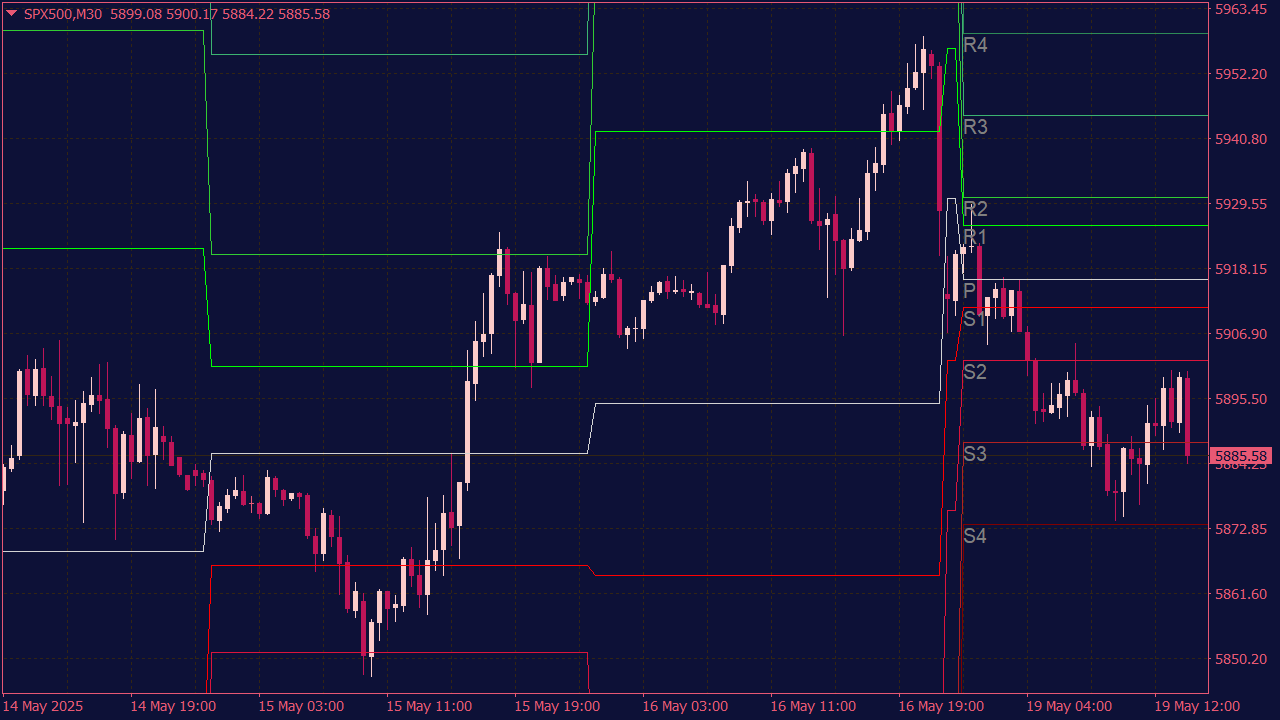
Pivot Points Indicator is widely used in trading to identify potential support and resistance levels in the market. Traders typically look for entry signals around these levels: a buy entry is often triggered when the price bounces off a support level, particularly the main pivot point or its associated support (S1, S2), while a sell entry can be considered if the price forms a reversal at a resistance level, especially at the main pivot or its associated resistance (R1, R2). Additional confirmation from other technical indicators, such as moving averages or RSI, can enhance the reliability of these signals.
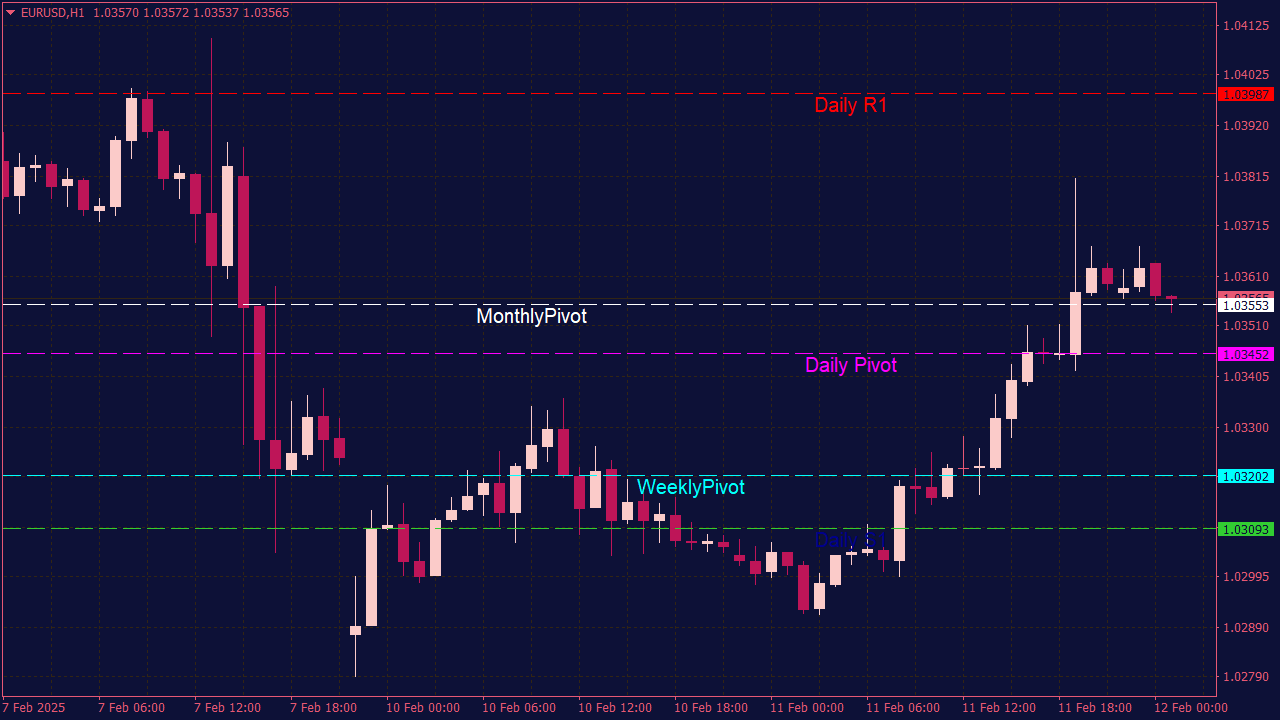
The Auto Pivot Indicator is a professional trading tool designed for currency pairs, built in MQL4 language. It automatically adjusts pivot types according to the selected timeframe, providing accurate signals for trading decisions. The indicator features daily, weekly, and monthly pivot points, each accompanied by three levels of corresponding support and resistance. Additionally, switching from H1 to H4 timeframe seamlessly transitions the focus to weekly support and resistance levels, enhancing its utility for determining optimal entry and exit points in trades.
Daily Pivot Point Indicator with MA and Fibo Levels
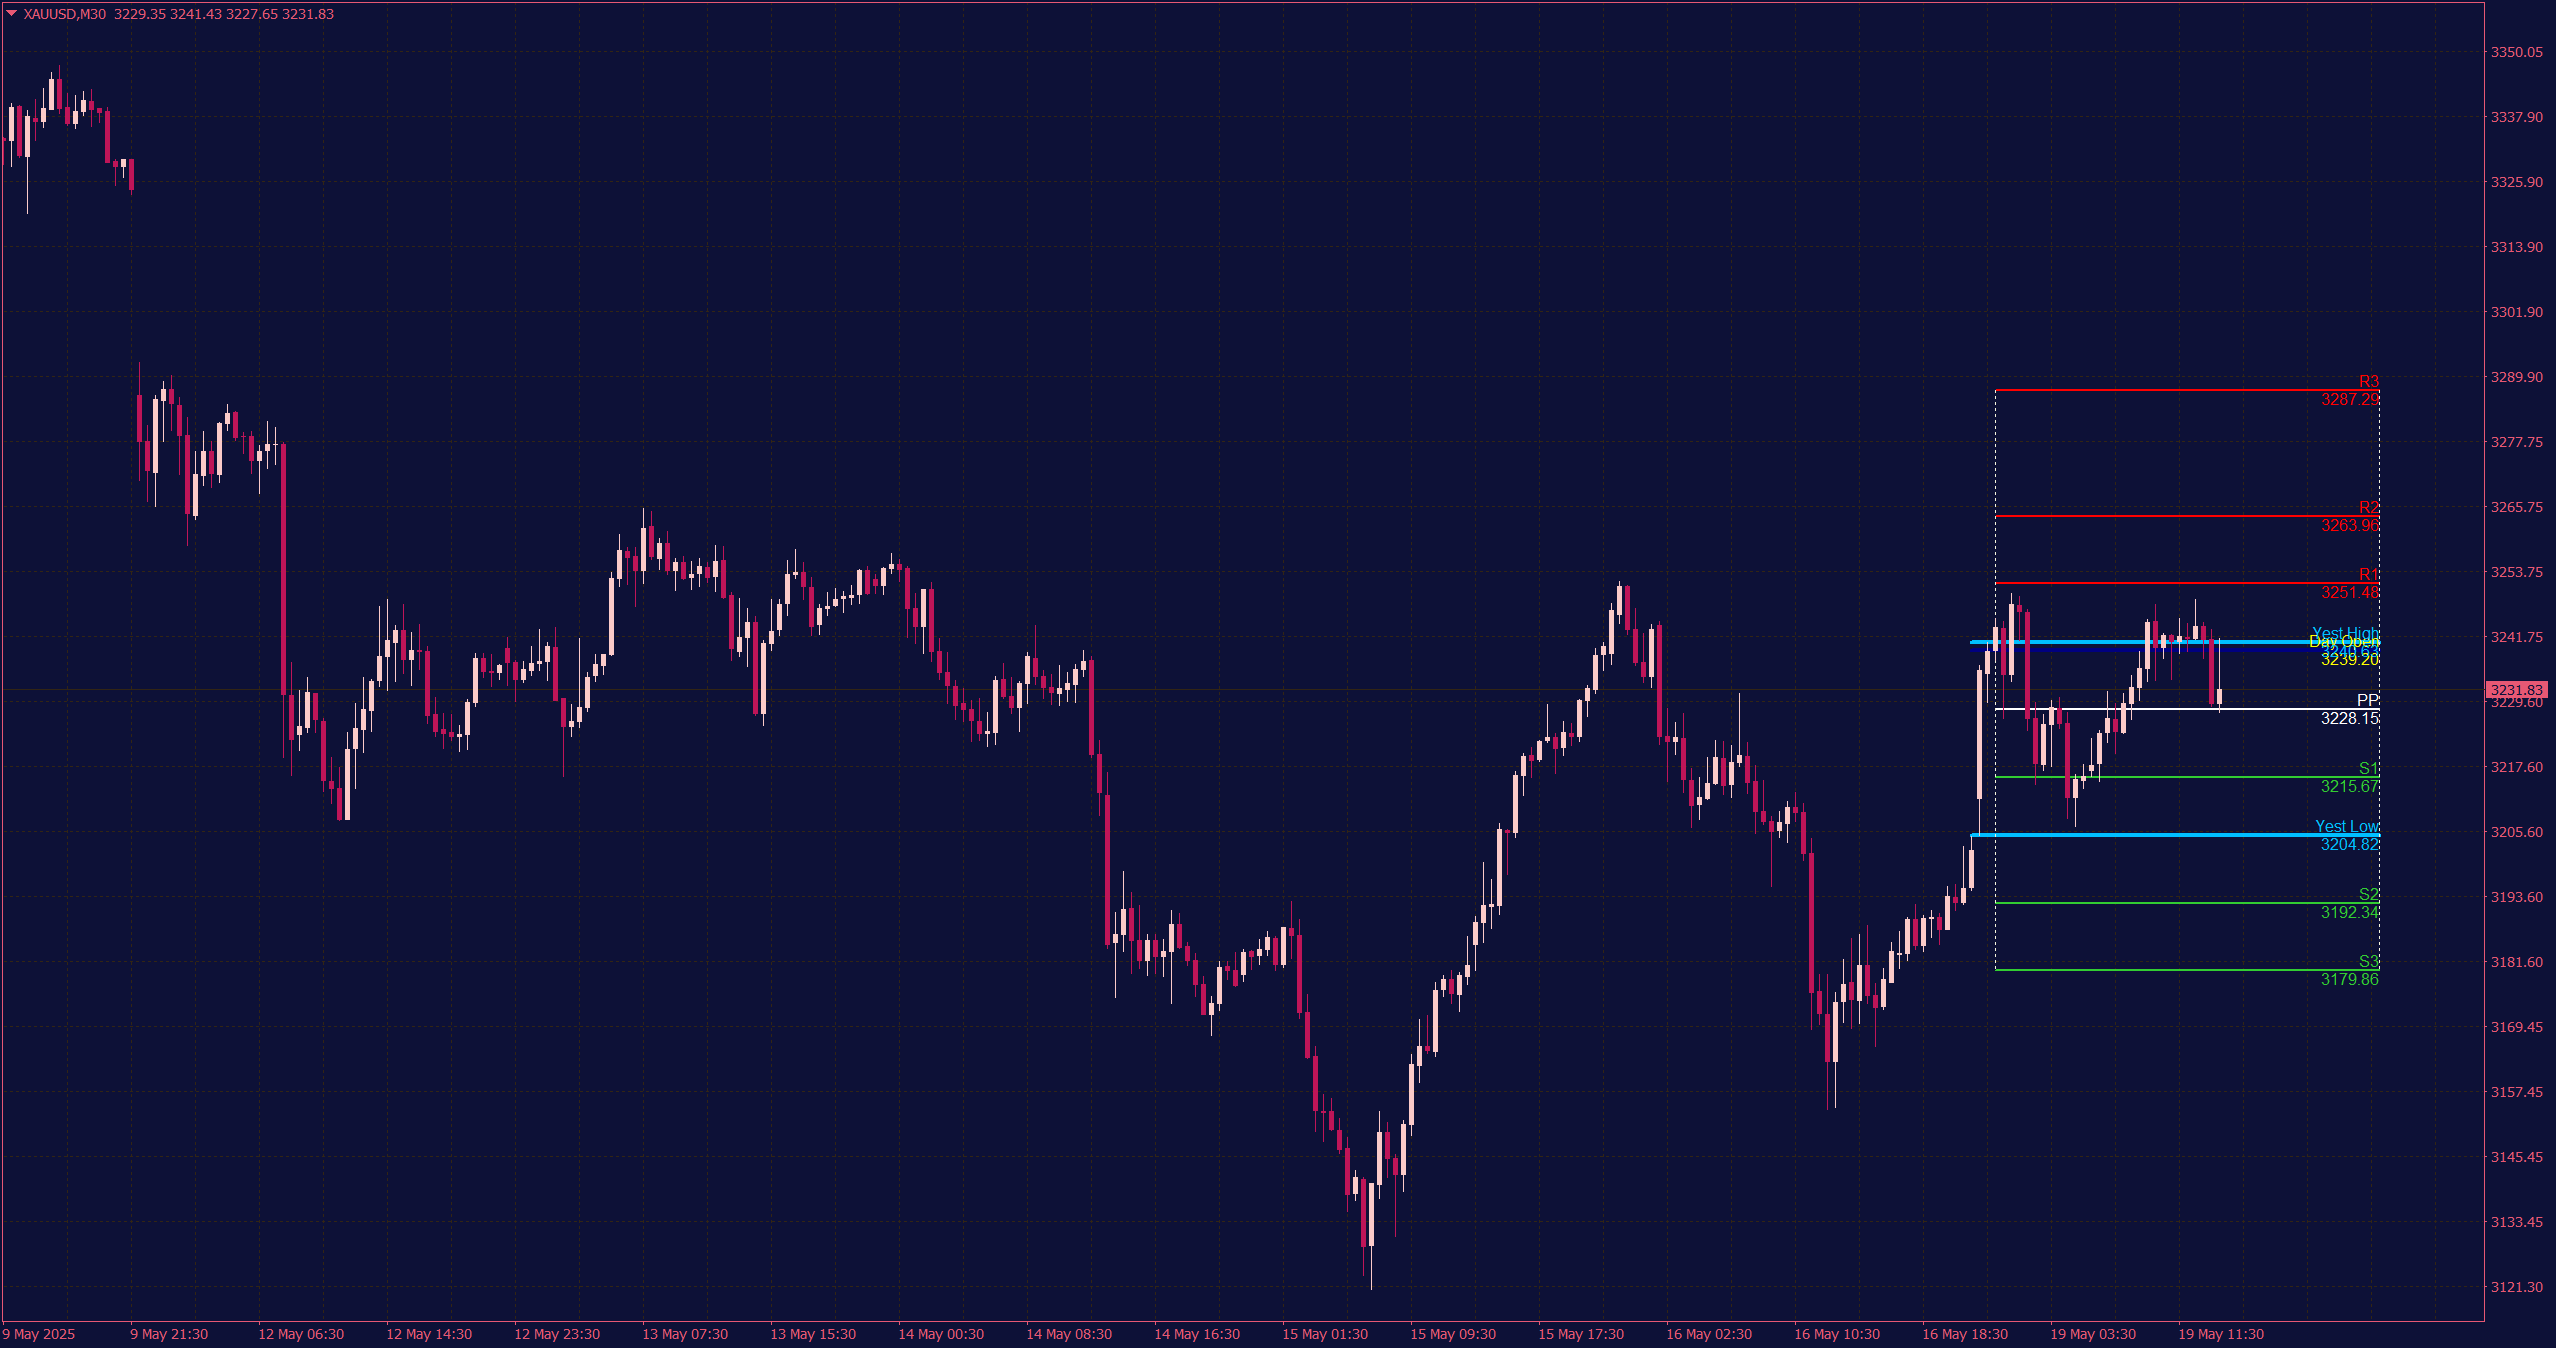
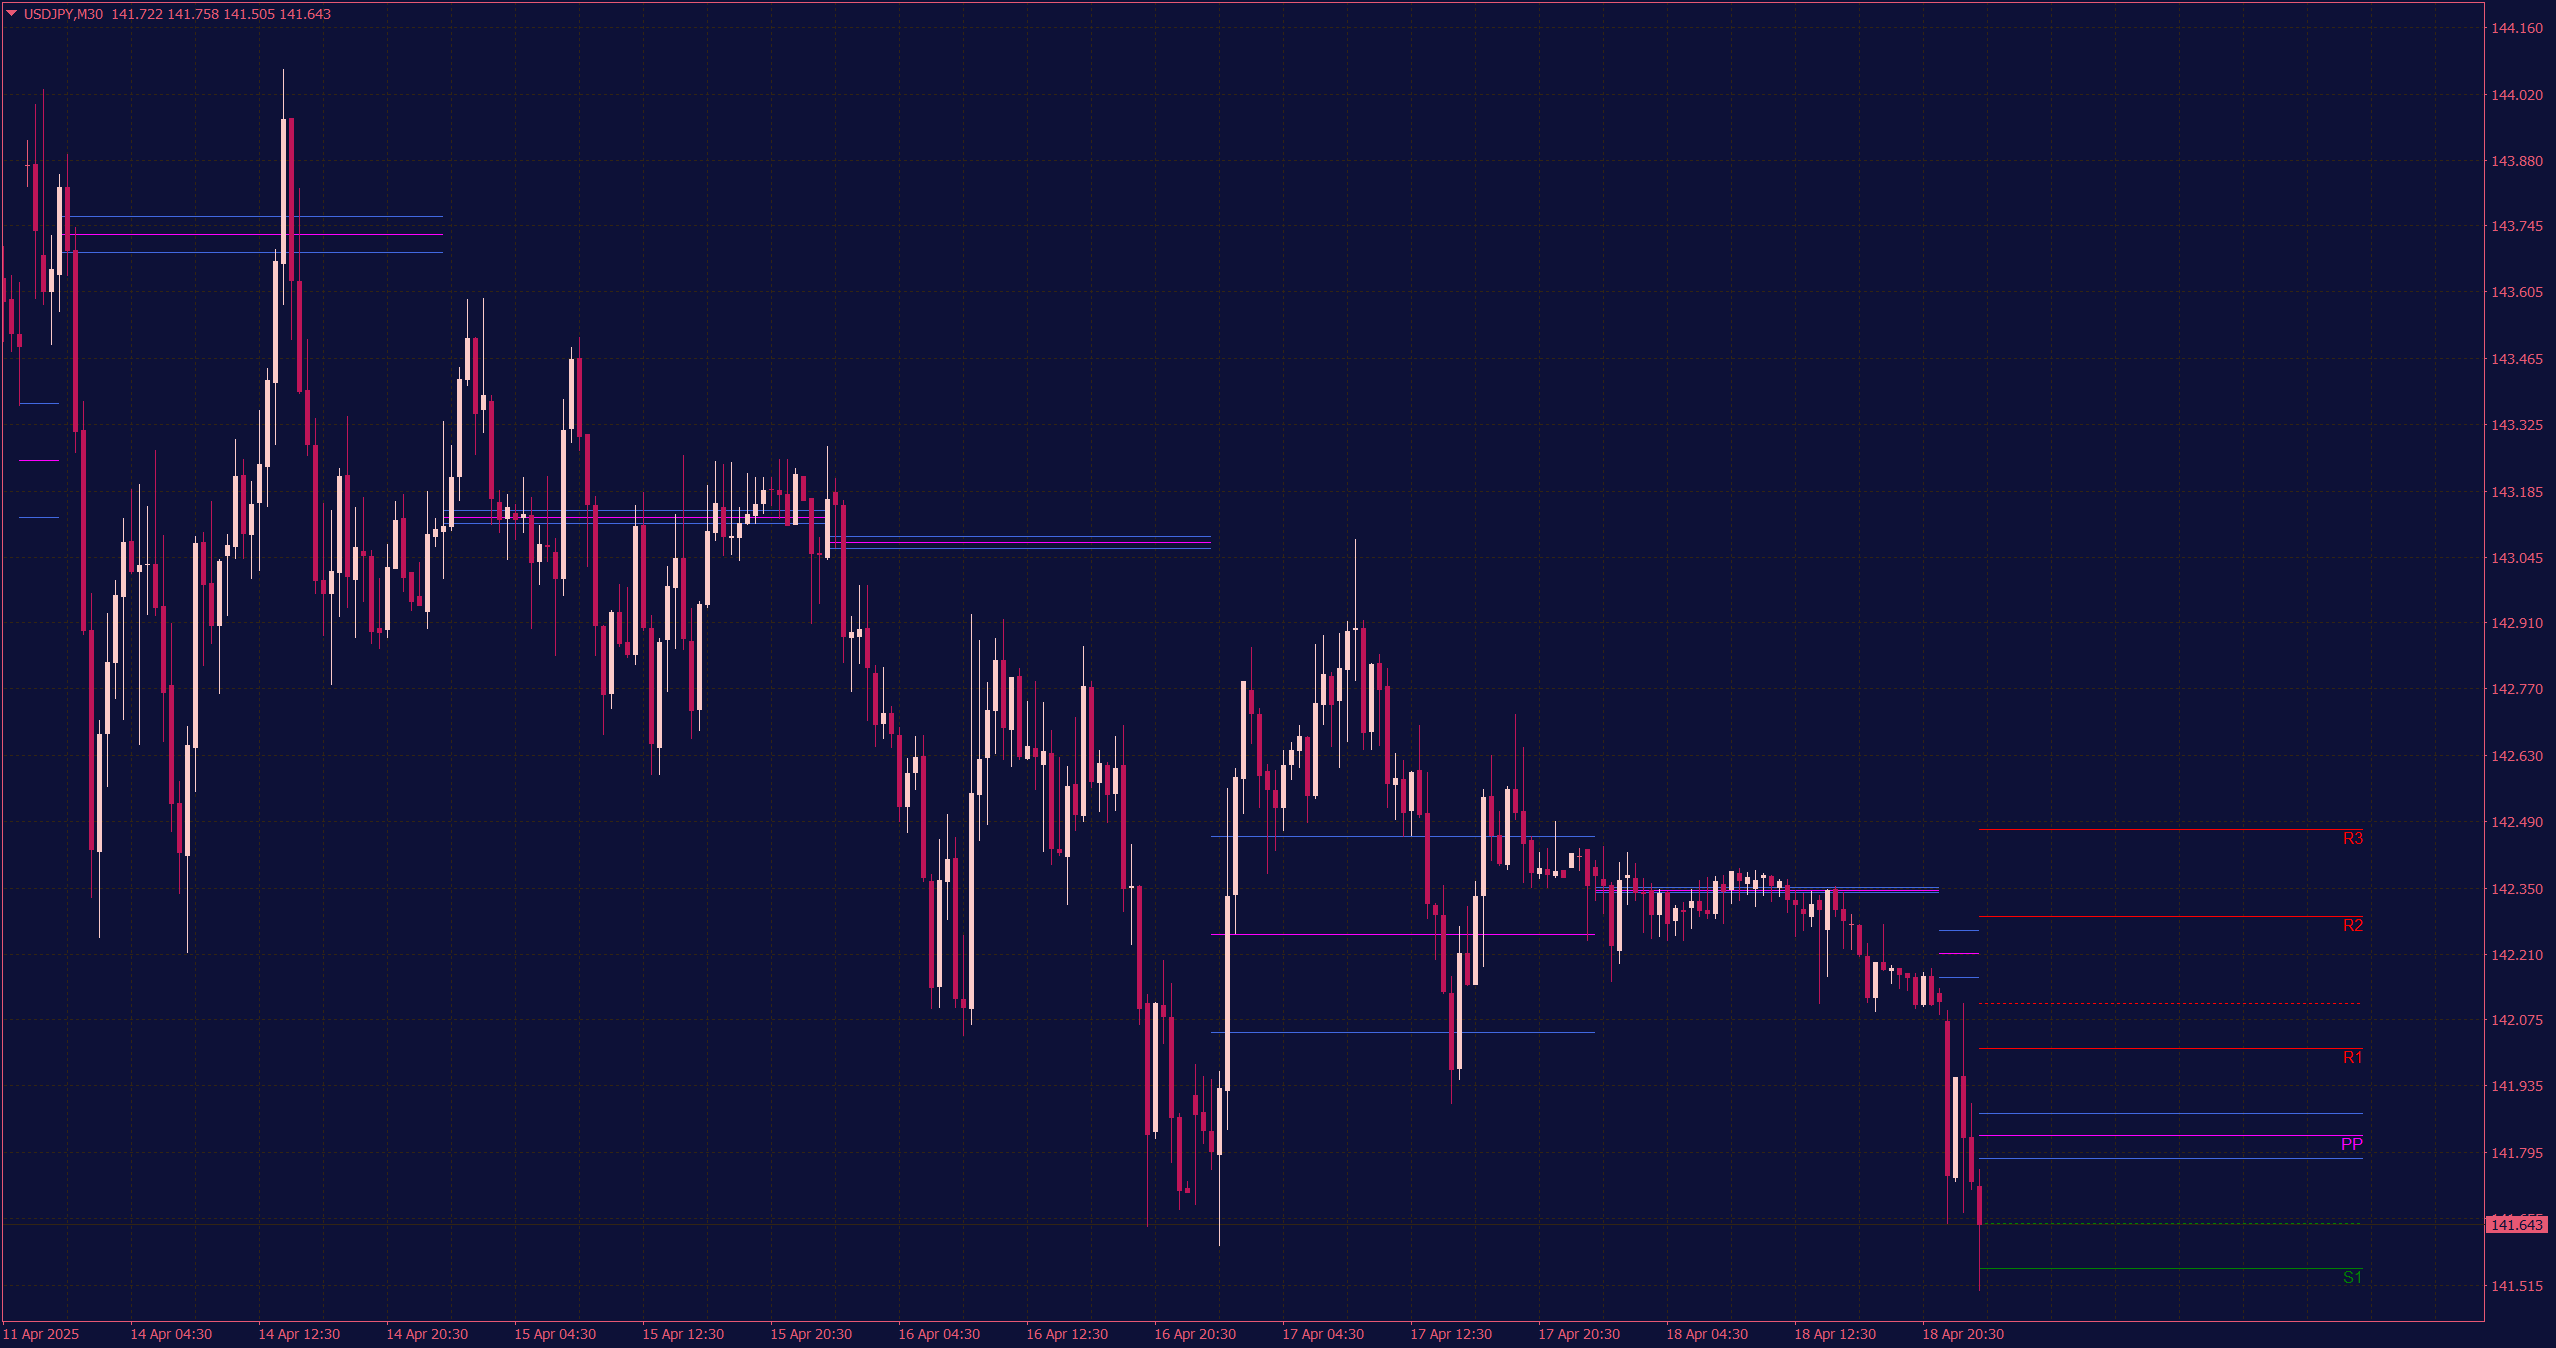
The Daily Pivot Point Indicator plots daily pivot levels along with key support and resistance zones (R1, R2, R3 / S1, S2, S3) based on the previous day’s price data. It helps traders identify potential intraday turning points, breakout areas, and trend bias, making it a reliable tool for day trading strategies.
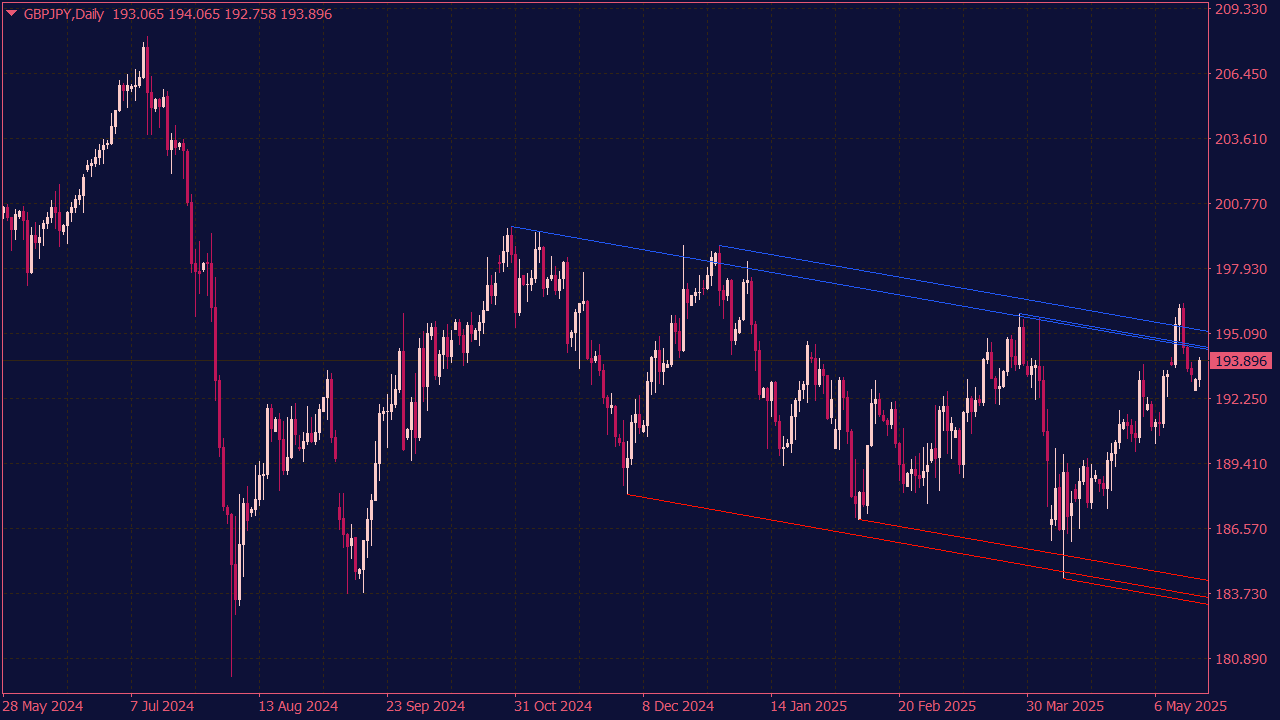
This Custom Pivot Points Indicator is a technical analysis tool typically used in trading to identify potential support and resistance levels across multiple time frames. It combines pivot points calculated from different periods (such as daily, weekly, monthly, and 4-hour charts) to provide traders with a comprehensive view of price action and market sentiment. By considering these various time frames, traders can better make informed decisions about entry and exit points in their trading strategies.
The Fibo Pivot Lines GMT indicator is a technical analysis tool used in trading to identify potential support and resistance levels based on Fibonacci ratios and pivot points. It combines the concepts of Fibonacci retracement levels with traditional pivot point calculations to provide traders with insights into possible price reversals and market trends. By utilizing the GMT (Greenwich Mean Time) timeframe, it aims to enhance precision in trading strategies, particularly in forex and stock markets. Traders often use this indicator to set entry and exit points, manage risk, and make informed decisions based on the calculated levels.
📍 Pivot Points: The Levels Most Traders See, but Few Really Read
Pivot Points have been on traders’ charts for decades. They are simple to calculate, easy to plot, and, at first glance, almost too basic to deserve much attention.
That is exactly why many traders underestimate them.
A beginner often treats Pivot Points like fixed support and resistance lines. Price reaches S1, so they look for a buy. Price reaches R1, so they look for a sell. Sometimes that approach works. More often, it misses the bigger picture.
The problem is not the tool. The problem is the way the tool is read.
A Pivot level is not a trade signal by itself. It is a decision area. It is a place where traders react, liquidity builds, stops are triggered, and the market often reveals whether a move is being accepted or rejected.
The formula is not the edge. The reaction is.
🧭 Why Pivot Points Still Deserve Attention
In a market full of complex indicators, automated systems, and crowded dashboards, Pivot Points can look almost primitive. But their simplicity is also their strength.
They give traders a clean reference map before the session begins. The central Pivot shows the session’s balance point. R1, R2, and R3 mark potential resistance zones. S1, S2, and S3 mark potential support zones.
That does not mean price will respect these levels perfectly. Markets rarely respect anything perfectly. Still, Pivot Points create structure — and structure matters in Forex.
Without structure, traders often react emotionally to every candle. With structure, they can ask better questions:
Is price being accepted above or below the central Pivot?
Did the breakout hold, or did it fail?
Is price expanding away from value or rotating back toward it?
Is the next Pivot level far enough away to justify the trade?
Those questions are more useful than simply asking whether to buy or sell.
⚖️ The Central Pivot Is the Session’s Balance Point
The central Pivot is often the most important level on the chart. It gives a quick view of where the market is trading in relation to the previous session’s range.
When price holds above the central Pivot, buyers may have the advantage. When price holds below it, sellers may be setting the tone. But this should never become a mechanical rule.
Price above the Pivot does not automatically mean “buy.”
Price below the Pivot does not automatically mean “sell.”
The better question is simple: what happens when price returns to the Pivot?
A market that breaks above the Pivot and then holds it on a retest is showing acceptance. A market that only spikes above the Pivot and quickly falls back below it is showing rejection.
That difference may look small on the chart, but it can be important in practice.
🔄 Setup 1: The Pivot Reclaim
The Pivot Reclaim is one of the cleaner ways to use the central Pivot because it forces the trader to wait for confirmation.
Imagine EUR/USD spends the early part of the session below the central Pivot. Sellers appear to be in control. Price pushes lower, but the move does not continue. Instead, the pair starts climbing back toward the Pivot.
At that moment, the market is not bullish yet. It is only testing whether sellers still have control.
The first warning comes when price breaks back above the central Pivot.
The stronger signal appears if price later retests the Pivot from above and holds it as support.
A simple bullish Pivot Reclaim structure looks like this:
Price trades below the central Pivot.
Sellers push lower but fail to create continuation.
Price reclaims the central Pivot.
The Pivot is retested and holds as support.
R1 becomes the next logical area to watch.
The bearish version works in reverse. Price trades above the Pivot, fails to continue higher, breaks below it, and then retests it as resistance. If the retest fails, S1 becomes the next area of interest.
The value of this setup is not that it predicts the move early. It keeps the trader from entering too early.
🪤 Setup 2: The R1 Trap
R1 attracts attention. That alone makes it important.
When price breaks above R1, breakout traders often enter. The candle may look strong, the move may feel obvious, and the fear of missing out can become uncomfortable.
But the key question is not whether price breaks R1.
The key question is whether price can stay above R1.
A weak breakout above R1 that quickly falls back below the level can become a classic trap. Traders who bought the breakout are suddenly in a poor position. If price then retests R1 from below and fails, the market may rotate back toward the central Pivot.
This setup is not about fading every breakout. Strong breakouts can continue. The point is to watch how the market behaves after the break.
A breakout that holds is information. A breakout that fails is information too.
⚠️ Setup 3: The S1 Trap
The S1 Trap is the mirror image of the R1 Trap.
Price breaks below S1. Sellers enter because the chart looks bearish. For a moment, the move appears clean. Then price stops falling, turns back above S1, and holds the level.
At that point, traders who sold the breakdown may be trapped. If they begin closing positions, their buying can help push price back toward the central Pivot.
This is why experienced traders rarely chase the first break of support without context. They want to know whether the market accepts lower prices.
If price breaks S1 and holds below it, the level may flip into resistance.
If price breaks S1 and quickly reclaims it, the breakdown may have failed.
The failed move often says more than the first move.
🇬🇧 Setup 4: The London Sweep
Many useful Pivot setups appear around the London open because liquidity and volatility often increase after the quieter Asian session.
During Asia, price may build a narrow range around the central Pivot. Stops collect above the Asian high and below the Asian low. Breakout traders wait. Then London opens, and the real test begins.
One common scenario is a sweep above the Asian high into R1. At first, the move looks bullish. If price cannot hold above R1 and falls back into the Asian range, the breakout may have been a liquidity sweep rather than a genuine continuation move.
The bearish version happens when price sweeps below the Asian low into S1, fails to continue, and reclaims the level.
The aim is not to predict the London move before it happens. A more disciplined approach is to let the market reveal whether the first move is being accepted or rejected.
🔁 Setup 5: The R1 and S1 Flip
Breakouts are tempting because they feel urgent. That urgency is often the problem.
A more disciplined approach is to wait for the flip.
If price breaks above R1, the first move may already be extended. Instead of chasing it, a trader can wait for price to return to R1. If R1 holds as support, the level has flipped from resistance into support.
That creates a cleaner continuation structure. The next logical area to watch is R2, assuming momentum remains healthy and there is still enough room for a sensible risk-to-reward setup.
The bearish version is the S1 flip. Price breaks below S1, returns to retest it from underneath, and fails to reclaim it. Support becomes resistance. If sellers remain in control, S2 becomes the next area of interest.
This setup is not dramatic, but that is part of its strength. It reduces the need to chase and forces the trader to wait for acceptance.
🔥 Setup 6: R2 and S2 Exhaustion
R2 and S2 are not ordinary levels. By the time price reaches them, the session’s move may already be mature.
That does not mean price must reverse. Strong trend days can move beyond R2 or S2 and continue. Still, traders should become more selective at these outer levels.
A long entry near R2 after a strong bullish move may offer poor risk-to-reward. The same applies to a short entry near S2 after a heavy sell-off. The easier part of the move may already be gone.
At R2, traders can watch for:
slowing momentum
long upper wicks
failed continuation
a lower high after rejection
At S2, traders can watch for:
long lower wicks
failed selling pressure
a higher low after the first reaction
buyers stepping in after an extended move
These are not automatic reversal signals. They are warnings that the move may be stretched.
The goal is not to catch the exact top or bottom. The goal is to avoid entering after most of the opportunity has already passed.
🧲 Setup 7: The Virgin Pivot
A Virgin Pivot is a Pivot level that has not yet been touched during the relevant session or period.
Some traders treat untouched Pivot levels as magnets. That idea can be useful, but only when the context supports it.
For example, if price spends most of the session below the central Pivot but later starts forming higher lows, breaking minor resistance, and improving in momentum, the untouched Pivot above may become a realistic target.
The mistake is using the Virgin Pivot as an entry signal by itself.
It is better used as a destination. If the market is already moving toward it with structure and momentum, the Virgin Pivot can help with trade management. It gives the trader a logical area to reduce risk, take partial profit, or watch for a reaction.
In other words, a Virgin Pivot is not magic. It is unfinished business that becomes relevant only when price starts moving in its direction.
🗜️ Setup 8: Pivot Compression
Some of the best moves begin with price action that looks boring.
Price holds above the central Pivot but cannot break R1. It tests R1 again and again. Sellers defend the level, but buyers refuse to give up the Pivot.
That is compression.
The market is building pressure between two important areas. If R1 eventually breaks with conviction, the move toward R2 can be sharp. Shorts near R1 may need to exit, while breakout traders enter at the same time.
The bearish version happens when price holds below the central Pivot and repeatedly presses into S1. If buyers cannot reclaim the Pivot and S1 finally breaks, price may accelerate toward S2.
Compression does not mean traders should enter randomly inside the range. Often, the better opportunity comes after the break, and sometimes after the retest.
🛑 The Most Underrated Setup: No Trade
There is one Pivot setup that rarely gets enough attention: doing nothing.
If price keeps crossing above and below the central Pivot, the market is probably undecided. Buyers and sellers are both being punished. Every small move looks like the beginning of direction, but nothing follows through.
This is where overtrading starts:
Traders buy above the Pivot. Price drops.
They sell below the Pivot. Price snaps back.
They increase size to recover. The market stays messy.
By the time a real move begins, they are already chasing instead of thinking clearly.
Professional trading is not about being active all the time. It is about acting when the conditions are worth it.
If the Pivot area is noisy, the cleanest decision may be to wait until price leaves the zone and proves acceptance above or below it.
Capital that is not lost in bad conditions is capital available for better conditions.
✅ A Practical Pivot Point Checklist
Before taking a Pivot-based trade, it helps to slow the process down. A simple checklist can prevent emotional entries.
Is price accepted above or below the central Pivot?
Is the market trending, ranging, or compressing?
Is this the first touch, a retest, or a failed breakout?
Did price break the level and hold, or break it and fail?
Is there enough room to the next Pivot level for a realistic target?
Has price already moved too far from the central Pivot?
Does the setup appear during an active session such as London or New York?
Is the risk-to-reward still worth taking?
The checklist does not guarantee a winning trade. Nothing does. But it helps the trader avoid the most common mistake: entering because price touched a line.
🎯 Final Thought
Pivot Points are useful because they give traders structure. They show where important decisions may happen and help separate cleaner opportunities from emotional noise.
But the levels themselves are not enough.
A beginner sees R1 and says, “This is resistance.”
An experienced trader asks, “What happened when price got there?”
That question changes the way Pivot Points are used.
The edge is not in the level.
The edge is in the reaction, the context, and the discipline to wait until the market has actually shown its hand.
📝 Editor’s Note
The strategies and market concepts discussed in our content are designed to help readers better understand market behavior. They are not trading recommendations. Financial markets are volatile, and every trader should test ideas carefully, manage risk and make independent decisions.