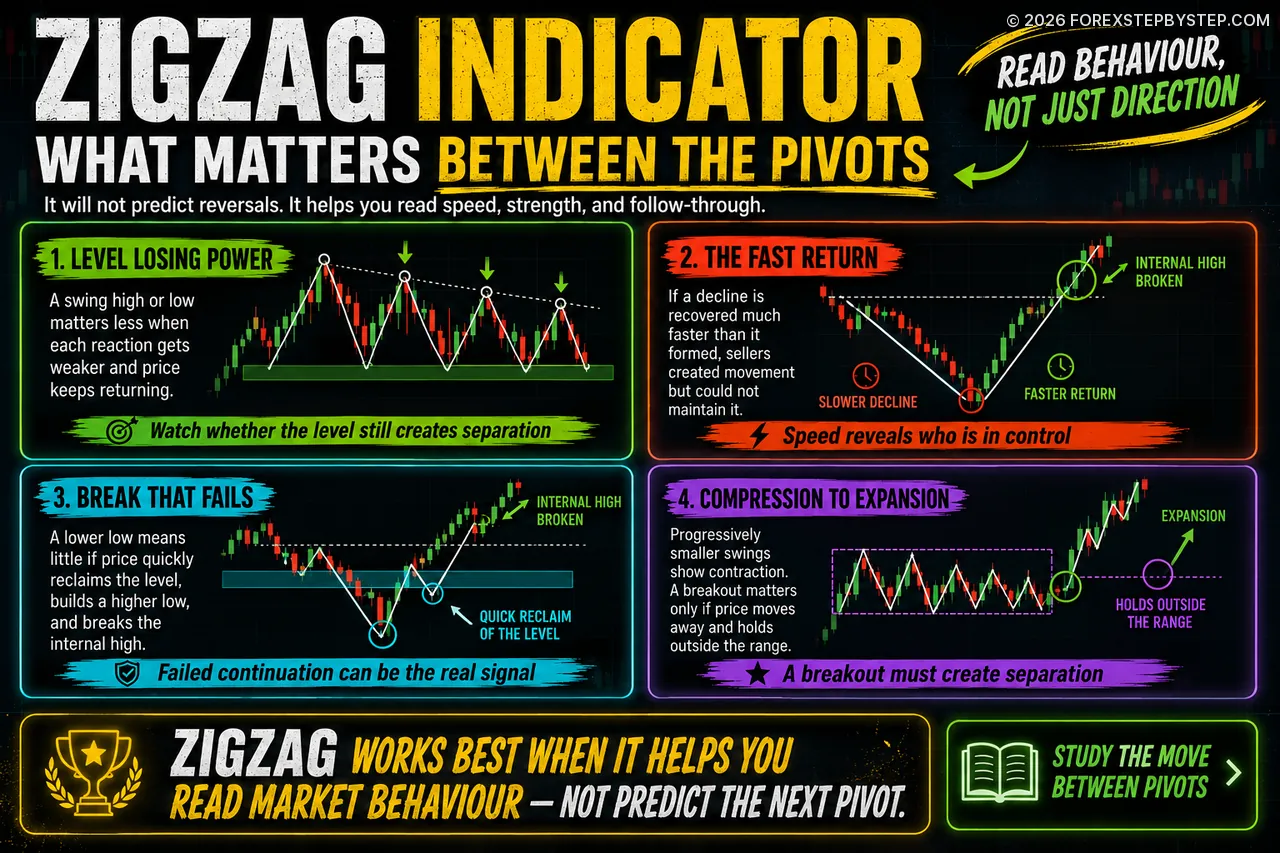
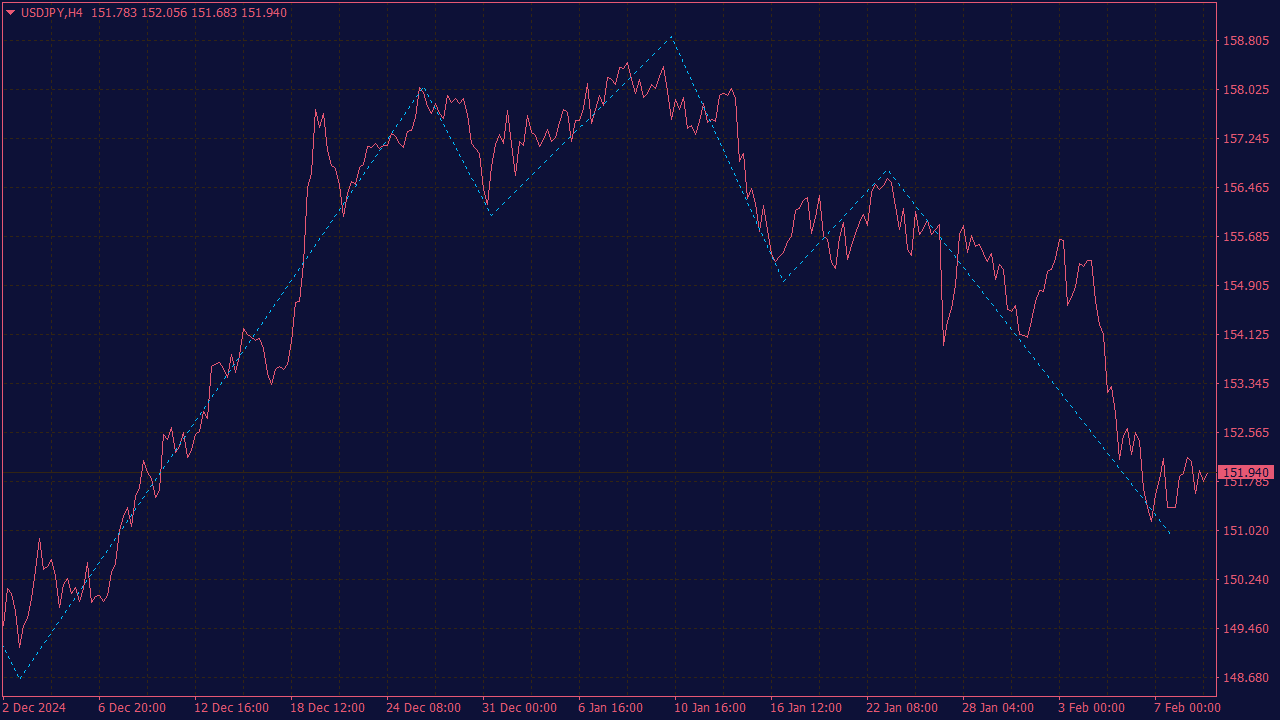
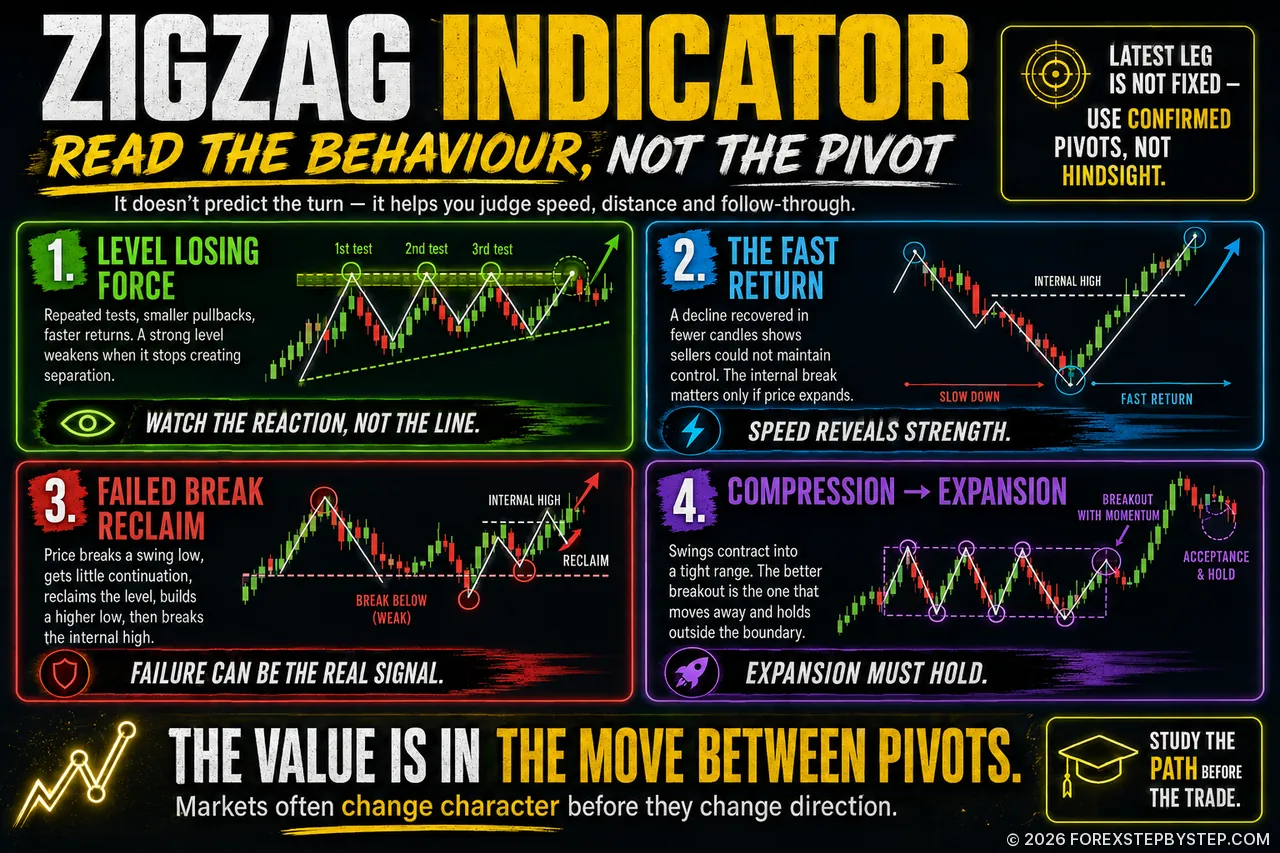
The ZigZag marks the pivots—but the real clues appear in weakening levels, fast returns, failed breaks, and compression.
🧩 What the ZigZag Indicator Misses—and What Traders Should Watch
At first glance, the ZigZag indicator makes price action look almost effortless. Major highs and lows line up neatly, and every reversal seems obvious—after the fact.
Live trading is different. The latest pivot can shift, a breakout can lose momentum, and a trend can keep printing new highs even while its structure begins to weaken. That is where the indicator becomes more interesting.
The useful clues are often hidden between the swings: how quickly price returns to a level, whether a breakout holds, whether corrections are becoming stronger, and whether a familiar support or resistance zone is losing influence.
The full article explores seven practical ways to read those changes, avoid misleading backtests, and use ZigZag with more context. It also explains why some signals look convincing only in hindsight—and what to watch before risking a trade.
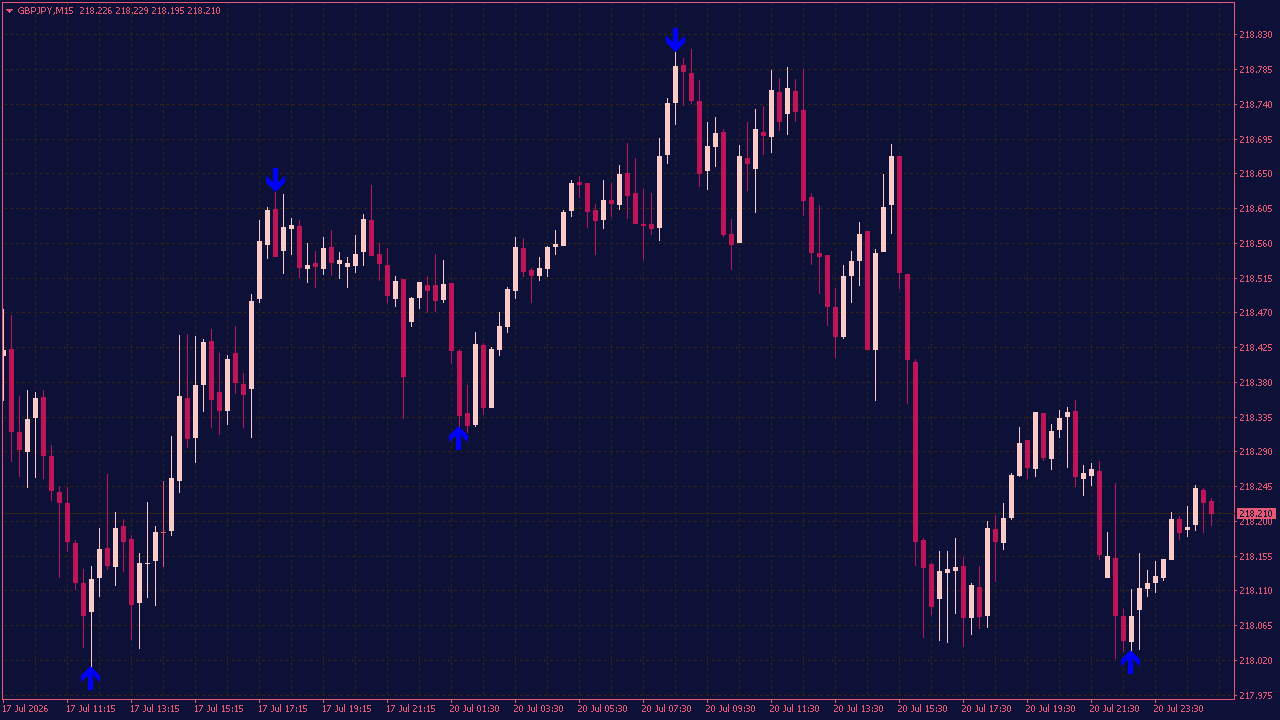
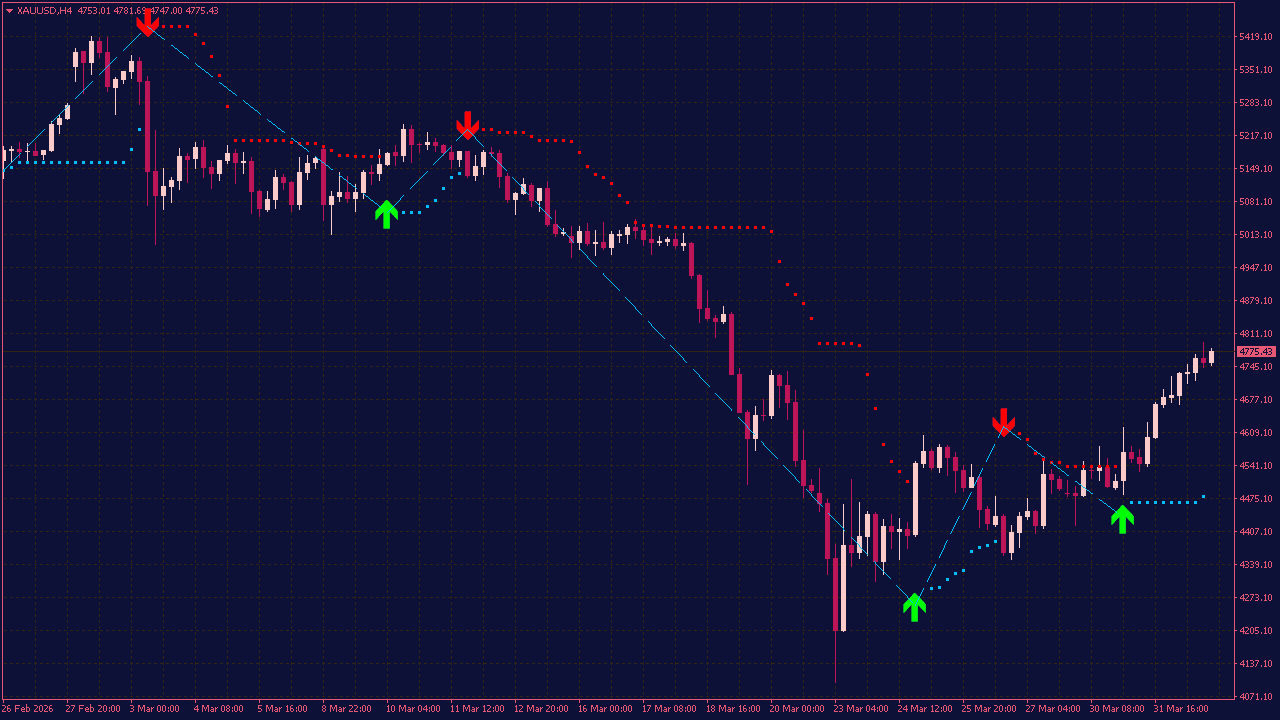
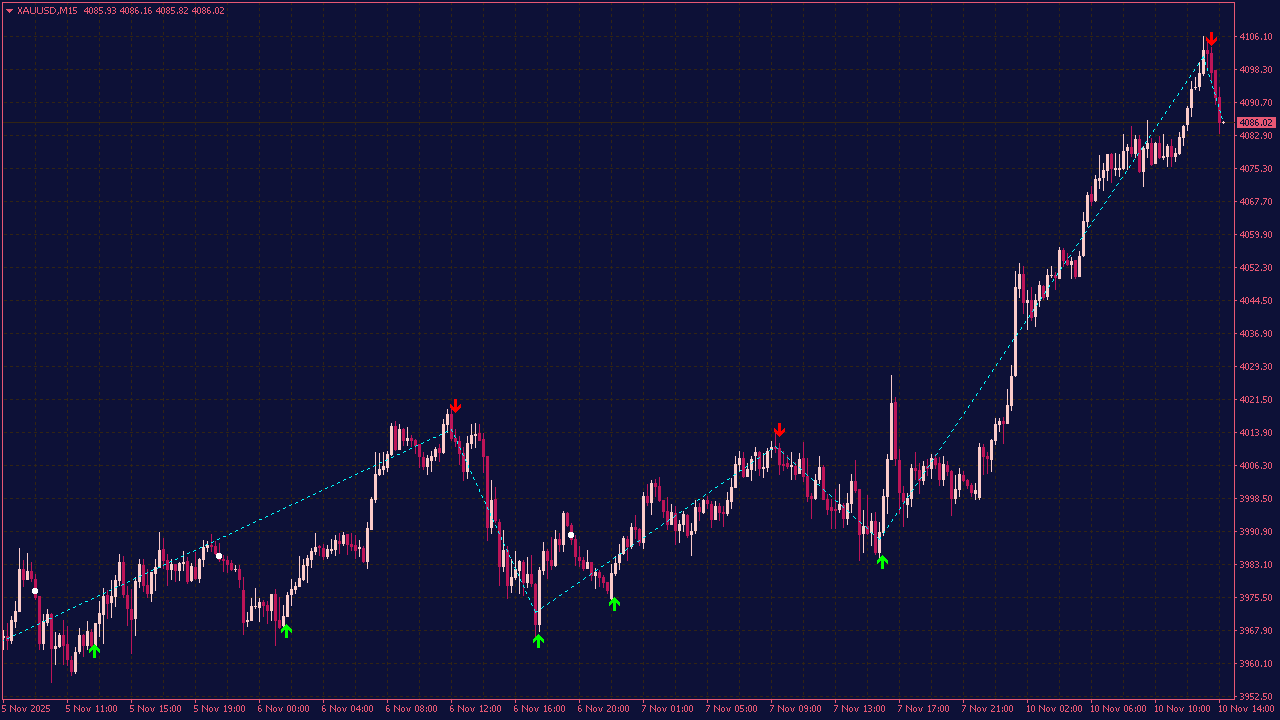
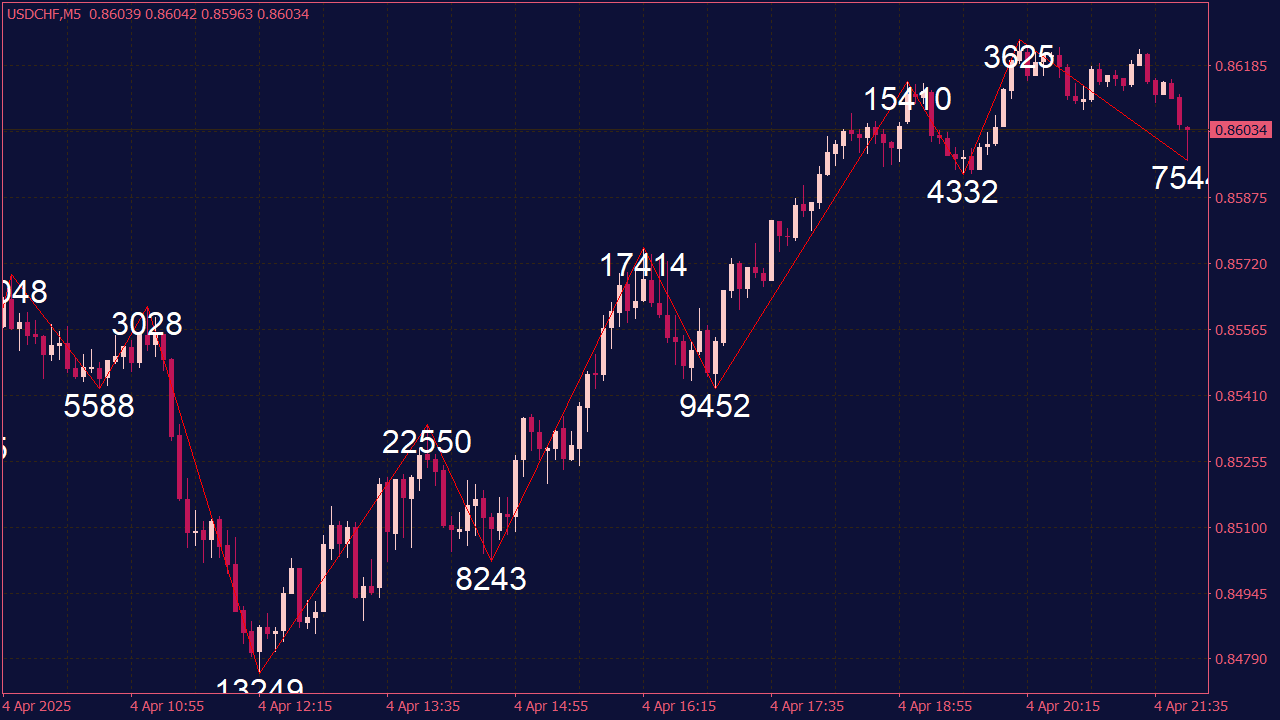
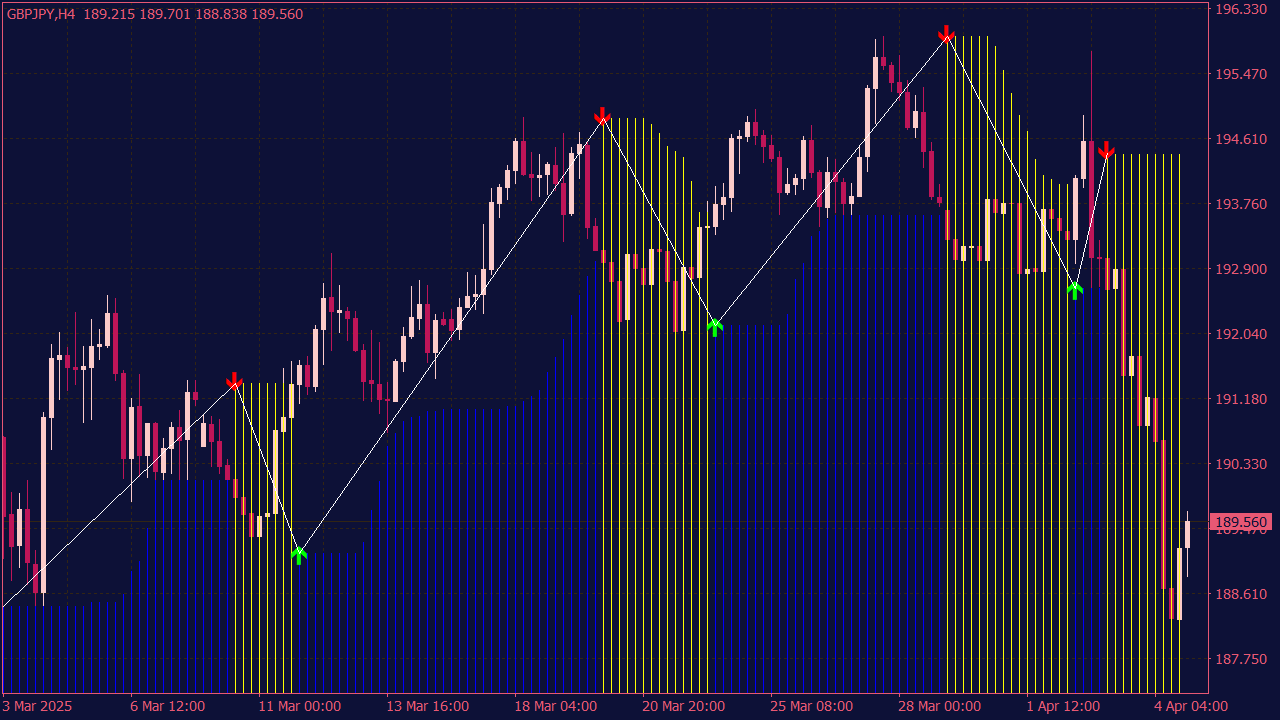
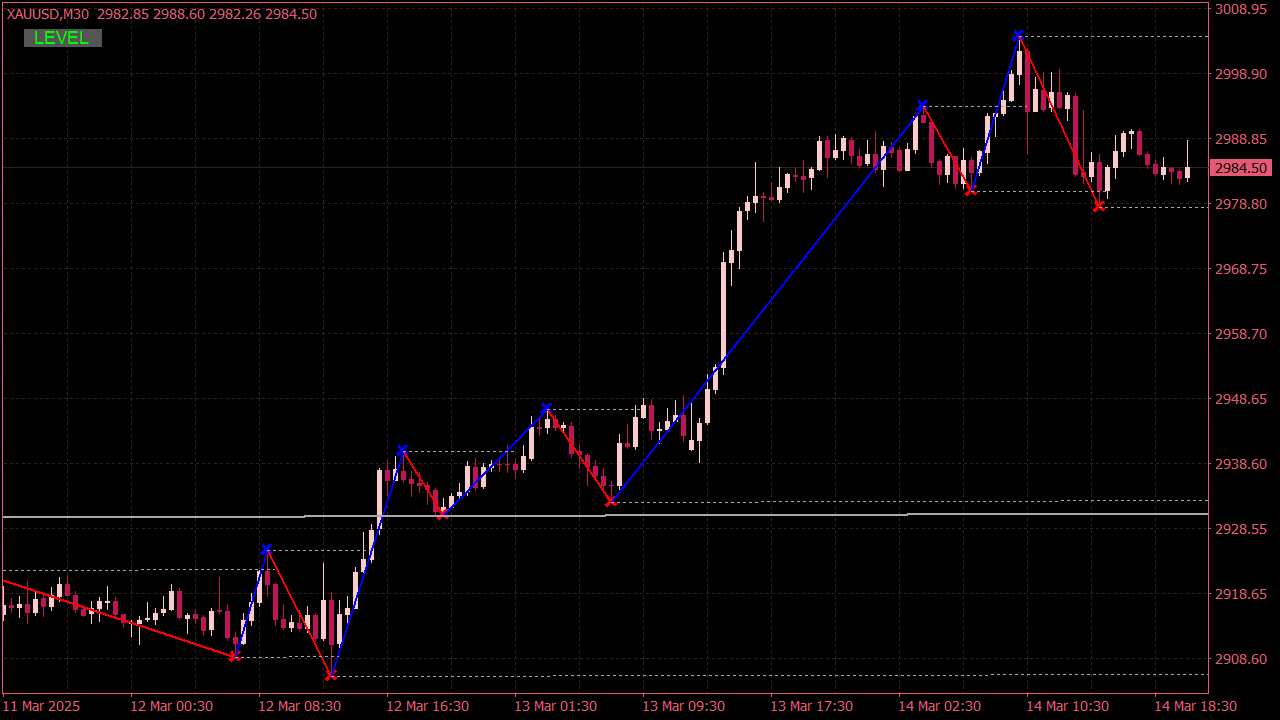
The ZigZag Pointer Indicator with Alert marks important swing highs and swing lows with clear arrows, giving you a cleaner view of how price is moving. Instead of reacting to every candle, you can focus on the areas where the market has actually made a noticeable turn. You can adjust the settings to make the indicator more or less sensitive, depending on the timeframe and trading style you use. When a new swing point appears, the alert lets you know without forcing you to watch the chart every second. Sometimes a small arrow is only part of the normal market noise. Sometimes it is the first sign that the current move is starting to lose strength. The interesting part is seeing what happens next.
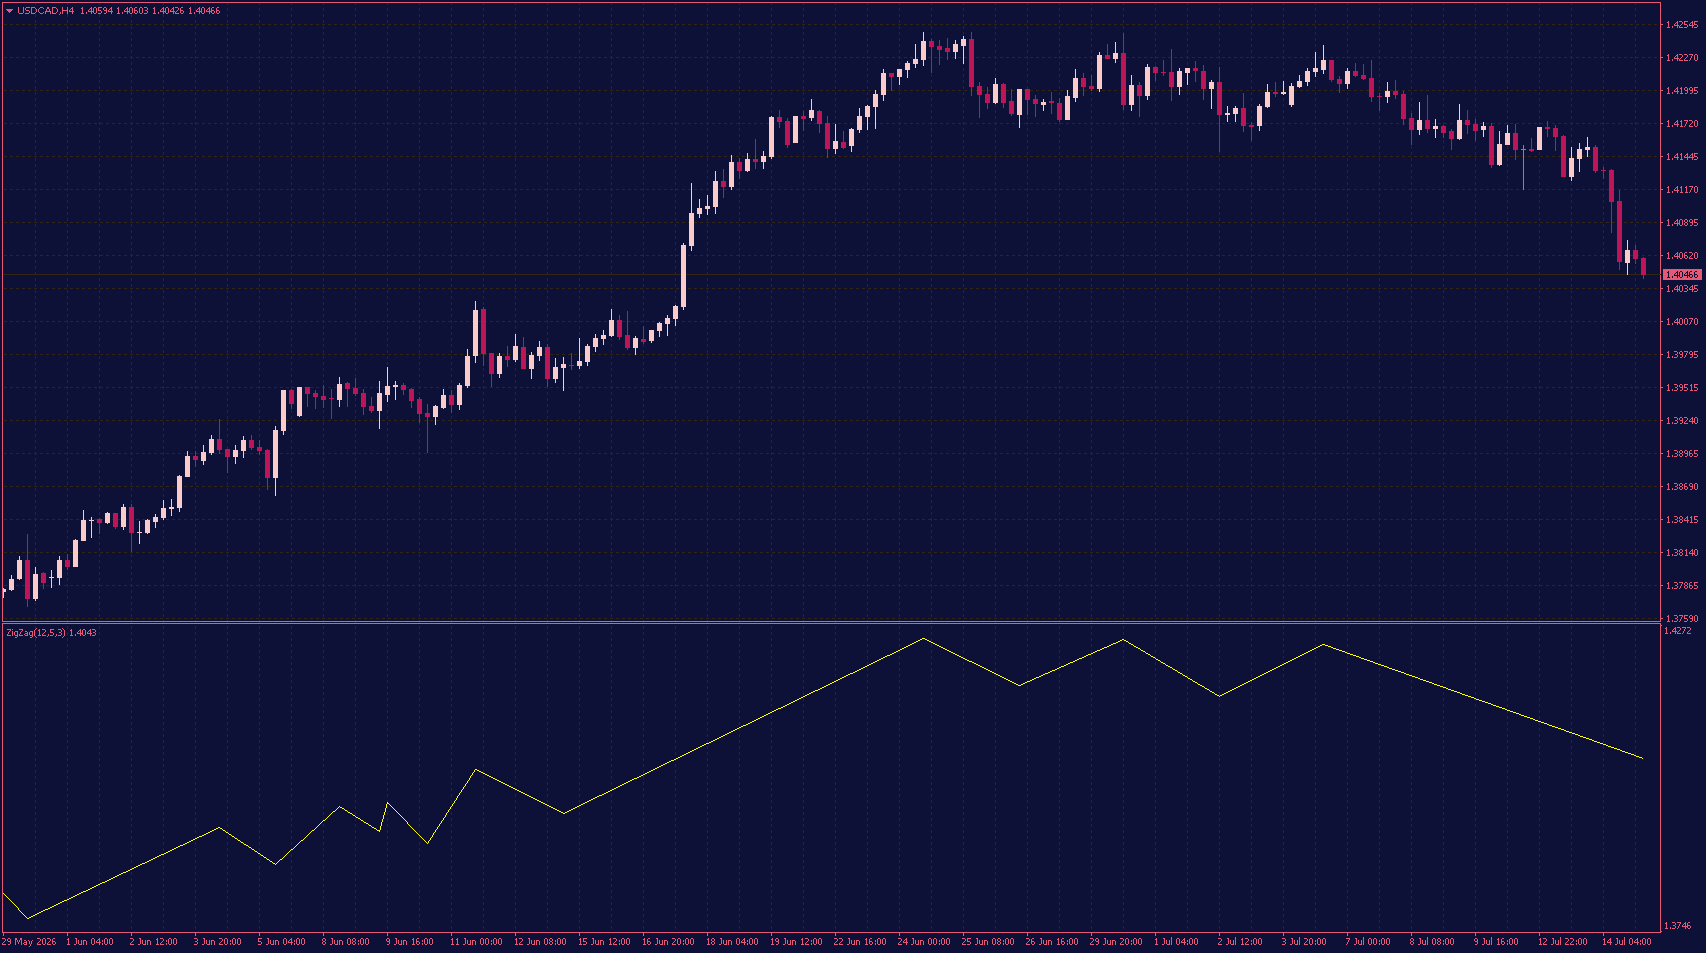
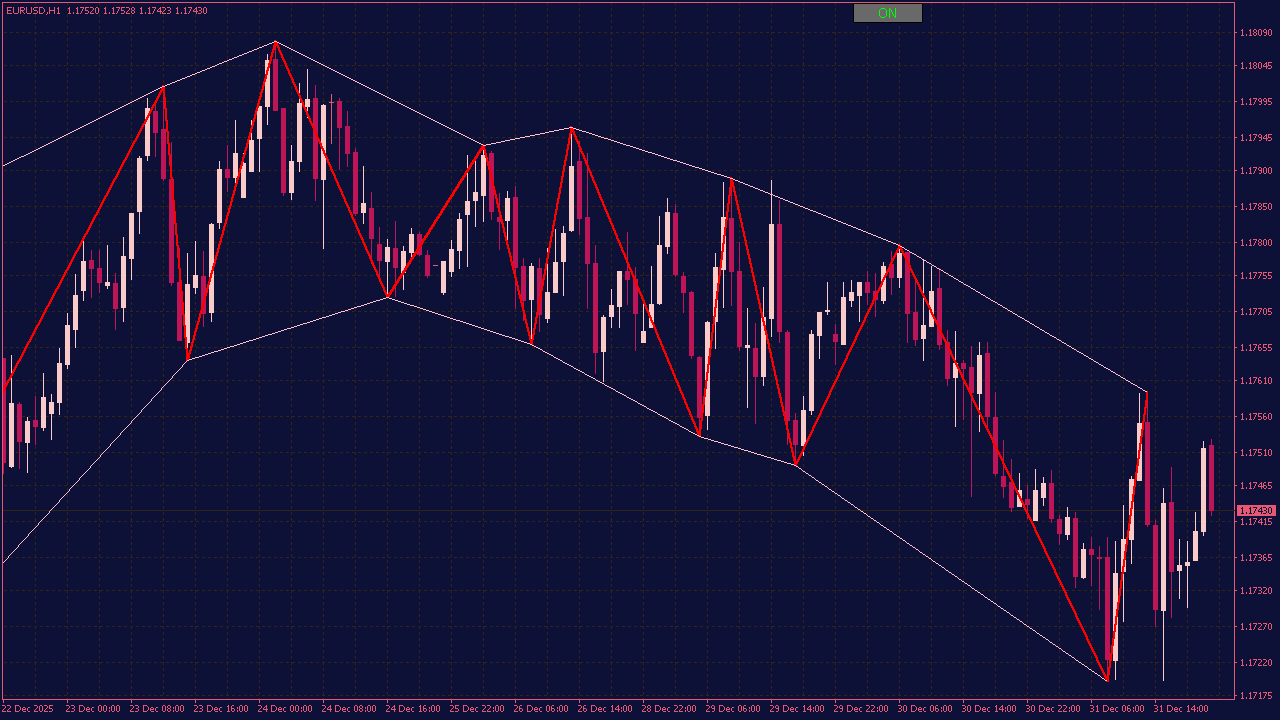
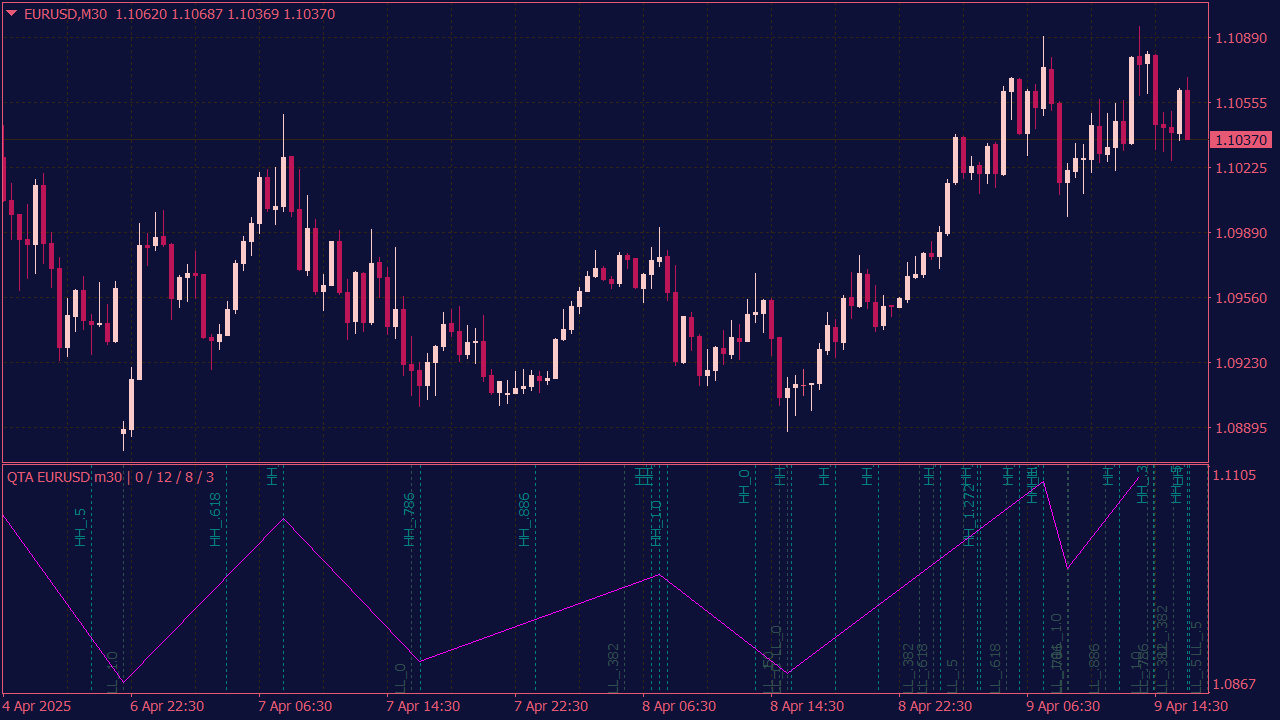
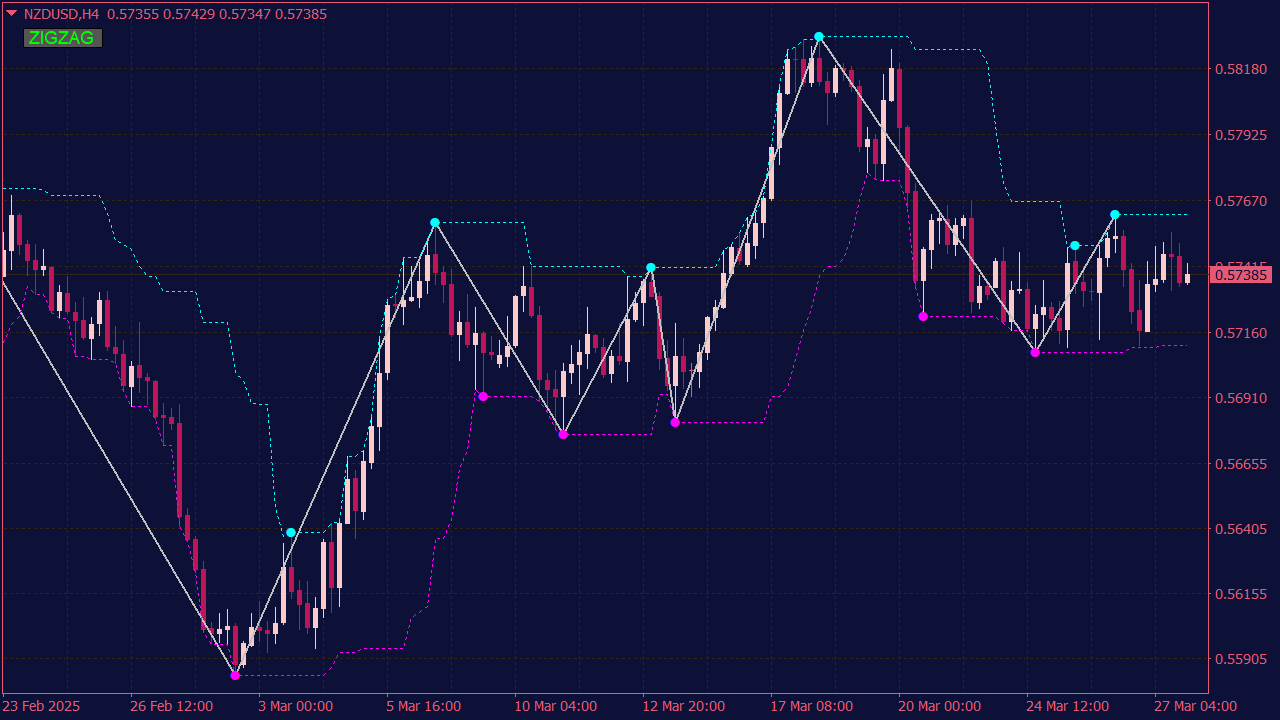
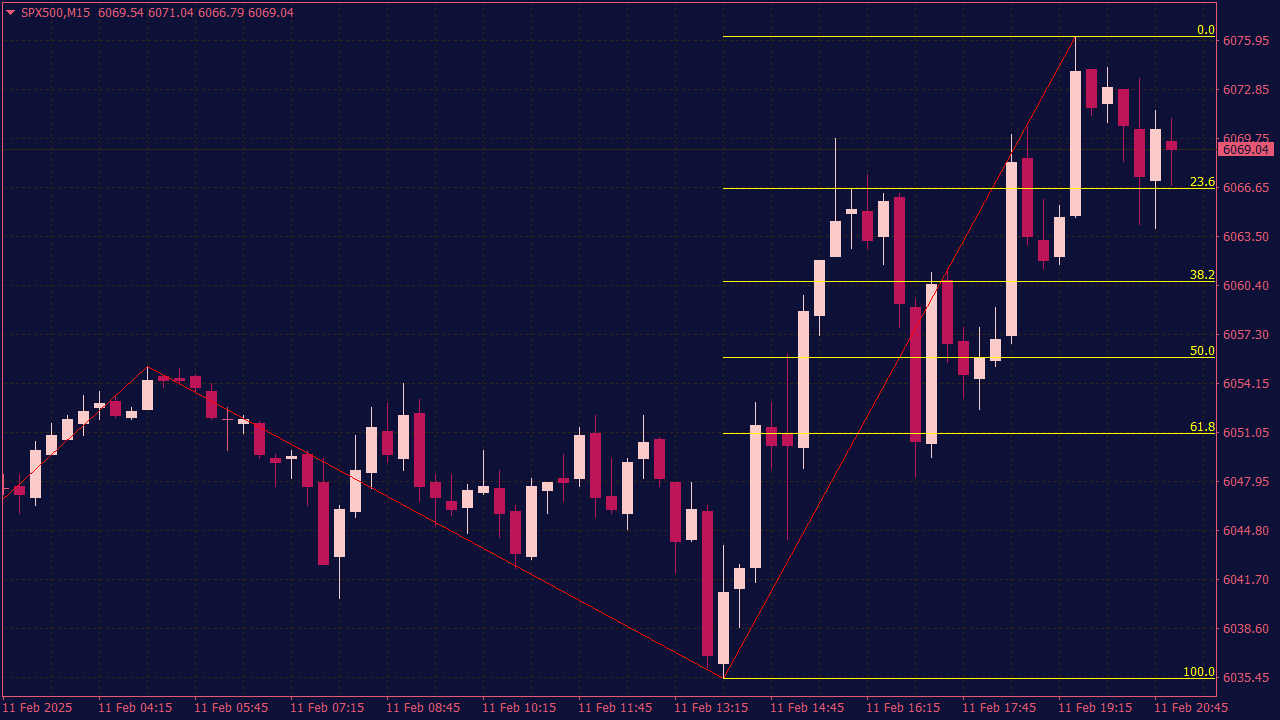
The ZigZag Separate Indicator gives you a simpler way to look at market swings. It filters out many of the smaller price movements and draws attention to the highs and lows that shape the bigger picture. Because the indicator appears in a separate window, your main chart stays clean and easy to read. You can adjust its settings depending on whether you want to follow larger moves or focus on shorter price swings. Sometimes the market looks completely random until one important turning point connects with another. That is where this indicator becomes interesting: it may help you notice a structure that was already forming, but was easy to miss.
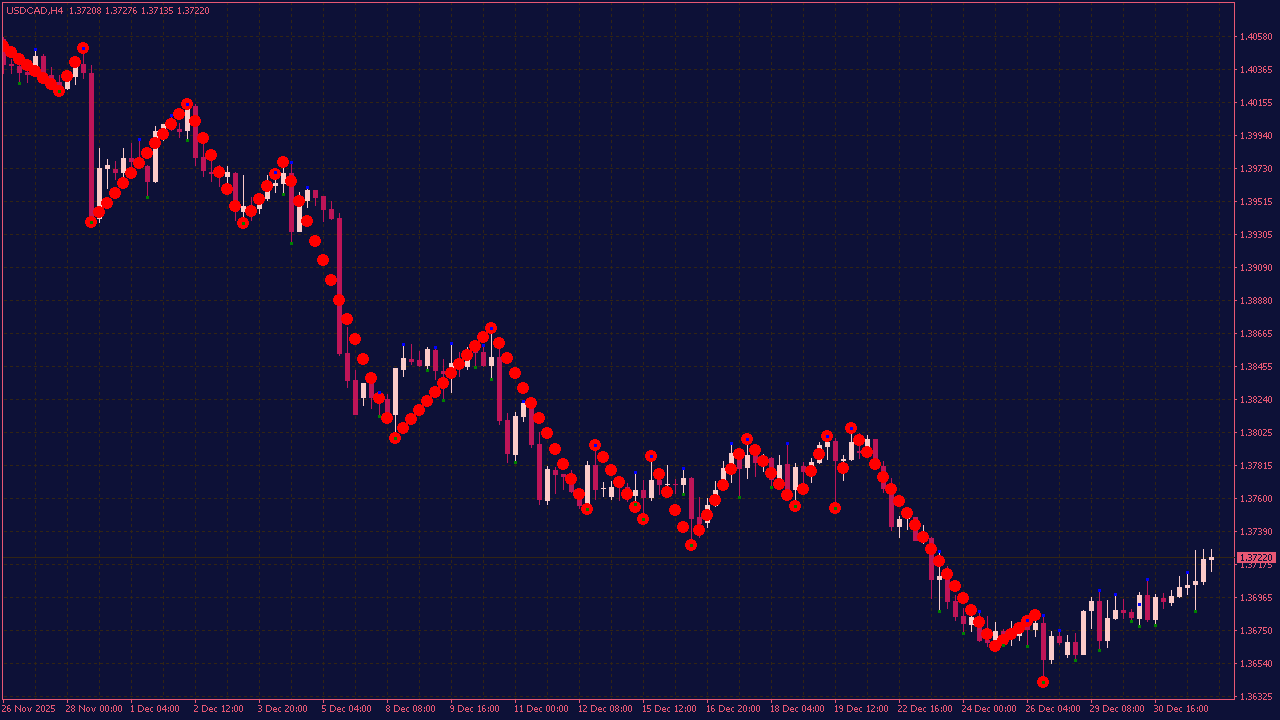
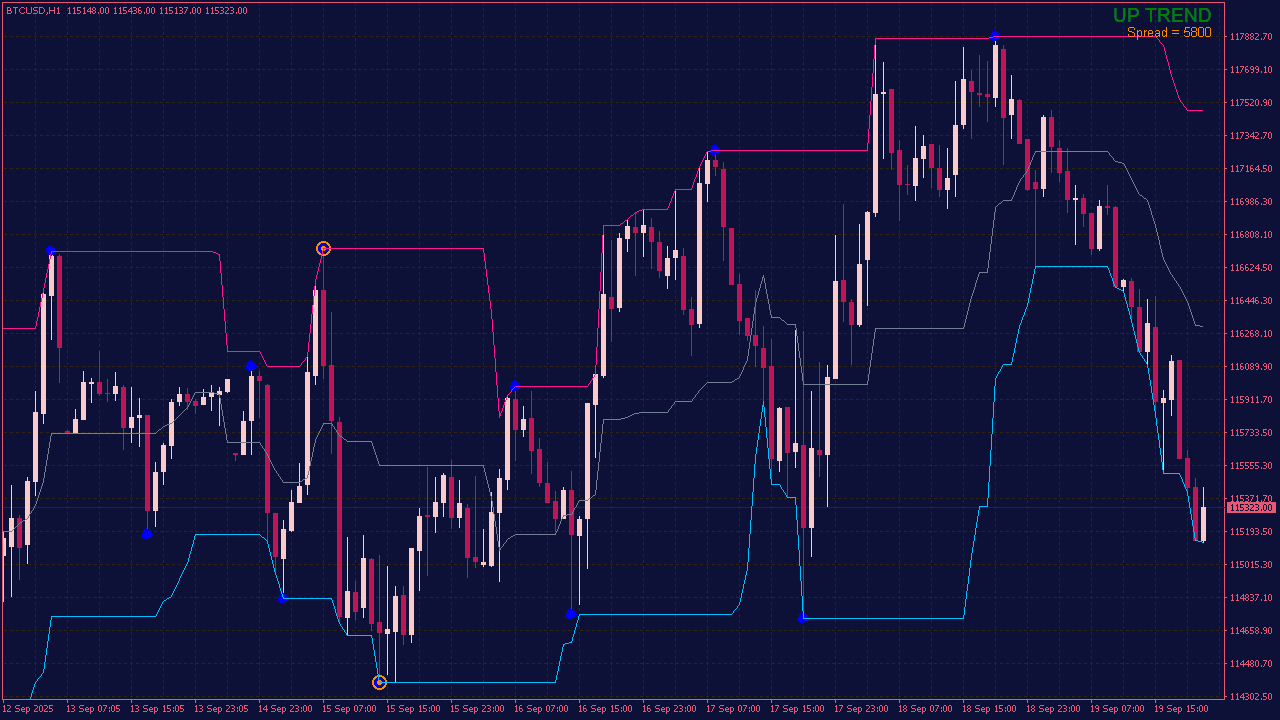
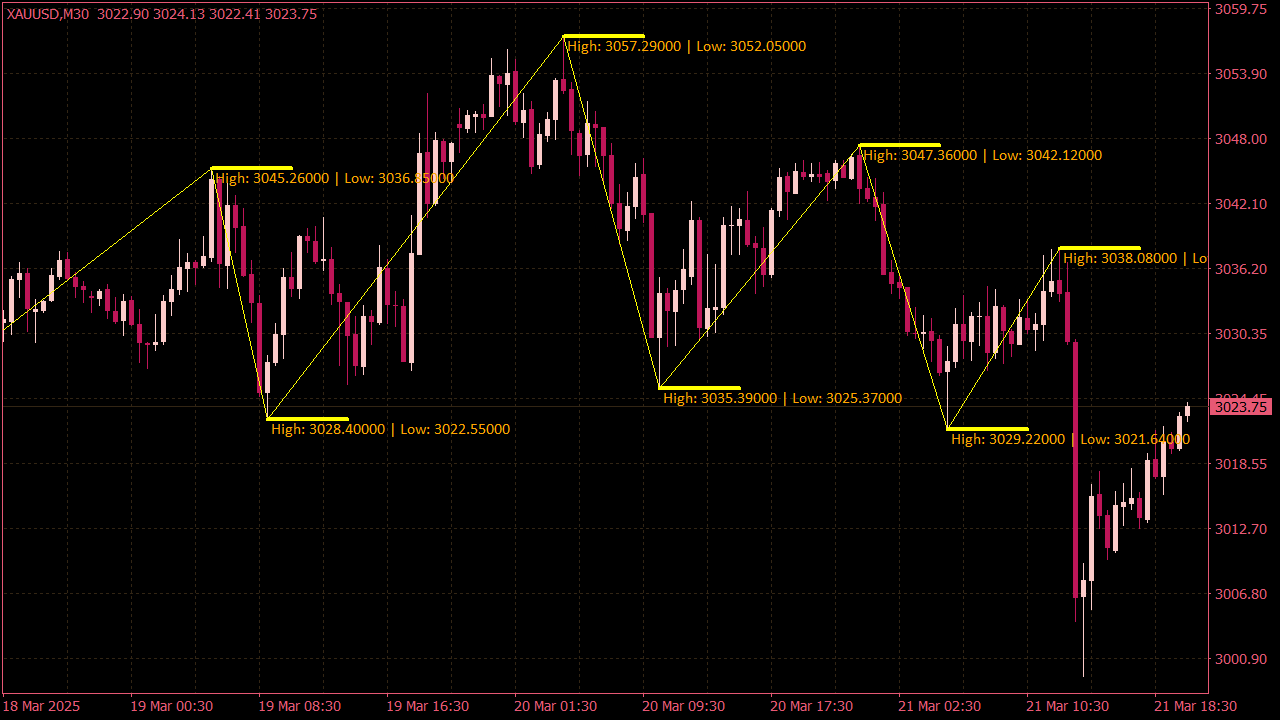
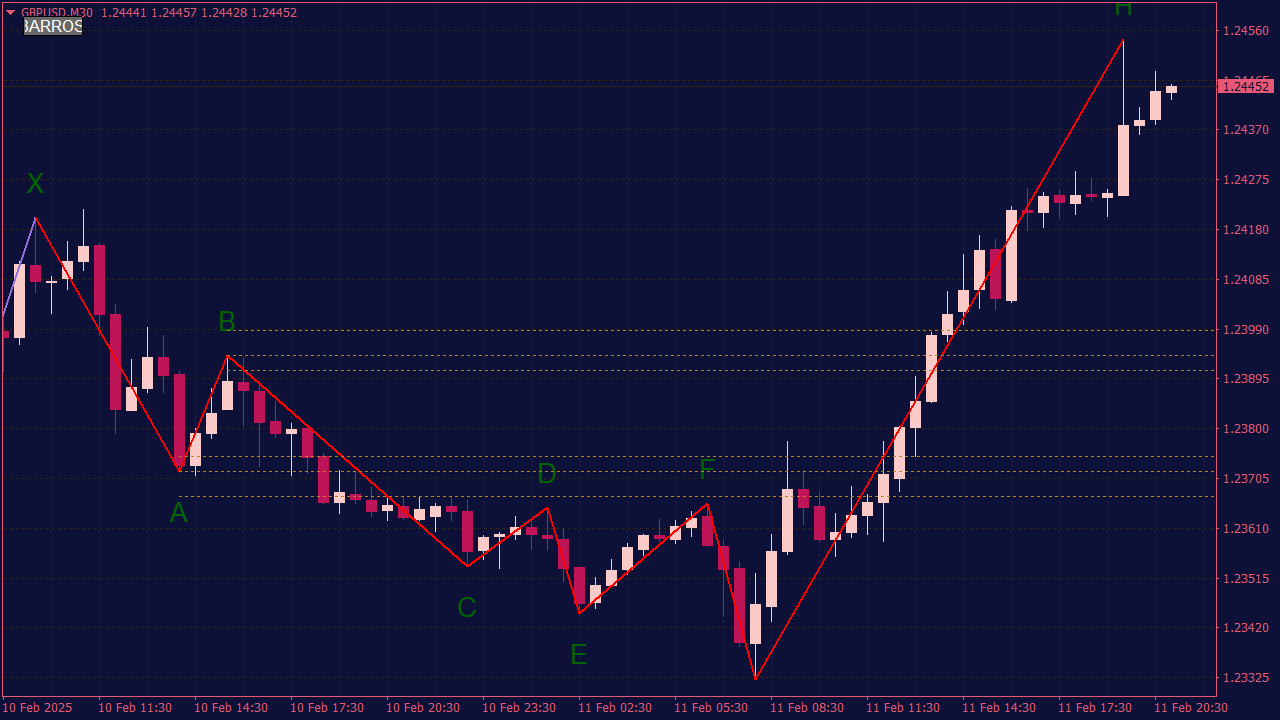
The Hidden ZigZag Indicator, often utilized in technical analysis, aims to identify potential trend reversals and support/resistance levels by filtering out price noise. Trading rules typically include:
Buy signals occur when the price breaks above a previous swing high identified by the indicator, suggesting upward momentum;
Sell signals emerge when the price drops below a previous swing low, indicating potential downward movement;
Use trend confirmation through additional indicators (e.g., moving averages or RSI) to validate entries;
Set stop-loss orders just beyond the last swing high/low to manage risk; and
Consider taking profits at identified support or resistance levels based on the ZigZag's plotted data. Always backtest strategies and adapt to current market conditions.
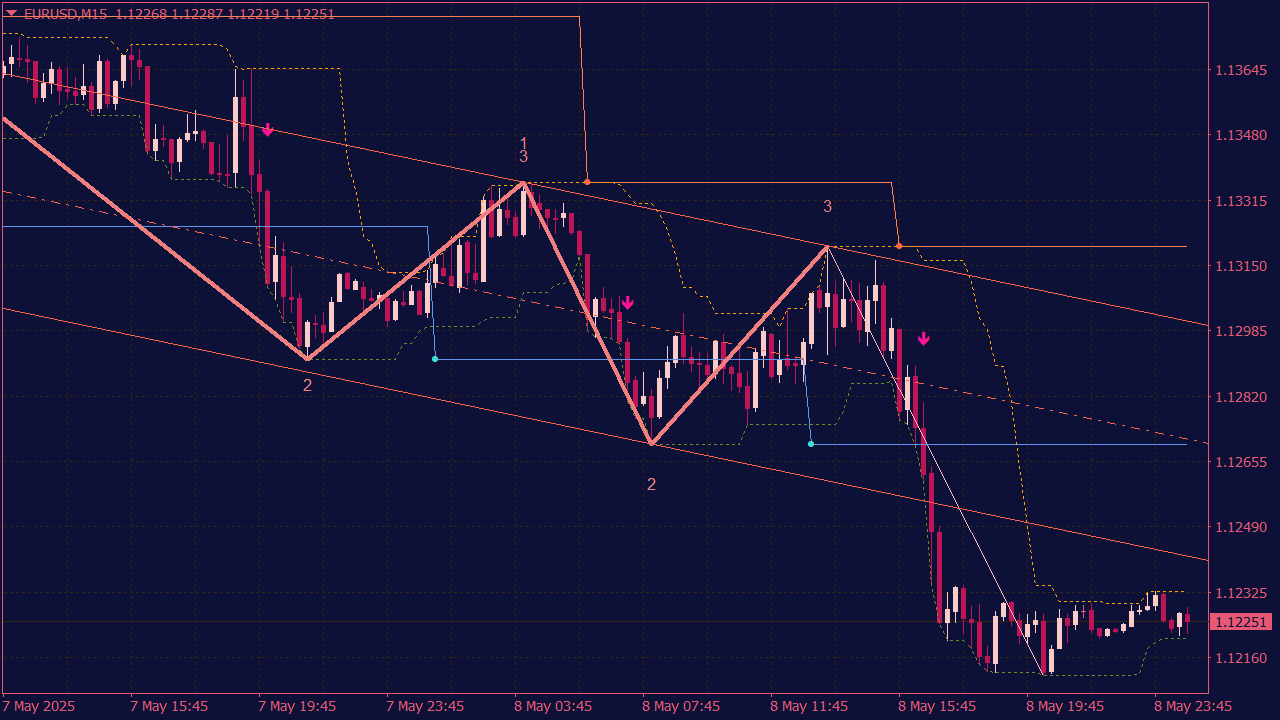
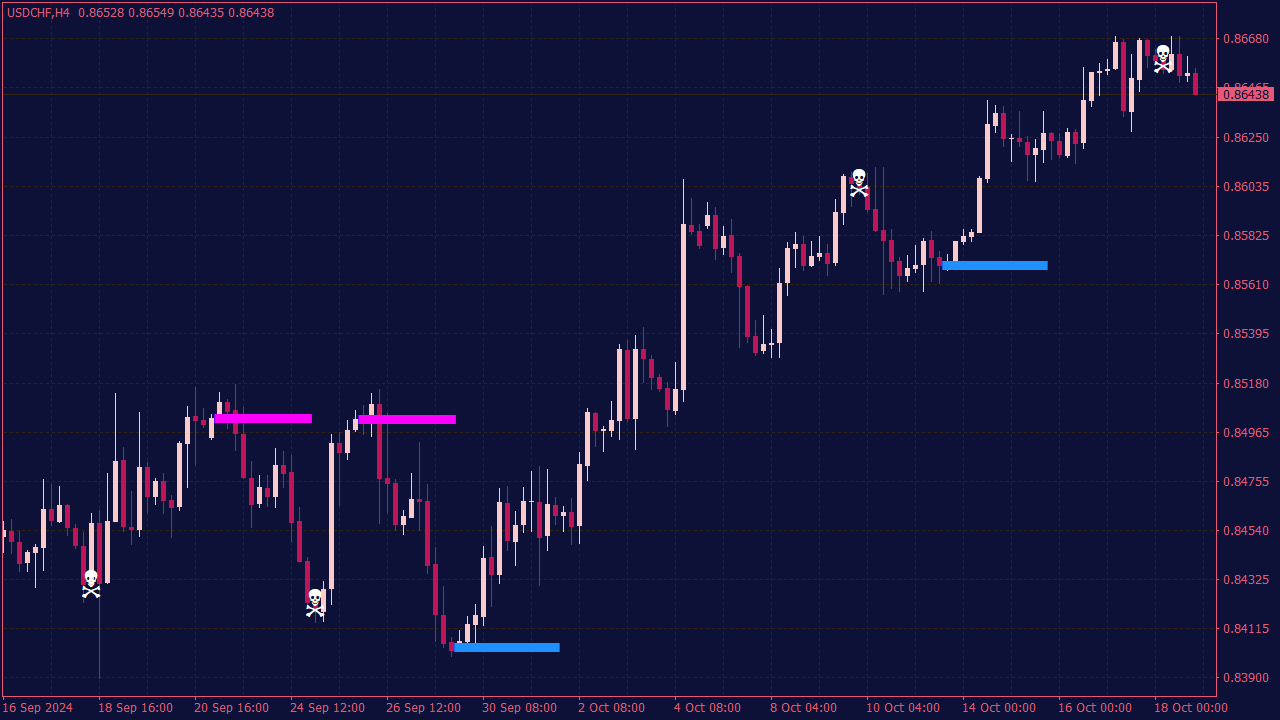
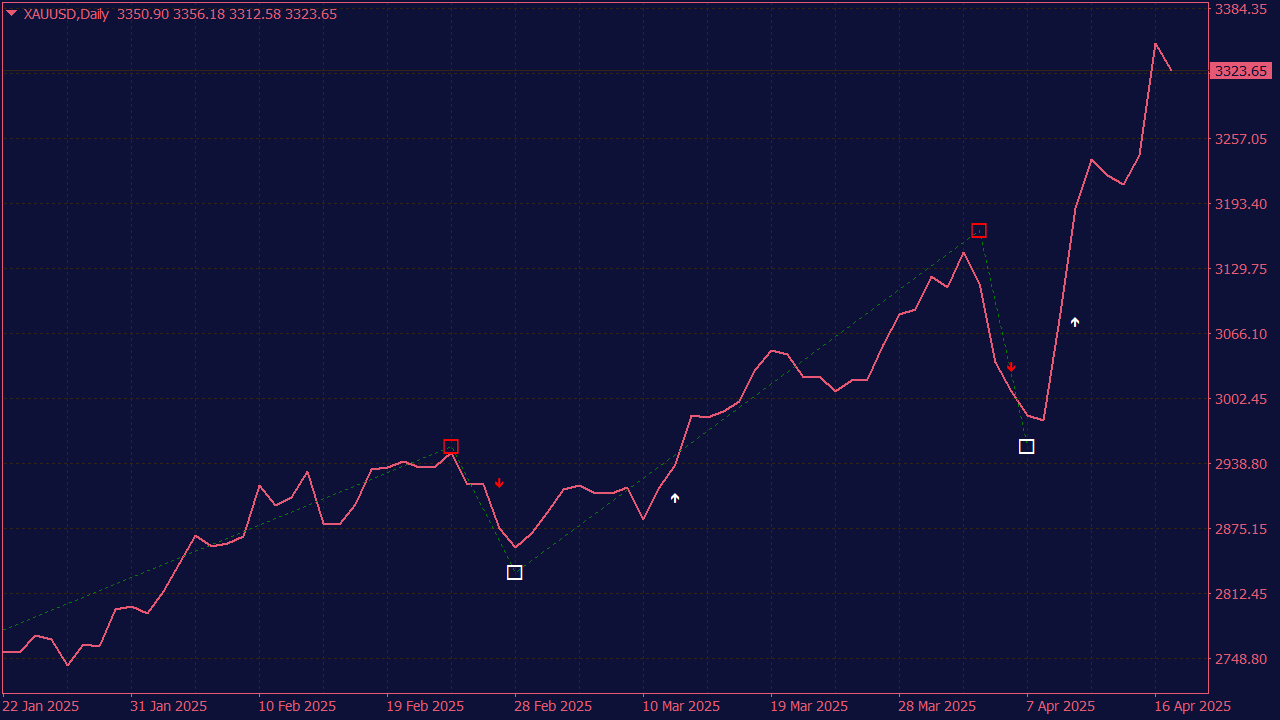
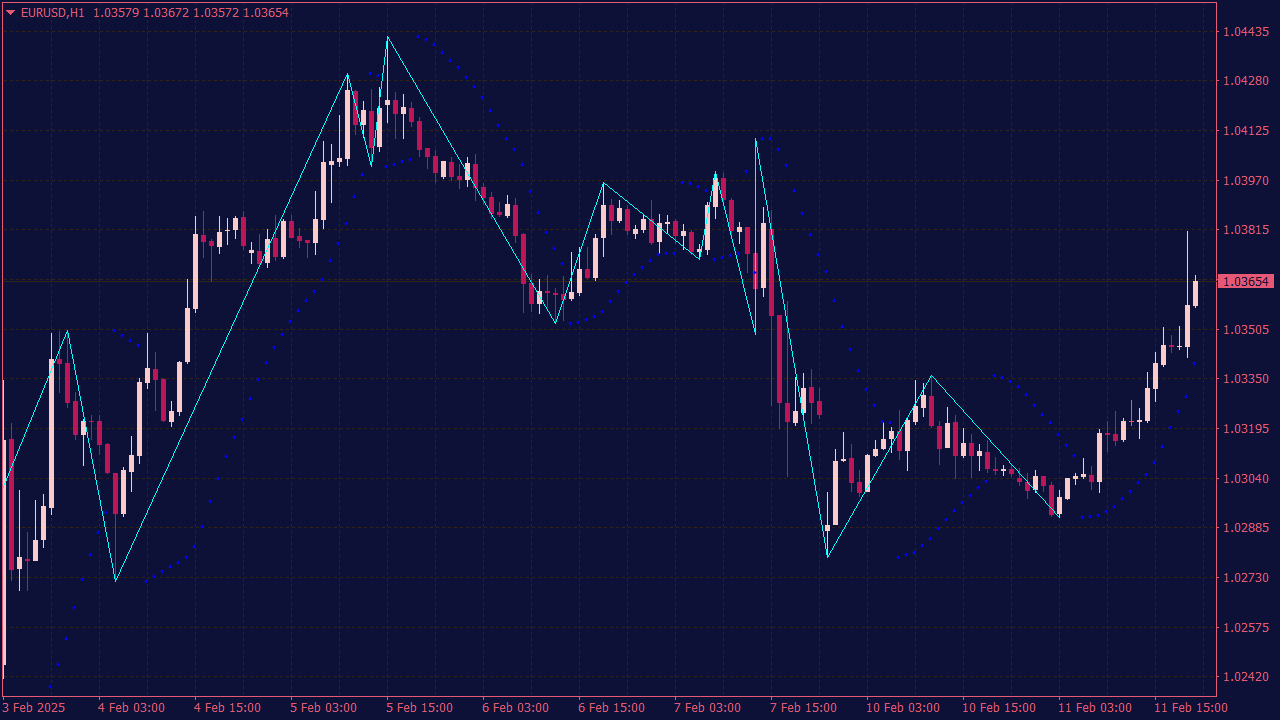
The 3 Level ZZ Semafor MTF with Alerts Indicator is a trading tool designed to identify potential market reversals and trend continuations using the ZigZag pattern across multiple timeframes. When trading entries are signaled, look for the following criteria: a confirmation of the zigzag pattern where the indicator highlights significant swing highs and lows, alerts that notify traders of potential changes in trend direction, and confluence with other technical indicators such as support/resistance levels or moving averages for added confirmation. Always consider risk management strategies and market context before executing trades based on these signals.
📈 The ZigZag Indicator: What Really Matters Between the Pivots
ZigZag is often dismissed as a repainting indicator that looks impressive only after the move is over. That criticism is fair—but incomplete. Used properly, it can reveal changes in market behavior that are easy to miss on a crowded chart.
Add the ZigZag indicator to almost any historical chart, and the market suddenly looks orderly. Minor fluctuations vanish. Major highs and lows appear neatly connected. Even a difficult trading session can look obvious in retrospect.
That visual clarity is both the indicator’s strength and its main weakness.
The latest ZigZag leg is not fixed. It continues to change until price reverses far enough to confirm a new pivot. A point that later appears at the exact high was not necessarily known to be a high at the time.
That makes ZigZag unsuitable as a mechanical reversal signal. It does not predict turning points, and it does not remove uncertainty.
What it can do is organize price action.
Once the noise is reduced, traders can compare one swing with another. They can study whether an impulse is becoming slower, whether corrections are gaining strength, whether a breakout is holding, and whether an established level still produces the reaction it once did.
The value is not found at the pivot itself. It is found in the way price travels from one pivot to the next.
🧭 Read Behavior, Not Just Direction
Most basic ZigZag analysis focuses on direction:
Higher highs and higher lows suggest an uptrend.
Lower highs and lower lows suggest a downtrend.
A broken swing is treated as a possible change in structure.
That framework is useful, but it is only a starting point.
Two bullish legs can cover the same distance while carrying very different information. One may develop quickly, with strong closes and shallow pullbacks. The other may take three times as long, overlap repeatedly, and barely move beyond the previous high.
Both produce a higher high. Only one shows efficient buying.
A better reading of ZigZag begins with a few practical questions:
How far did the latest leg travel?
How long did it take?
Was the correction stronger or weaker than previous corrections?
Did price remain beyond the level it broke?
Did the opposing side behave differently from before?
These questions are more useful than trying to guess where the next line will turn.
🧱 When a Strong Level Stops Acting Strong
Previous swing highs and lows naturally attract attention. Traders place entries, stops, and profit targets around them, which often makes these areas relevant.
But a visible level is not automatically a strong level.
Imagine that price reaches a confirmed ZigZag high and falls sharply. The first rejection covers a large distance. When price returns for a second test, the decline is smaller. On the third approach, sellers produce little more than a pause.
Resistance still exists on the chart, but it is no longer producing the same result.
That change can be more informative than the level itself.
A strong resistance area should push price away. When the market repeatedly returns, stays close to the high, and produces increasingly shallow pullbacks, selling pressure may be weakening.
Typical signs include:
Each rejection covers less distance.
Price returns to the level in fewer candles.
Corrective legs become smaller beneath resistance.
The market spends more time near the upper boundary.
Breakout attempts begin to close near or above the previous high.
The mistake is to keep selling the level simply because it worked before.
A more useful approach is to observe whether the level still creates separation. If price eventually closes above it, the breakout does not need to be chased. A controlled retest may provide better information.
When former resistance begins to hold as support and the lower-time-frame structure turns higher again, the market is doing more than touching a line. It is showing acceptance above the old boundary.
The same logic applies in reverse at support.
⚡ The Fast Return
Distance receives most of the attention in technical analysis. Time is often ignored.
Suppose a currency pair falls 70 pips from a swing high. If it needs 25 candles to recover, the rebound may be a slow correction. If price recovers the same decline in six candles, the situation looks different.
Sellers created movement, but they could not maintain it.
The fast return becomes particularly interesting when the recovery is cleaner than the decline. Price stops producing meaningful lower lows, regains lost ground quickly, and breaks the final internal lower high.
A bullish sequence might develop as follows:
A confirmed swing high forms.
Price pulls back, but downside progress begins to slow.
The market fails to extend below the latest minor low.
The recovery covers the decline in significantly less time.
Price breaks the final lower-time-frame reaction high.
The previous major high is not automatically the entry. The market may still stall beneath it.
What matters is the response after the internal break. Does price create distance, or does it remain trapped around the trigger level?
A structural break without follow-through may be no more than noise. A fast return followed by clean expansion carries more weight.
↩️ The Break That Fails
Market structure is frequently reduced to a simple rule: a lower low is bearish, and a higher high is bullish.
Real price action is rarely that clean.
A market can trade below a previous ZigZag low, trigger stops, attract short sellers, and then recover the entire breakdown within a few candles. The lower low is real, but the bearish continuation never arrives.
That failure can be more informative than the break.
A genuine bearish transition should normally remain below former support and continue to make downside progress. When price quickly reclaims the level, the market may have trapped traders who reacted to the first sign of weakness.
For a bullish reclaim, look for a sequence rather than a single candle:
The broader structure was bullish before the breakdown.
Price trades below a confirmed swing low.
The break produces little continuation.
Price closes back above the former swing area.
A higher low develops on the entry time frame.
The internal reaction high is broken.
The reclaim alone is not enough. Markets often bounce after a sharp decline without changing direction.
The higher low and subsequent break provide evidence that buyers have rebuilt the short-term structure. If price remains below the old level and continues to form lower highs, the bullish idea has not earned confirmation.
This distinction matters. A failed break is not simply a wick through support. It is a breakout that the market cannot maintain.
📉 A New High With Less Progress
Trends do not always end with an obvious reversal candle. They often deteriorate gradually.
Price may continue to make higher highs while each new advance becomes less convincing. The market still looks bullish, but the quality of the movement is fading.
Warning signs can include:
The latest impulse is shorter than the previous one.
It requires more candles to reach the new high.
The preceding correction is deeper than earlier pullbacks.
Price exceeds the previous high by only a small margin.
The market quickly falls back into the old range.
A marginal new high is not a short signal. Trends can continue slowly for longer than expected, and traders who try to pick the exact top often enter too early.
The stronger evidence comes from what happens next.
If a weak advance is followed by a fast decline that breaks the final corrective low, the balance may be changing. If the subsequent recovery is slow and forms a lower high, the bearish case becomes more credible.
The important feature is the contrast.
The bullish side needs more time to achieve less progress, while the bearish side suddenly creates more damage in less time.
That is more meaningful than the new high itself.
🌀 Compression Before Expansion
Some of the clearest ZigZag structures develop when the market appears inactive.
Each swing becomes smaller. Volatility contracts. Price moves back and forth without creating meaningful distance.
This is not automatically a trading opportunity, and it does not predict which side will break first. It does, however, show that the market is moving toward a decision point.
A typical compression may begin with one broad leg followed by several progressively smaller swings. The exact shape is less important than the repeated contraction.
There are two sensible ways to approach it.
An aggressive trader may wait for a decisive close outside the compressed range, particularly when the move agrees with the higher-time-frame trend.
A more patient trader may wait for the breakout and then observe the retest. If the former boundary holds and price resumes in the breakout direction, the market has shown some acceptance outside the old range.
The best filter is simple: Does price move away?
A convincing breakout should create separation. When price leaves the compression and immediately closes back inside, the move has not yet proved anything.
The market may still break later, but the first attempt did not produce expansion.
💥 When the Opposing Side Changes Character
Every trend develops a rhythm.
In an established uptrend, bearish pullbacks may usually be slow, overlapping, and shallow. They interrupt the advance without seriously threatening it.
Then one decline appears that looks completely different.
It moves faster. It covers more distance. Candles close near their lows, and several minor swing points break with little reaction.
This does not prove that the trend has reversed. It does show that sellers are behaving differently.
The first unusually strong countertrend leg is often a poor place to enter. Price may already be near support, and the move may be reacting to temporary volatility.
The recovery usually provides better information.
If buyers remain in control, they should reclaim a meaningful portion of the decline. If the rebound is slow, shallow, and unable to recover the broken structure, the original sell-off becomes more significant.
A bearish case is stronger when:
The decline is larger than recent corrections.
It develops in fewer candles.
The recovery takes longer but covers less distance.
Price forms a lower high beneath broken support.
The market then breaks the recovery’s internal low.
A trend is not vulnerable simply because it has lasted a long time. It becomes vulnerable when the previously weaker side begins to move with greater force and efficiency.
🚫 The Breakout That Cannot Hold
Not every failed breakout produces a dramatic reversal.
Some fail quietly.
Price trades above a confirmed ZigZag high, but the new leg barely extends. The market falls back below the level, moves above it again, and continues crossing the same area.
The breakout happened, but price cannot remain outside the old structure.
That lack of acceptance matters.
Common warning signs include:
The new impulse barely clears the previous pivot.
Several candles close back inside the former range.
The breakout leg is smaller than the correction before it.
Price repeatedly crosses the same level.
The first opposing leg erases most of the advance.
It is usually premature to sell the first wick above resistance. Strong breakouts can retest levels before continuing.
A better bearish case develops when price returns below the old high, fails to reclaim it, and forms a lower high. A subsequent break of short-term support provides structural confirmation.
The setup is not based on the fact that price briefly moved beyond resistance. It is based on the market’s inability to remain there.
🧪 The Backtesting Problem Most Traders Miss
ZigZag systems often look exceptional on completed charts because historical pivots are plotted at the final extreme.
The trader did not know that the extreme was final when it occurred.
A reversal had to take place before the pivot became confirmed. By that point, price may already have traveled a significant distance away from the ideal entry.
A realistic test must distinguish between three separate events:
The candle on which the high or low occurred
The later candle on which the pivot became confirmed
The first price that could realistically have been traded
Treating those events as though they happened at the same time creates a hindsight advantage.
For every historical signal, record the confirmation time, the available entry price, the spread, realistic slippage, and the distance already traveled before confirmation.
The active ZigZag leg must also be allowed to move during the test exactly as it would have moved under live market conditions.
This will usually make the strategy look less impressive.
That is not a flaw in the research. It is the purpose of the research.
A backtest should challenge an idea, not protect it.
🎯 Use ZigZag to Eliminate Weak Trades
Many traders search for an indicator that produces more entries. ZigZag may be more valuable when it helps remove poor ones.
A setup deserves caution when:
It develops in the center of a broad range.
The latest pivot remains unconfirmed.
The target is blocked by a nearby swing level.
The correction is stronger than the intended impulse.
The breakout creates no meaningful follow-through.
The expected move is too small relative to trading costs.
The higher time frame directly contradicts the position.
One question is particularly useful: Would the trade still make sense if the ZigZag lines were removed?
If the answer is no, the indicator may be replacing analysis rather than improving it.
ZigZag should clarify a trading idea. It should not be the only reason the idea exists.
✅ Five Questions Before Taking the Trade
What has actually changed? Identify the shift in behavior. A new pivot on its own is not enough.
What confirms the idea? Define the close, structural break, or retest required before entry.
Where is the idea invalidated? The stop should be linked to market structure rather than an arbitrary cash amount.
Is there enough room? A technically valid setup may still offer poor value when the next major level is too close.
Was the signal available in real time? Do not judge a method using information that appeared only after the move was complete.
🔍 Final Perspective
The ZigZag indicator does not reveal a hidden map of institutional orders. It cannot identify every turning point, and no parameter setting can remove uncertainty.
Its usefulness is more modest—and more practical.
It can show when a level stops producing strong reactions. It can reveal that a recovery is faster than the decline. It can highlight a new high that achieves almost no progress, a correction that is stronger than the corrections before it, or a breakout that repeatedly fails to hold.
These changes matter because markets often change character before they change direction.
ZigZag is most useful when it helps the trader notice that shift. It should organize price action, sharpen the analysis, and make invalidation easier to define.
It should never be expected to predict the next pivot.
📝 Editor’s Note
The strategies and market concepts discussed in our content are designed to help readers better understand market behavior. They are not trading recommendations. Financial markets are volatile, and every trader should test ideas carefully, manage risk and make independent decisions.