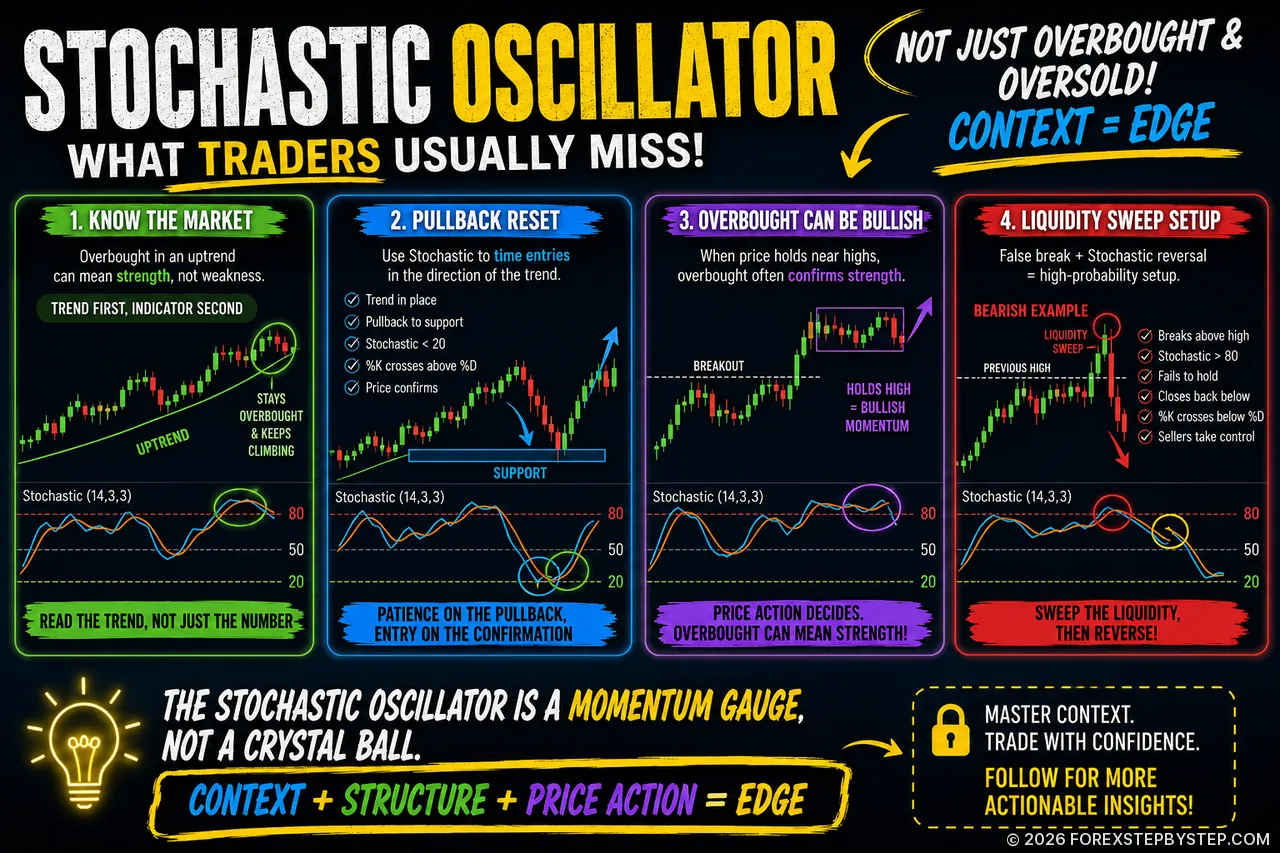
The same Stochastic Oscillator signal can mean trap, strength or reversal. The difference is hidden in price action and market context.
🎯 The Stochastic Mistake Traders Often Notice Too Late
The Stochastic Oscillator looks easy at first: above 80 suggests overbought, below 20 suggests oversold. But anyone who has watched Forex charts in a strong move knows those signals are not always warnings. Sometimes an overbought reading simply shows that buyers still have control. Sometimes oversold means sellers are not finished yet.
This article takes a closer look at how traders can read the indicator with more context instead of treating it as a buy-or-sell shortcut. It covers pullback resets, liquidity sweeps, hidden divergence, session timing, the 50 line, and those quiet moments when waiting is better than forcing a trade.
The point is simple, but often missed: Stochastic becomes more useful when it confirms what price is already suggesting—not when it replaces price action.
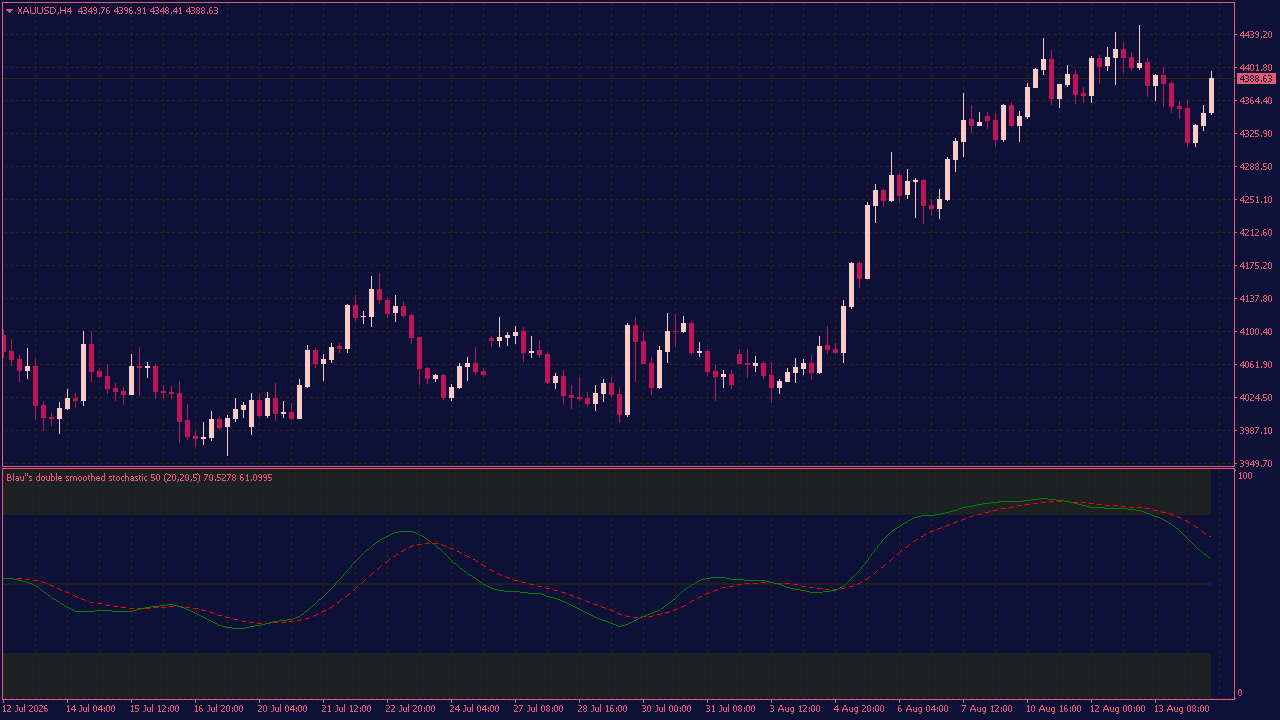
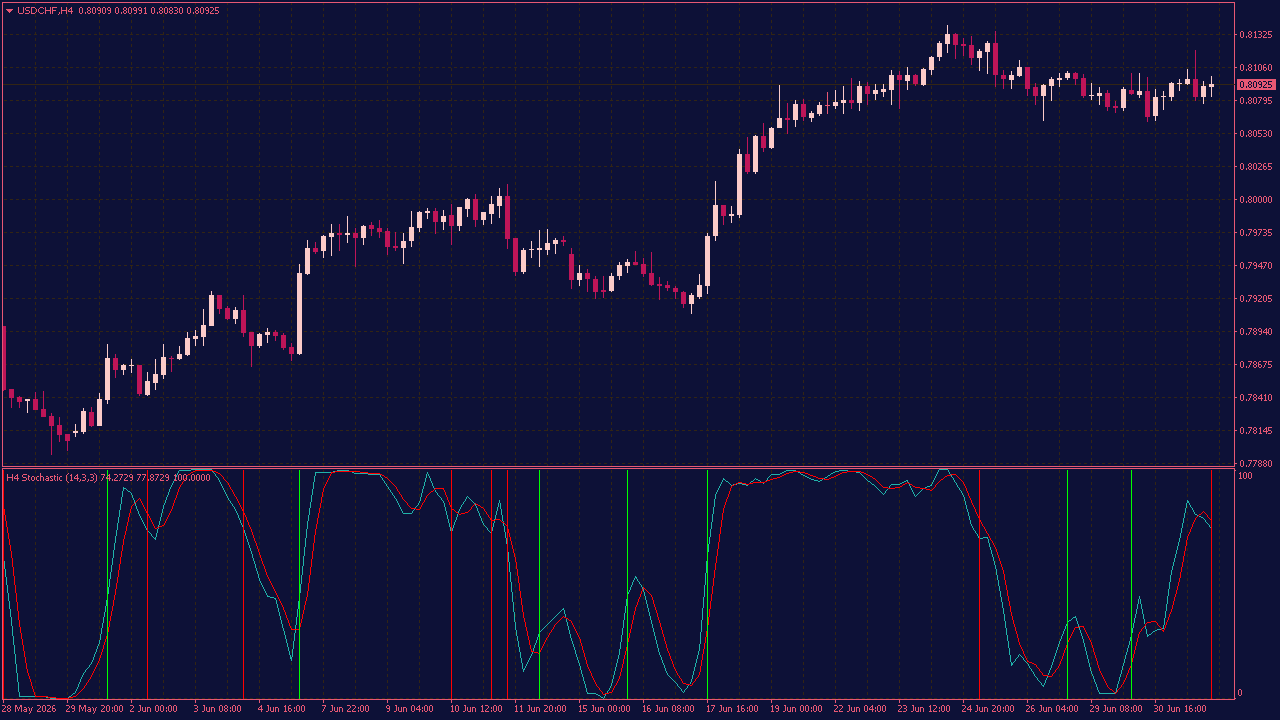
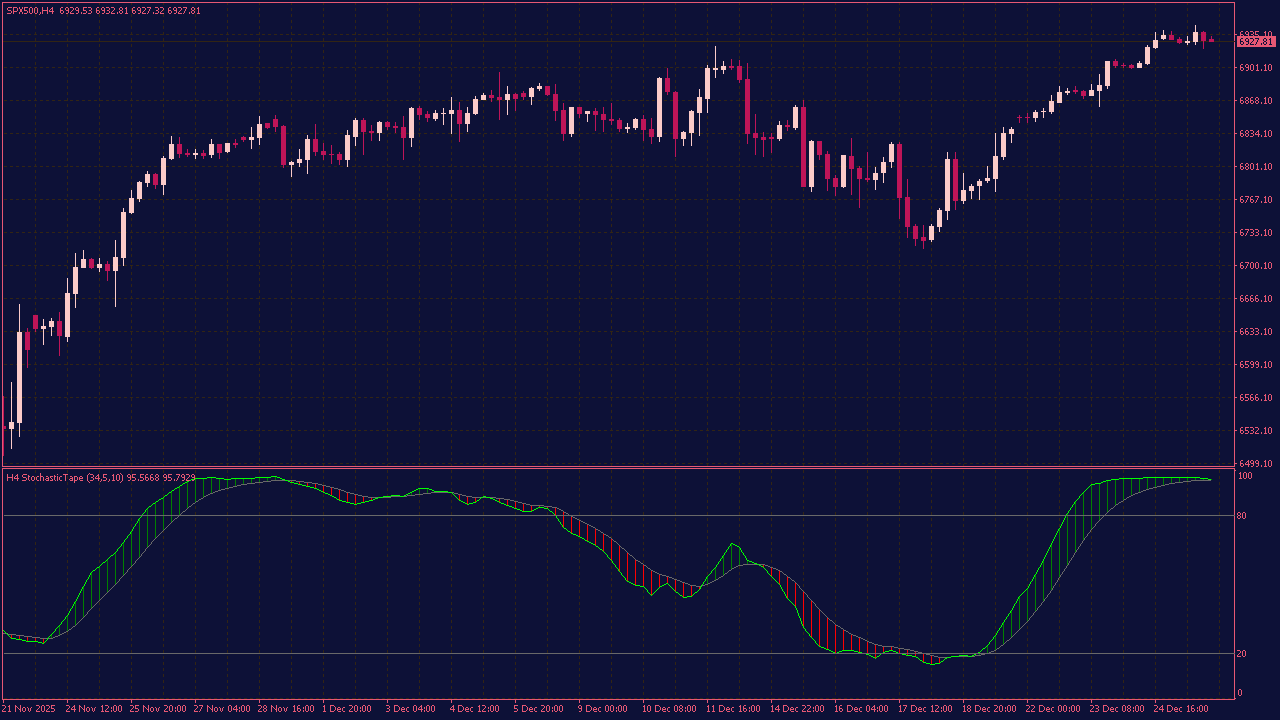
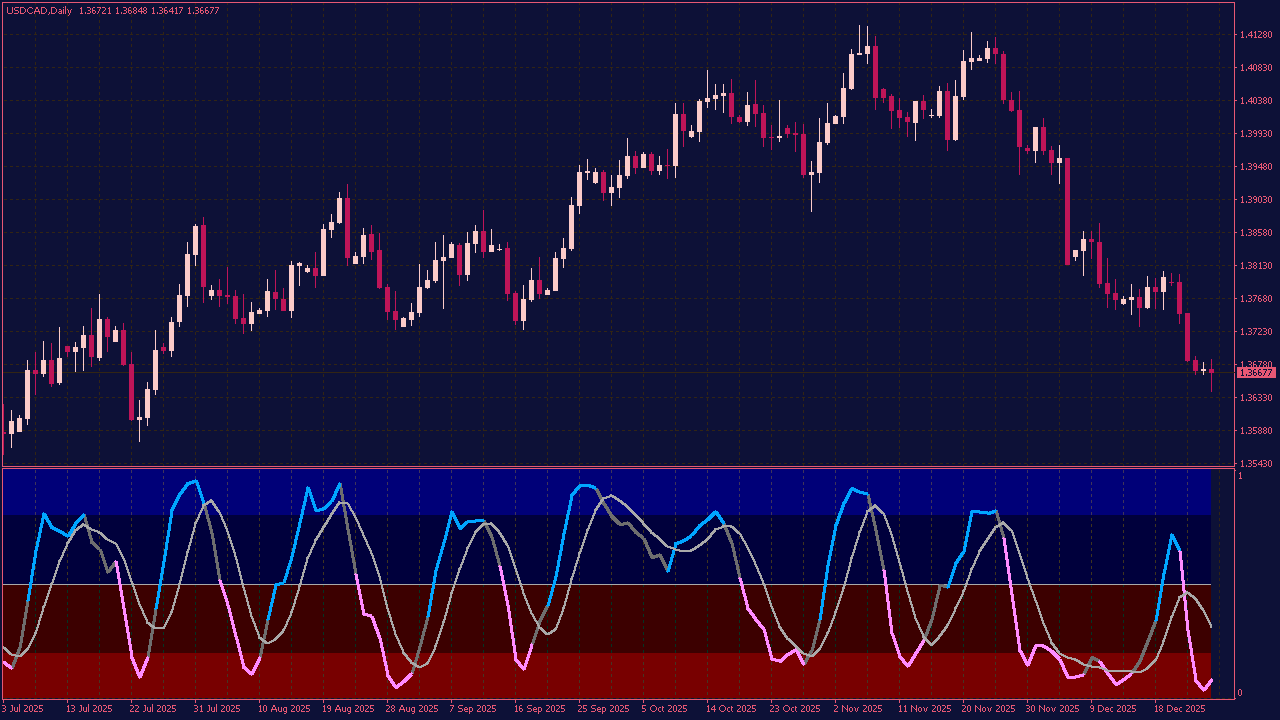
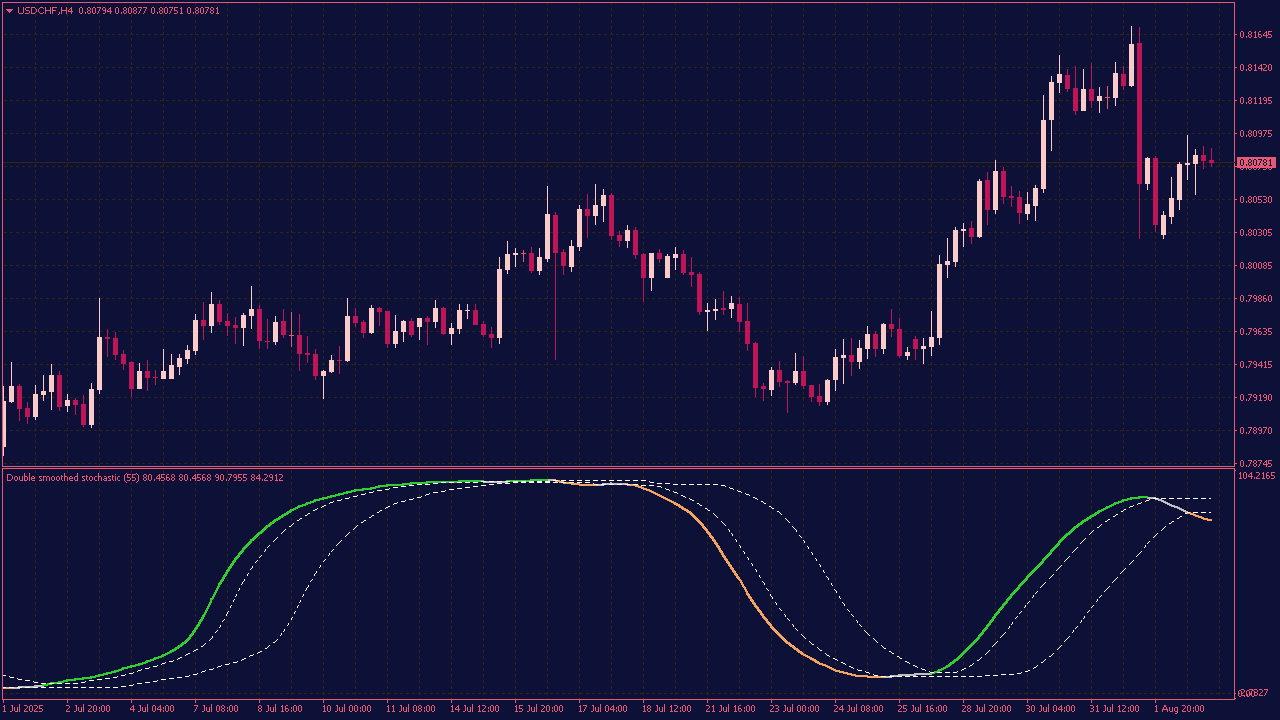
The William Blau Double Smoothed Stochastic Indicator gives a slightly different take on momentum. Instead of jumping around with every small price move, it smooths the stochastic calculation twice, which makes the lines calmer and often easier to read when the market gets noisy. You still get the familiar 0–100 scale, along with the 20, 50 and 80 levels, but the interesting part is how the two lines react around those areas. Sometimes they cross quickly, sometimes they hesitate, and sometimes momentum starts to turn while price is still pushing in the same direction. That last part is probably what makes the indicator worth watching. A chart can look perfectly normal, while the oscillator is already showing that something has changed underneath. It will not predict every reversal, of course — but from time to time, those small shifts tell you more than the price candles do at first glance.
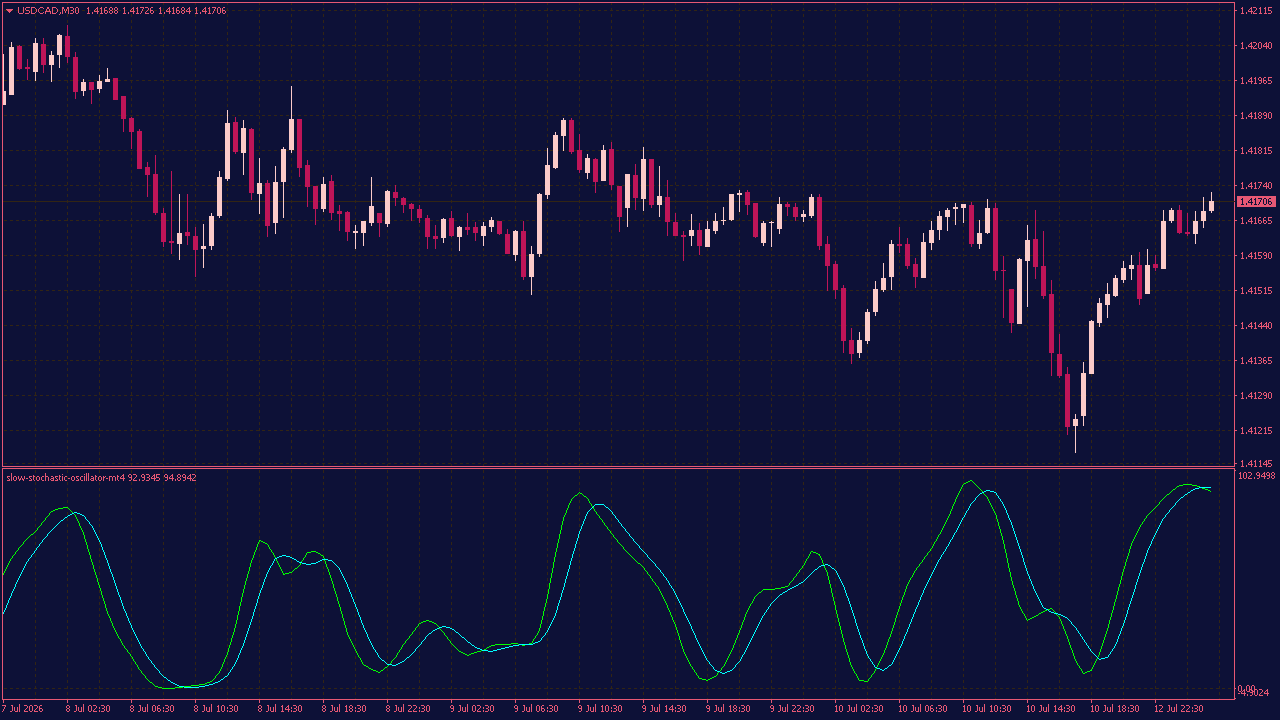
The Slow Stochastic Oscillator is made for traders who prefer a calmer and cleaner view of momentum. Instead of jumping around with every small price change, it smooths the main and signal lines so the broader movement becomes easier to follow. This can help when looking for potential changes in direction, stretched market conditions, or moments when buying or selling pressure begins to fade. It is also useful for checking whether a price move still has enough momentum behind it or is slowly running out of strength. The interesting part is not always the crossover everyone is waiting for. Sometimes the real clue is a line that stops rising, changes direction early, or fails to follow the price. These small details are easy to overlook, yet they can be the moments that deserve the most attention.
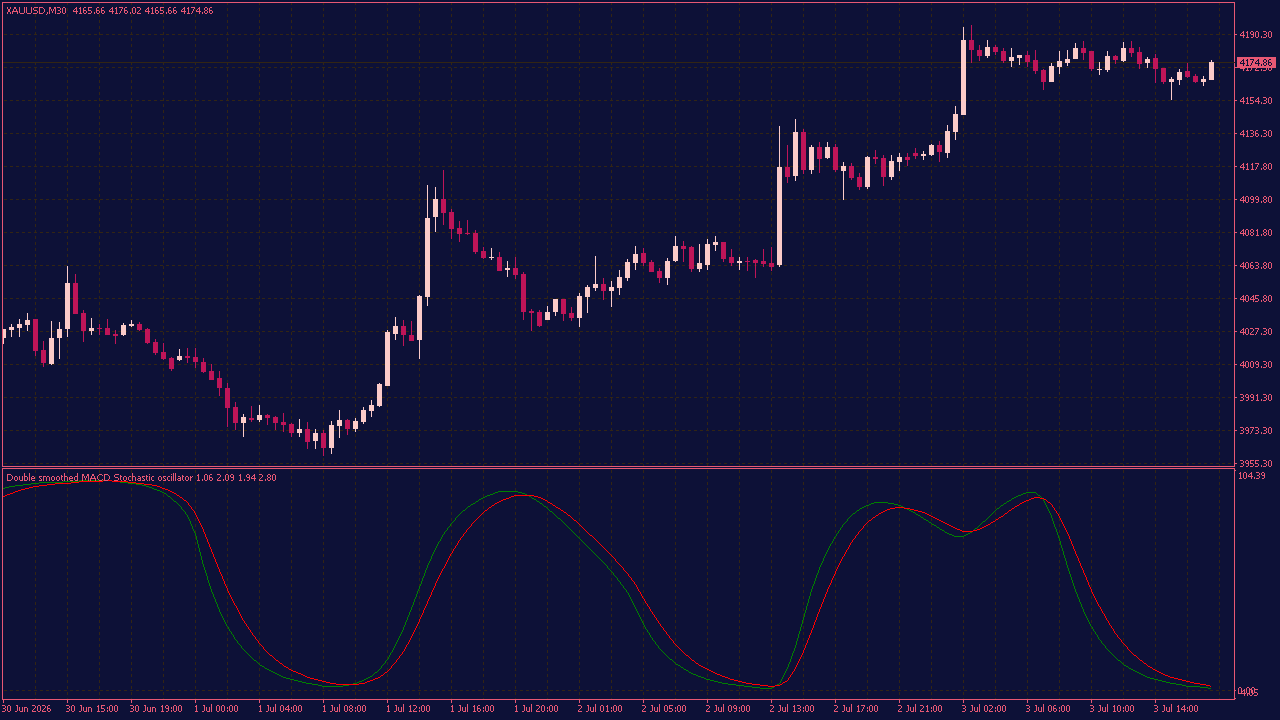
The Double Smoothed MACD Stochastic is a momentum oscillator built for traders who want a cleaner view of market direction. It combines MACD-based momentum with stochastic-style normalization, then applies additional smoothing to make the signal less sensitive to small price fluctuations. Instead of reacting to every minor market move, the indicator focuses on smoother momentum changes. The main line and signal line can help traders spot potential shifts in trend strength, possible continuation setups, and areas where the market may be overbought or oversold. This makes the indicator useful as a confirmation tool rather than a standalone trading system. It can support trend-following and reversal strategies, especially when combined with price action, support and resistance levels, and proper risk management.
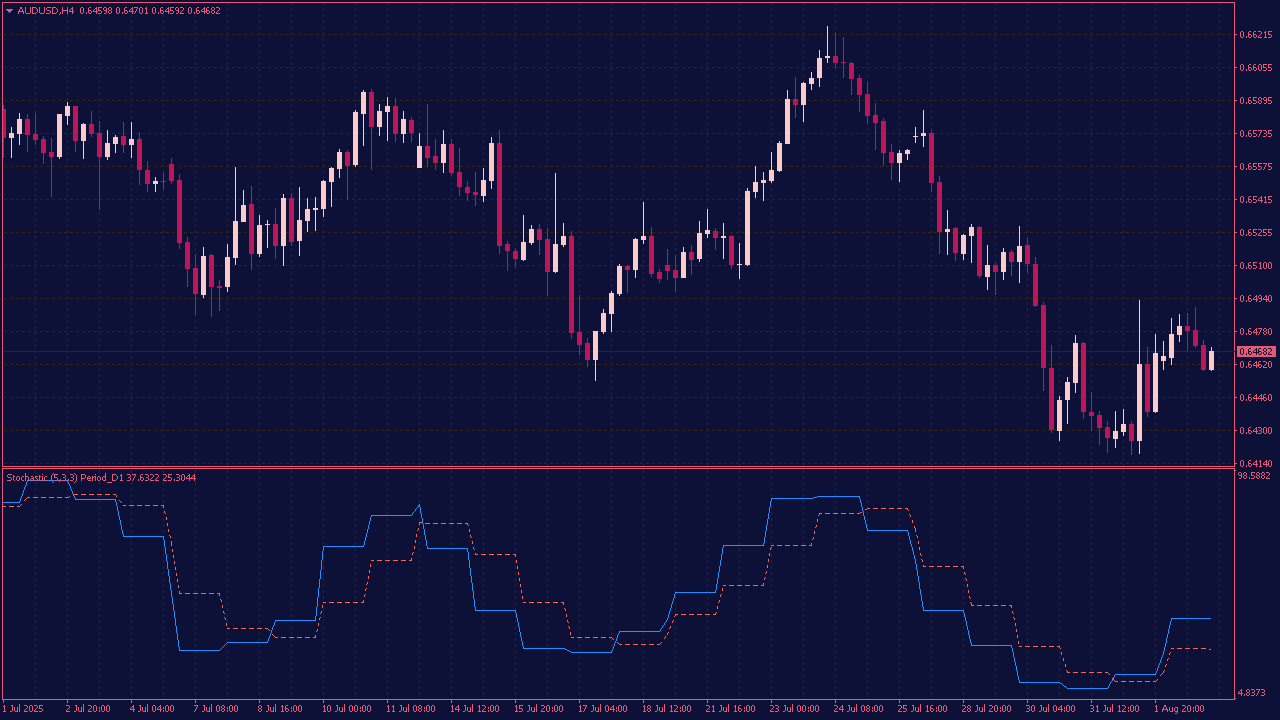
The Stochastic OB/OS Lines MTF Indicator helps traders monitor momentum and spot possible overbought or oversold market conditions. It shows the Stochastic main and signal lines in a separate window, with adjustable levels and multi-timeframe support. The indicator can also highlight when the Stochastic leaves an overbought or oversold zone, which may point to a possible momentum shift. Built-in alerts can notify traders by pop-up, sound, email, or push message, so they do not have to watch the chart constantly. This indicator is useful for traders who want a simple way to filter entries, confirm market direction, and identify potential reversal areas.
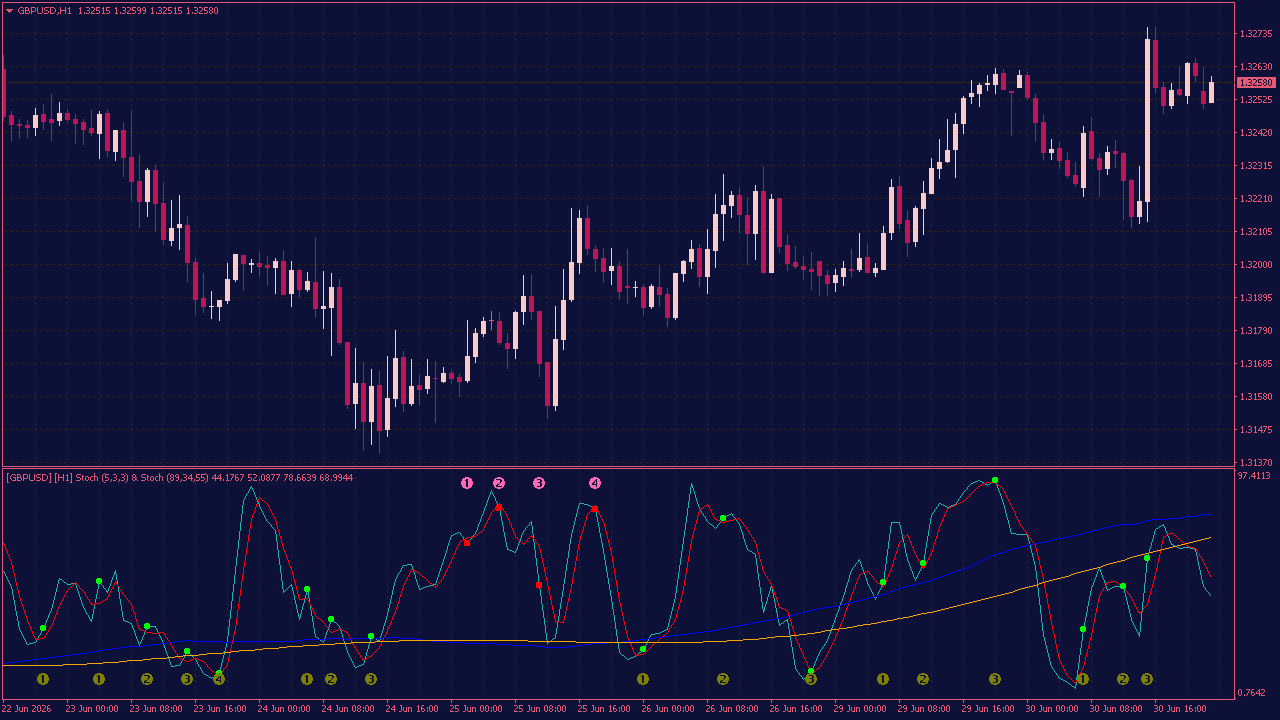
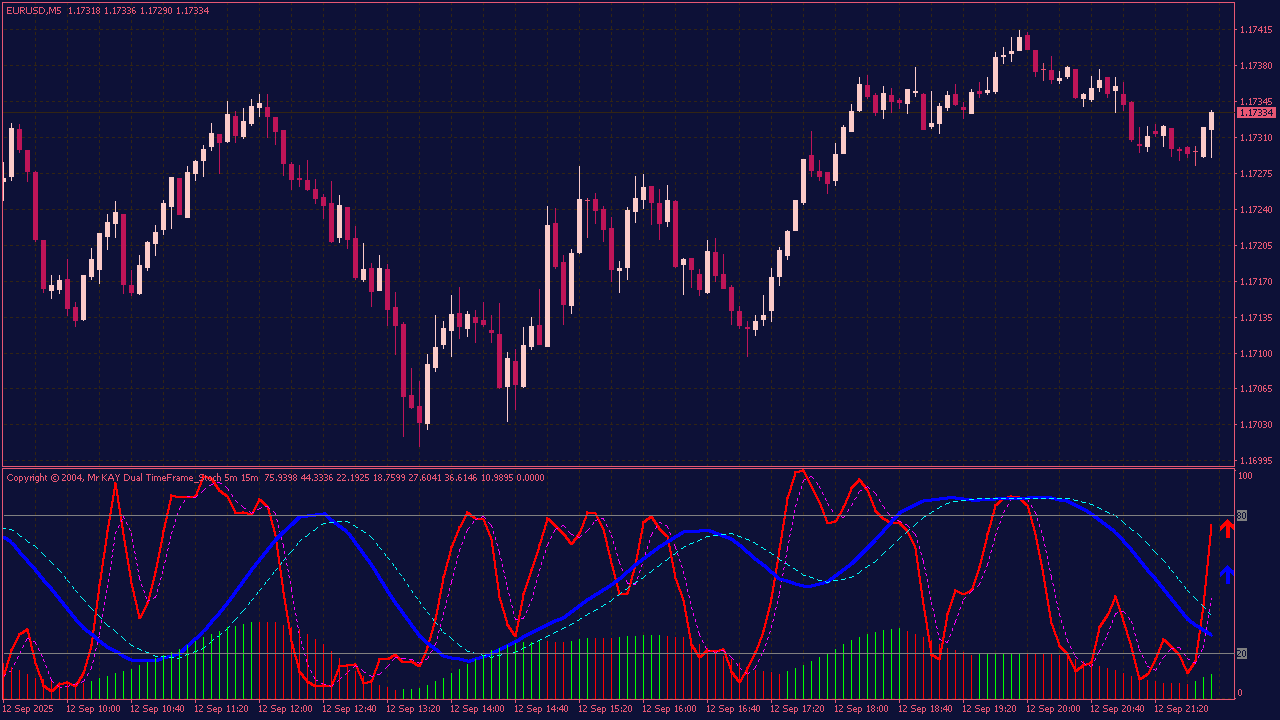
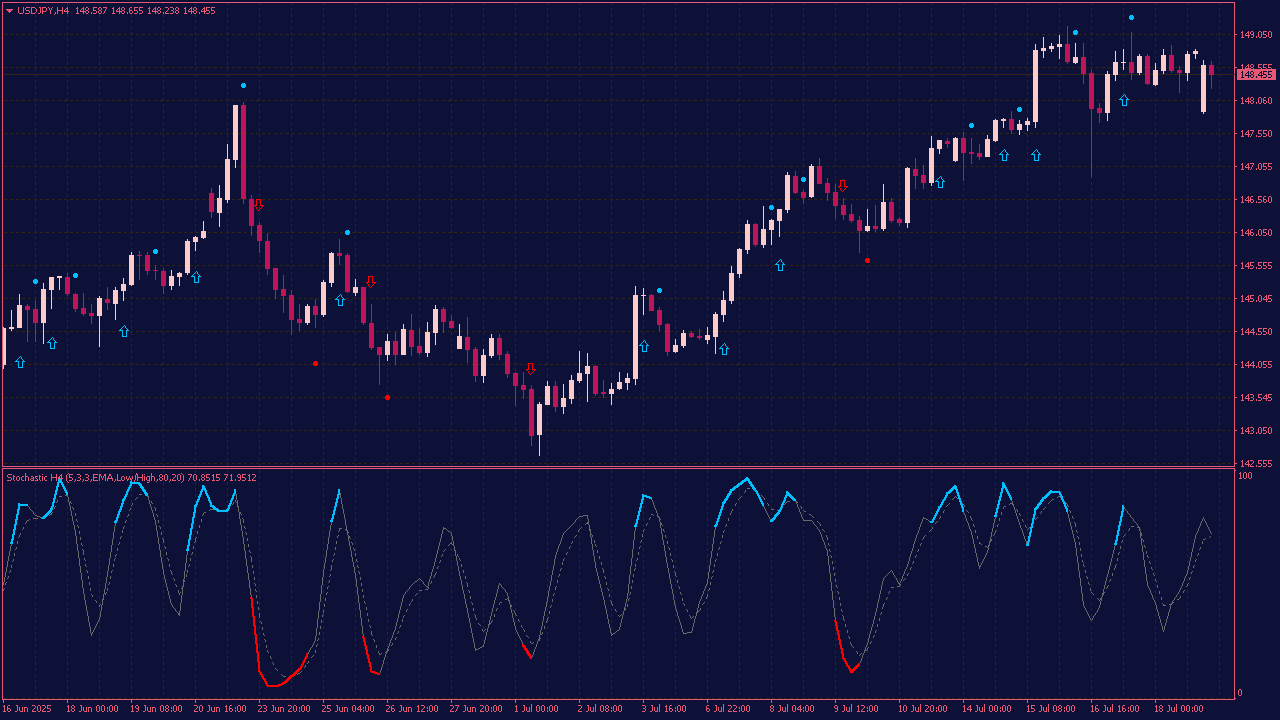
The Stochastic Indicator with Signals and Trends helps traders spot potential entries in line with the current short-term trend. It uses Stoch (5,3,3) to identify possible entry points, while Stoch (89,34,55) works as a trend filter. When the main line of Stoch (89,34,55) is above the signal line, the market is treated as being in an uptrend, so the indicator only shows buy signals. When the main line is below the signal line, the market is treated as being in a downtrend, and only sell signals are displayed. Buy signals appear when Stoch (5,3,3) crosses upward while the trend filter supports an uptrend. Sell signals appear when Stoch (5,3,3) crosses downward while the trend filter supports a downtrend. By filtering signals this way, Stoch Signals and Trends helps reduce counter-trend setups and keeps the focus on trades that follow the direction of the Stoch (89,34,55) trend.
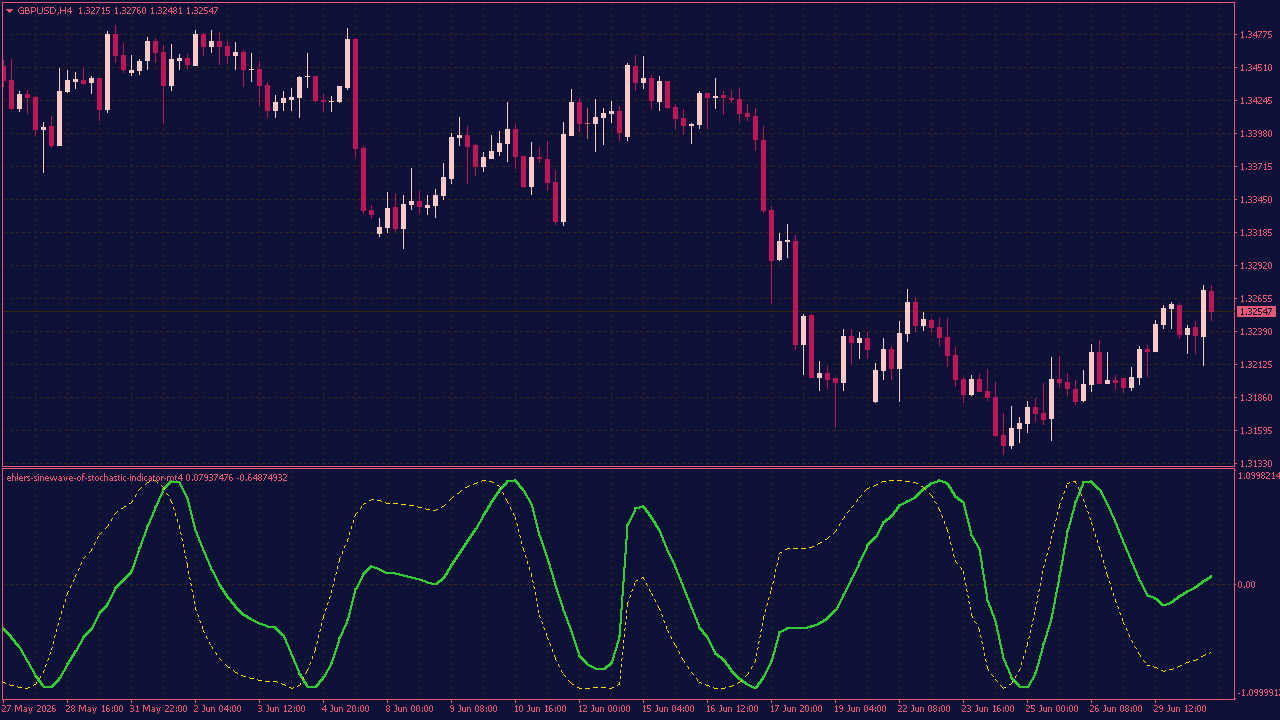
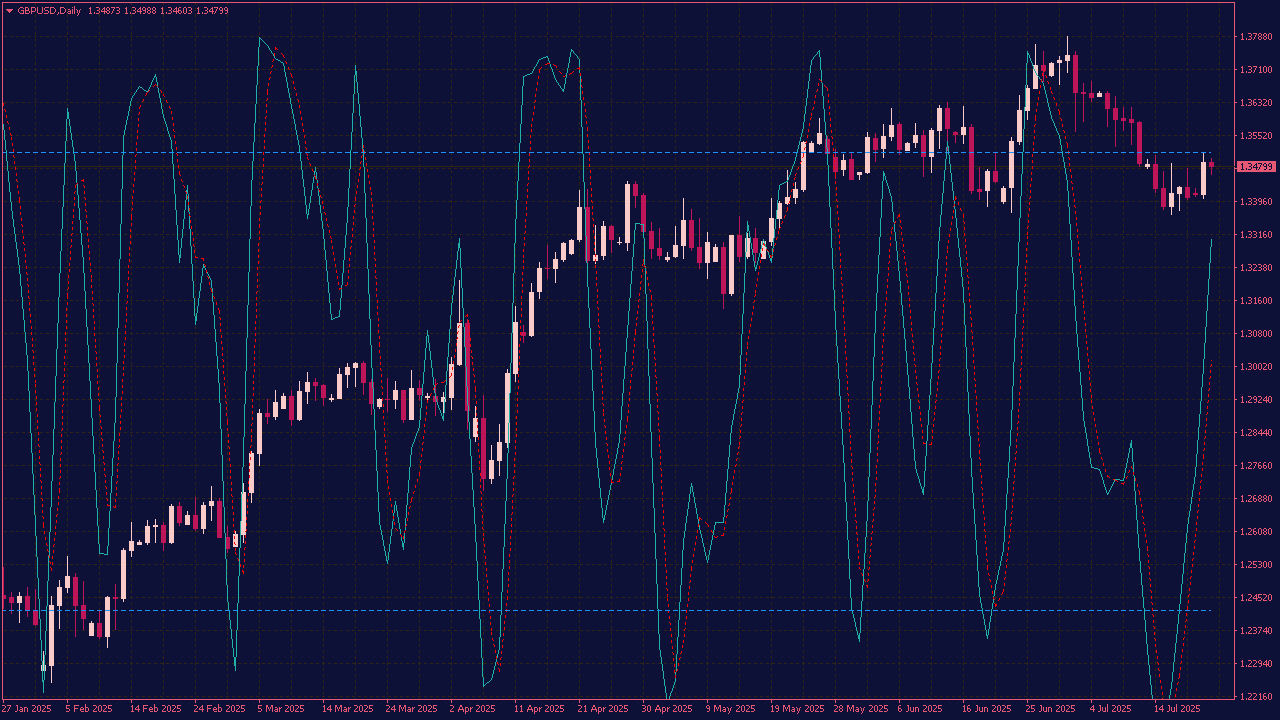
The Ehlers Sinewave of Stochastic Indicator is designed to give traders a clearer view of market cycles and possible turning points. Instead of focusing only on standard overbought and oversold levels, it uses the Stochastic Oscillator together with the Ehlers Sinewave approach to highlight changes in market rhythm. The indicator shows a Sine line and a Lead line in a separate window.
Their movement can help traders see when momentum is starting to shift or when the market may be entering a new cycle phase. Crossovers between the two lines can be used as additional confirmation when looking for potential reversals or changes in direction. This indicator can be useful for traders who prefer cycle-based analysis and want a smoother visual tool for reading short-term market behavior. It can be applied to different instruments and timeframes, but it works best when combined with other forms of analysis such as trend direction, support and resistance, or price action.
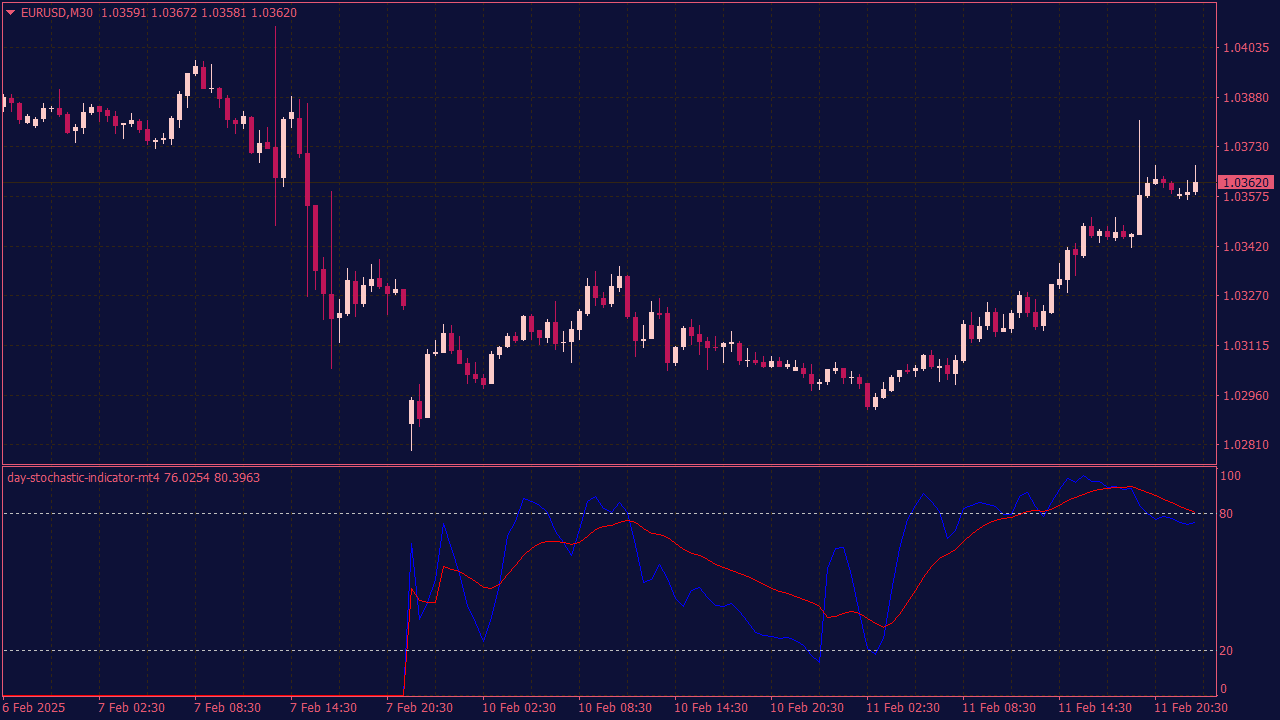
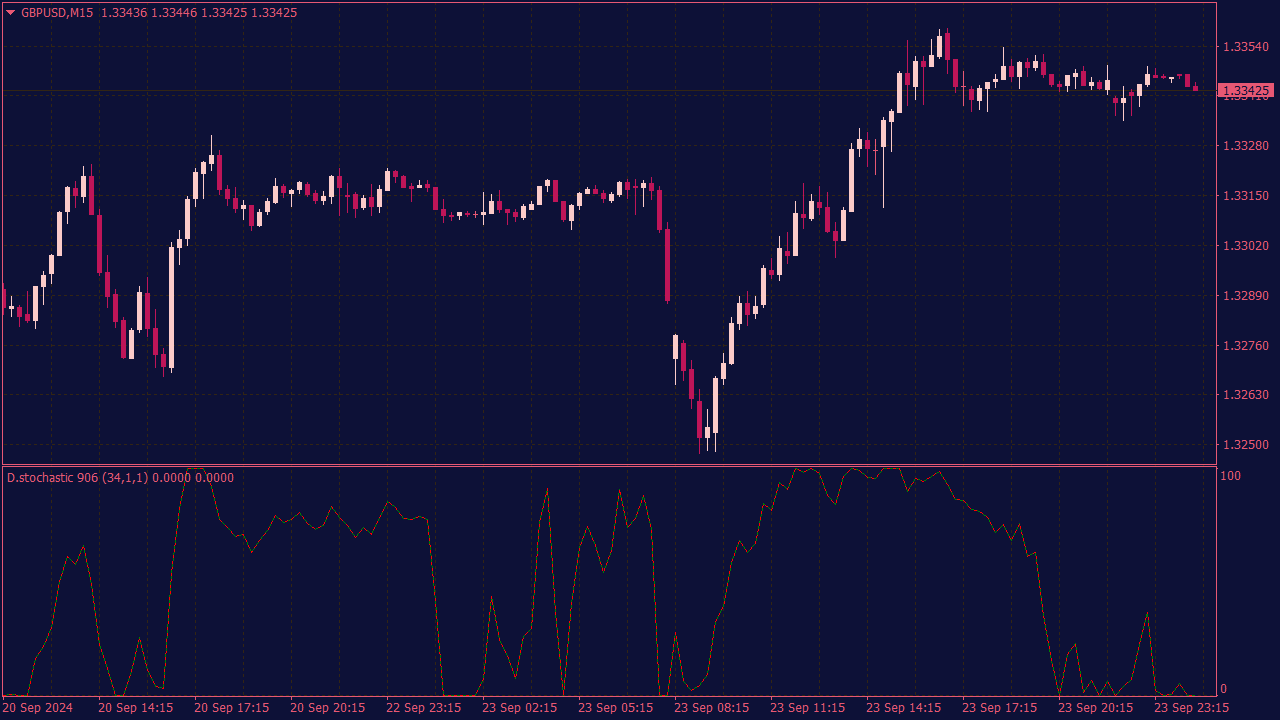
The Day Stochastic Indicator is a momentum oscillator that compares an asset’s closing price to its price range over a specific period (often one day). It helps identify overbought or oversold conditions by showing where the price sits relative to its daily high and low, signaling potential trend reversals or continuations. The indicator typically ranges from 0 to 100, with values above 80 indicating overbought and below 20 indicating oversold conditions.
The MTF Stochastic Divergence Indicator with Alerts is a technical analysis tool that detects momentum divergences between price and the stochastic oscillator across multiple timeframes. By comparing stochastic readings from different timeframes, it identifies potential trend reversals or continuation signals. The built-in alert system notifies traders in real-time when bullish or bearish divergences occur, helping to improve entry and exit timing in the market.
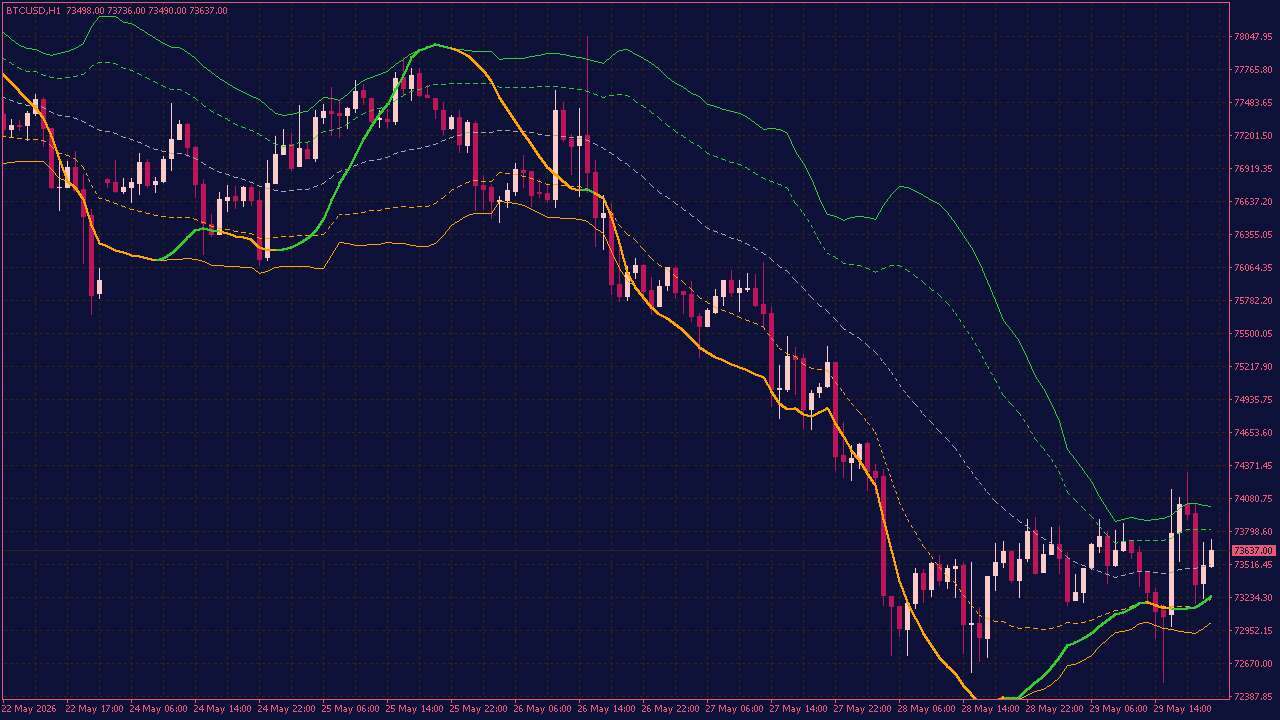
The MTF Stochastic of T3 on Bollinger Bands is a comprehensive technical indicator that combines multiple timeframes (MTF), the T3 moving average, the Stochastic oscillator, and Bollinger Bands to identify potential trading signals. By analyzing the Stochastic oscillator across different timeframes, traders can better assess momentum and overbought or oversold conditions. The T3 moving average provides a smooth trend direction with reduced lag, while Bollinger Bands indicate volatility and potential breakout points. When the Stochastic crosses certain thresholds near the upper or lower Bollinger Bands in multiple timeframes, it can signal potential reversals or entries aligned with the overall trend, improving the accuracy of trading decisions.
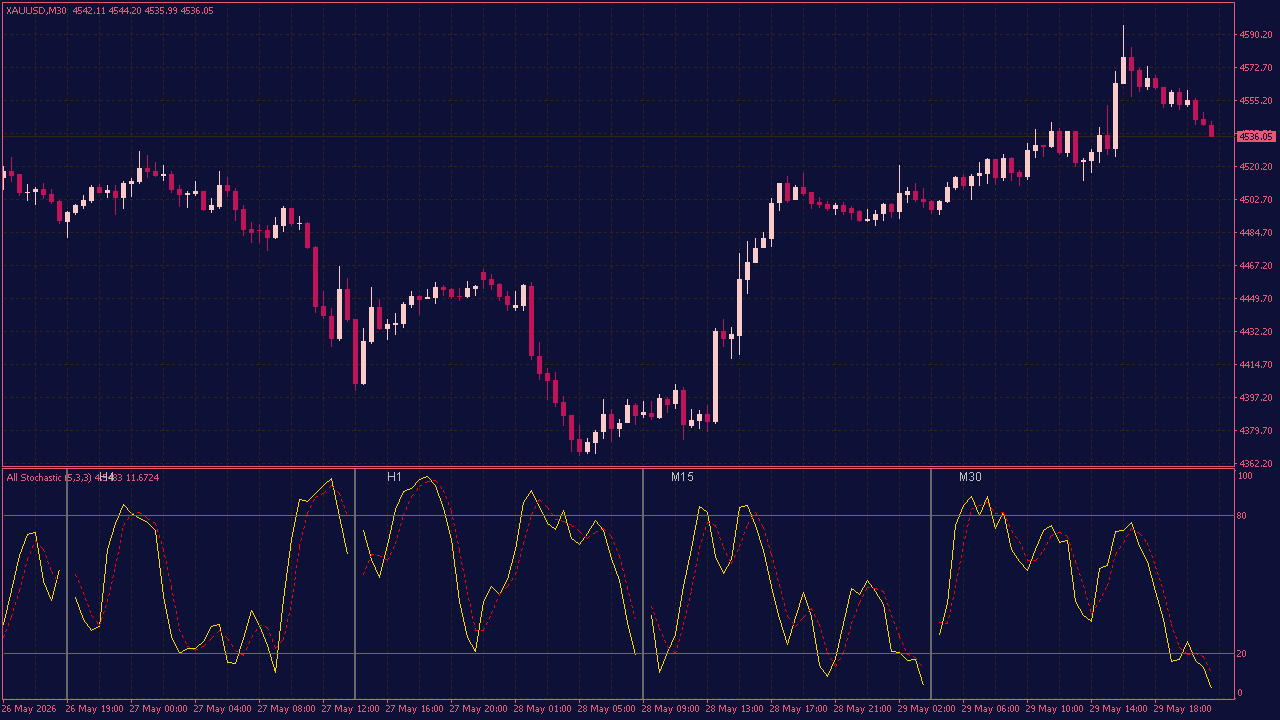
The All Stochastic Indicator provides a multi-timeframe view of market momentum by displaying stochastic values for different periods on a single chart, allowing traders to see how short-term and long-term trends align or diverge. This comprehensive perspective helps identify stronger trade signals when multiple time frames confirm each other, or potential reversals when they conflict. It enhances decision-making by offering deeper insights into trend strength and possible reversals, improving timing and risk management for traders seeking a more nuanced understanding of market movements.
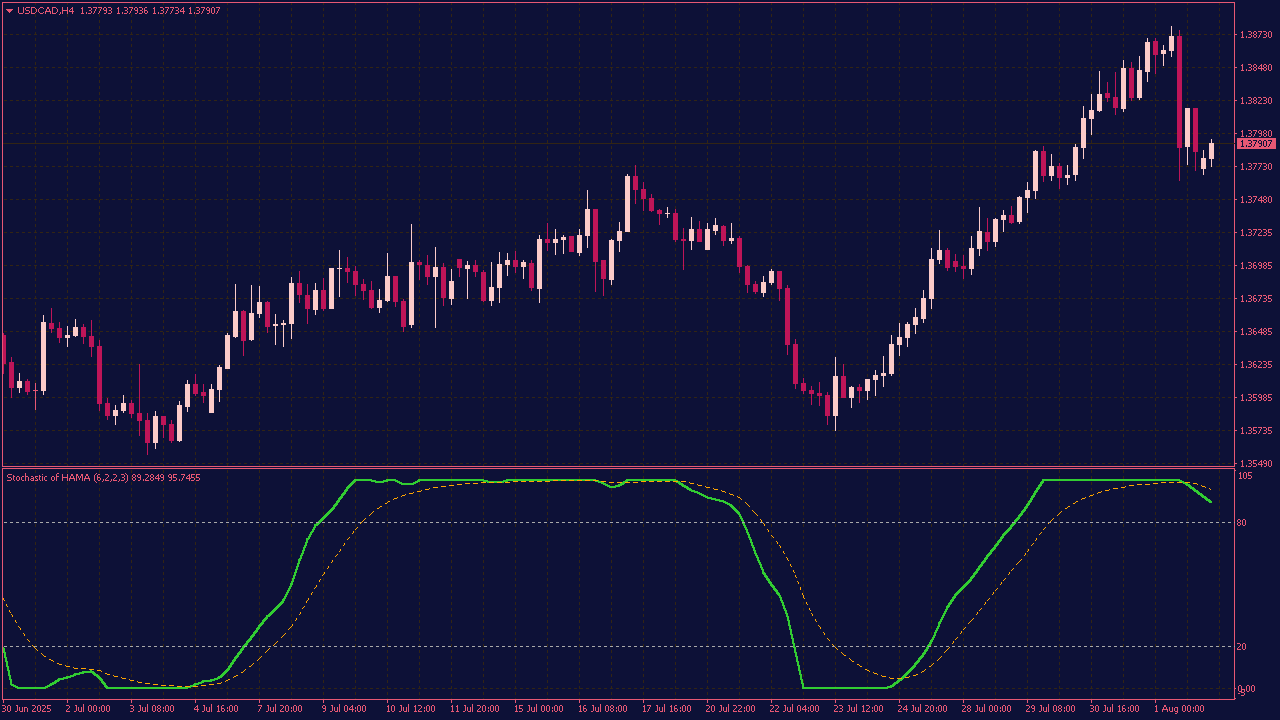
The Stochastic of HAMA Indicator combines the Stochastic Oscillator with the Hull Adaptive Moving Average (HAMA) to improve trend identification and momentum signals. It uses the Stochastic Oscillator to detect overbought and oversold conditions while the HAMA adapts to changing market conditions, smoothing price action and confirming trend strength. This combination helps generate more reliable buy or sell signals in both trending and sideways markets.
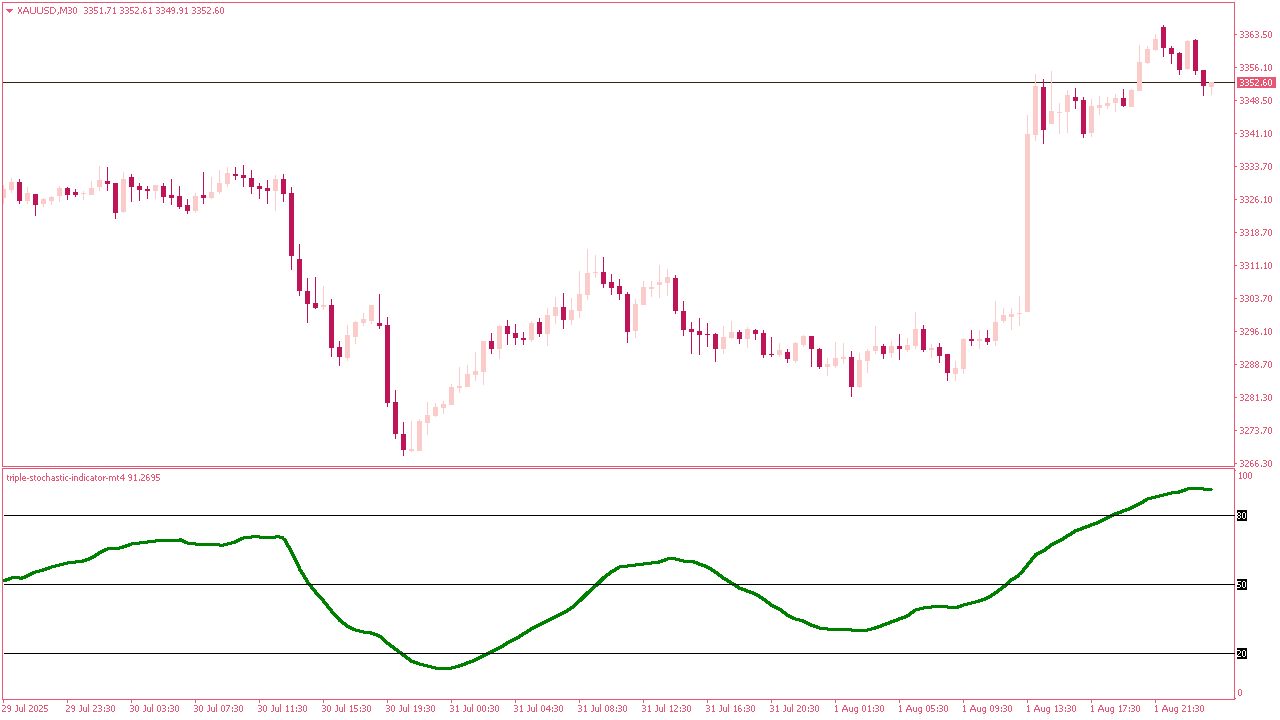
The Triple Stochastic Indicator is an advanced version of the Stochastic Oscillator that uses three different time periods (fast, medium, and slow) to generate more reliable overbought and oversold signals. By combining multiple timeframes, it smooths out short-term fluctuations and enhances trend confirmation, providing clearer buy or sell signals. It’s primarily used to identify strong market trends and potential price reversals.
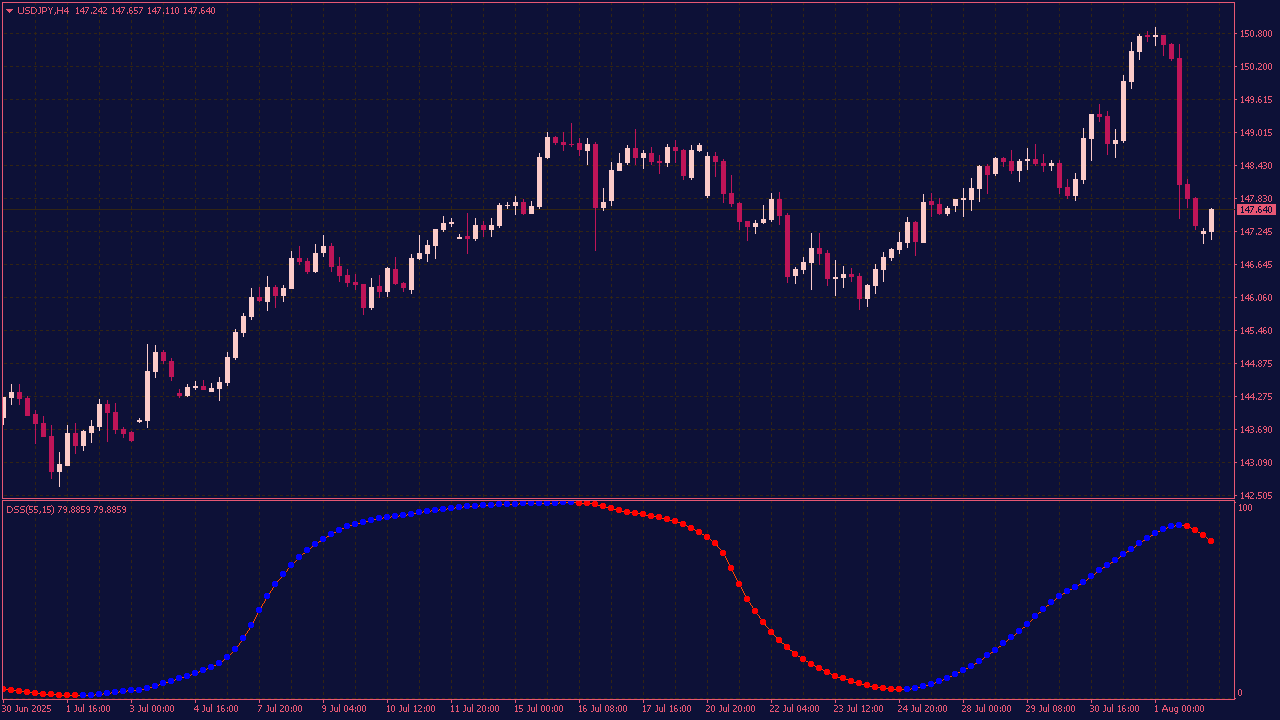
Bressert Double Smoothed Stochastic (DSS) with Dots
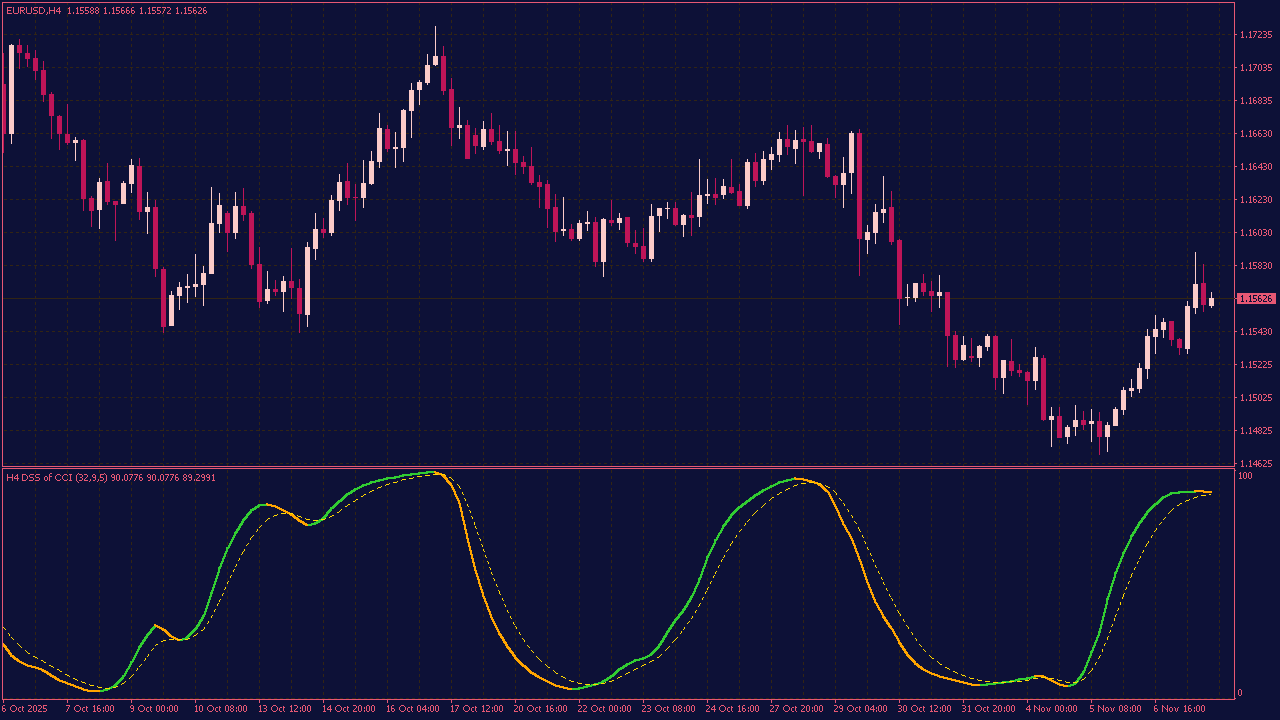
The Bressert Double Smoothed Stochastic (DSS) with Dots is a momentum-based technical indicator used to identify overbought or oversold conditions in the market. It improves upon the traditional Stochastic Oscillator by applying double smoothing to reduce noise, offering clearer buy or sell signals. The indicator consists of two smoothed lines (%K and %D), with visual "dots" marking entry and exit points when the lines cross key levels. It helps traders spot trend reversals or continuations in a more stable and visually intuitive way.
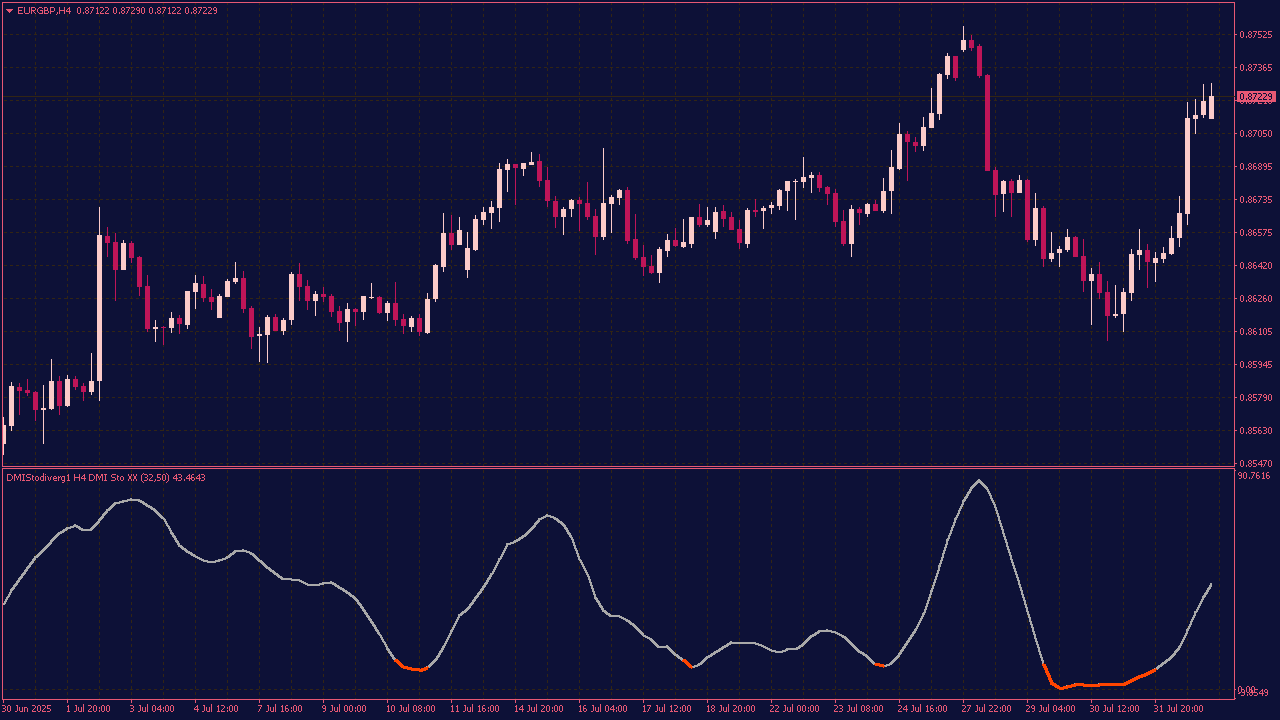
The DMI Stochastic Extreme Divergence Indicator combines the Directional Movement Index and the Stochastic Oscillator to identify periods of extreme divergence between price trends and momentum. It highlights potential reversal points when there is a discrepancy between the trend strength (DMI) and overbought/oversold conditions (Stochastic), signaling possible trend shifts or market corrections.
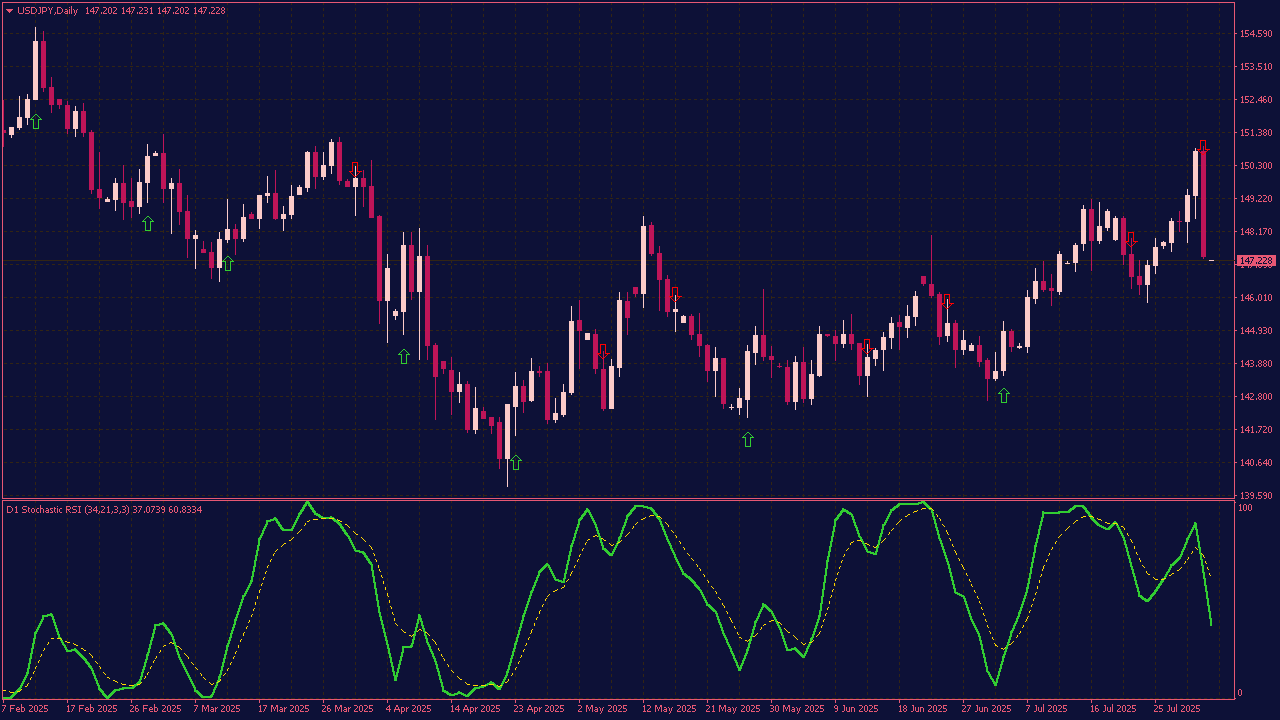
Stochastic of RSI MTF Indicator with Arrows and Alerts
The Stochastic RSI MTF Indicator with Arrows and Alerts is a powerful technical tool designed to identify overbought and oversold conditions across multiple timeframes, providing traders with visual cues (arrows) and automated alerts to signal potential entry or exit points. By combining the stochastic oscillator with RSI and implementing multi-timeframe analysis, it enhances the accuracy of trend reversal signals, helping traders to make more informed decisions. The addition of arrows offers immediate visual identification of signals on the chart, while alerts notify traders in real-time, facilitating timely actions in dynamic markets.
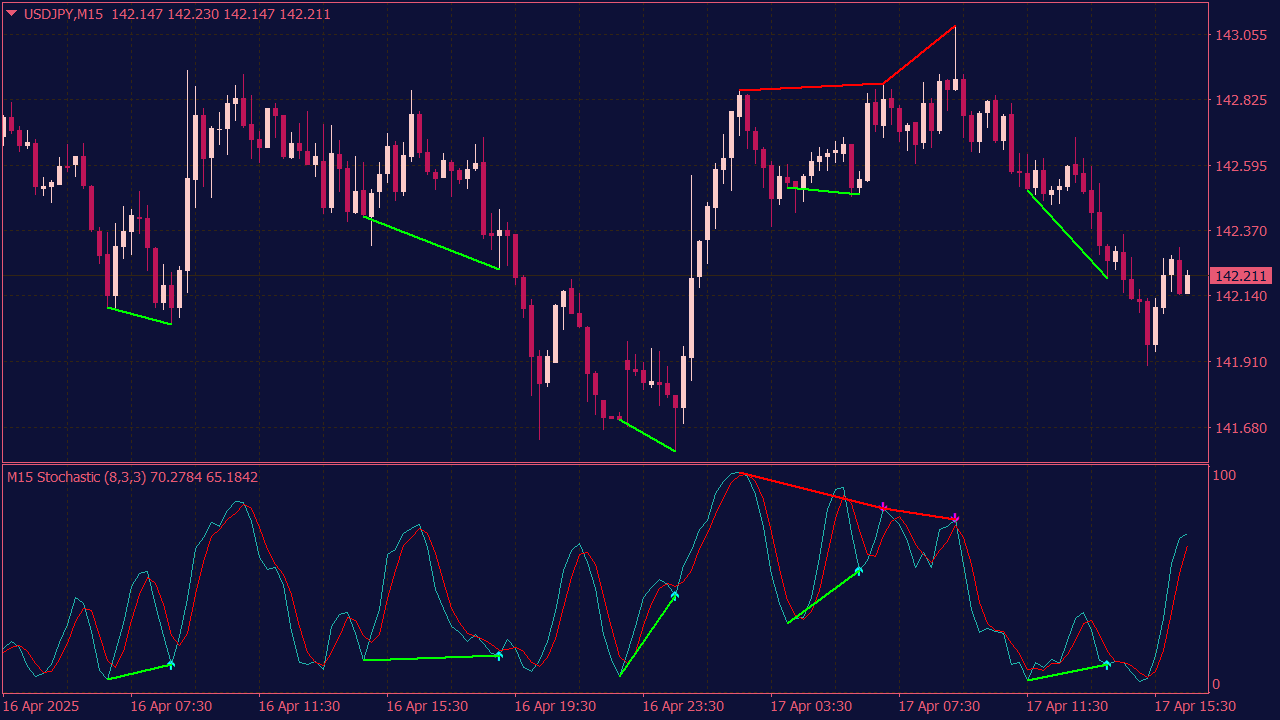
The Stochastic RSI Divergence Finder Indicator identifies potential price reversals by detecting divergences between the RSI and Stochastic indicators. Bullish divergence occurs when price makes lower lows while both RSI and Stochastic make higher lows, signaling a possible upward reversal. Bearish divergence happens when price makes higher highs while both RSI and Stochastic make lower highs, suggesting a potential downward reversal. This tool helps traders spot trend weakening and predict reversals.
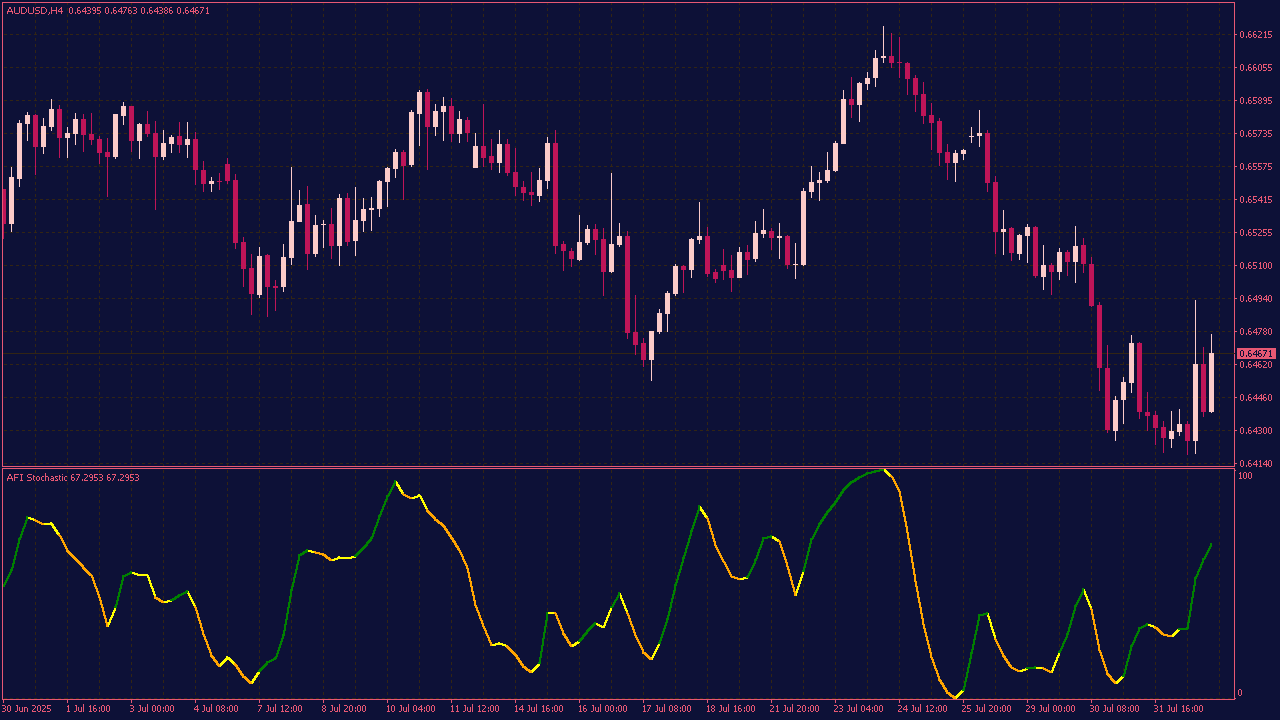
The AFI Stochastic Indicator is a custom momentum oscillator based on the traditional Stochastic Oscillator, designed to provide smoother and more reliable signals. It helps traders identify overbought and oversold market conditions with improved clarity by using color-coded momentum shifts and adaptive smoothing techniques. Ideal for short-term trading, it reduces market noise and enhances decision-making in volatile conditions.
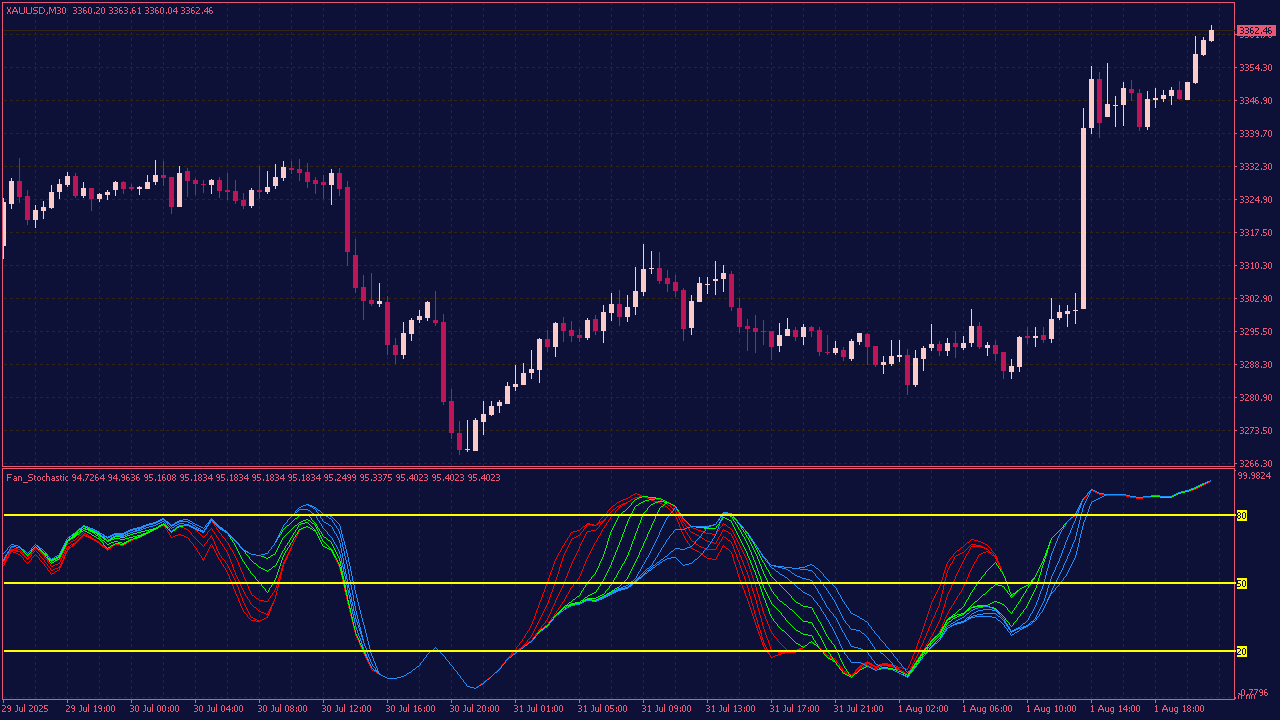
The Fan Stochastic Indicator is a custom technical analysis tool that plots multiple Stochastic Oscillators with different time periods on a single chart, creating a "fan-like" visual effect. This approach helps traders assess momentum across short-, medium-, and long-term timeframes simultaneously, improving trend confirmation and identifying overbought or oversold conditions with greater context.
The Non-Lag NRP MTF Stochastic with Alerts is an advanced trading indicator that combines the classic Stochastic Oscillator with enhanced features to provide more reliable and timely signals. It integrates multi-timeframe analysis, allowing you to view stochastic data from higher timeframes directly on your current chart. The Non-Lag feature minimizes delays in signal generation, making it more responsive to market changes, while the No Repaint (NRP) functionality ensures that once a signal is generated, it remains unchanged, providing accurate backtesting results.
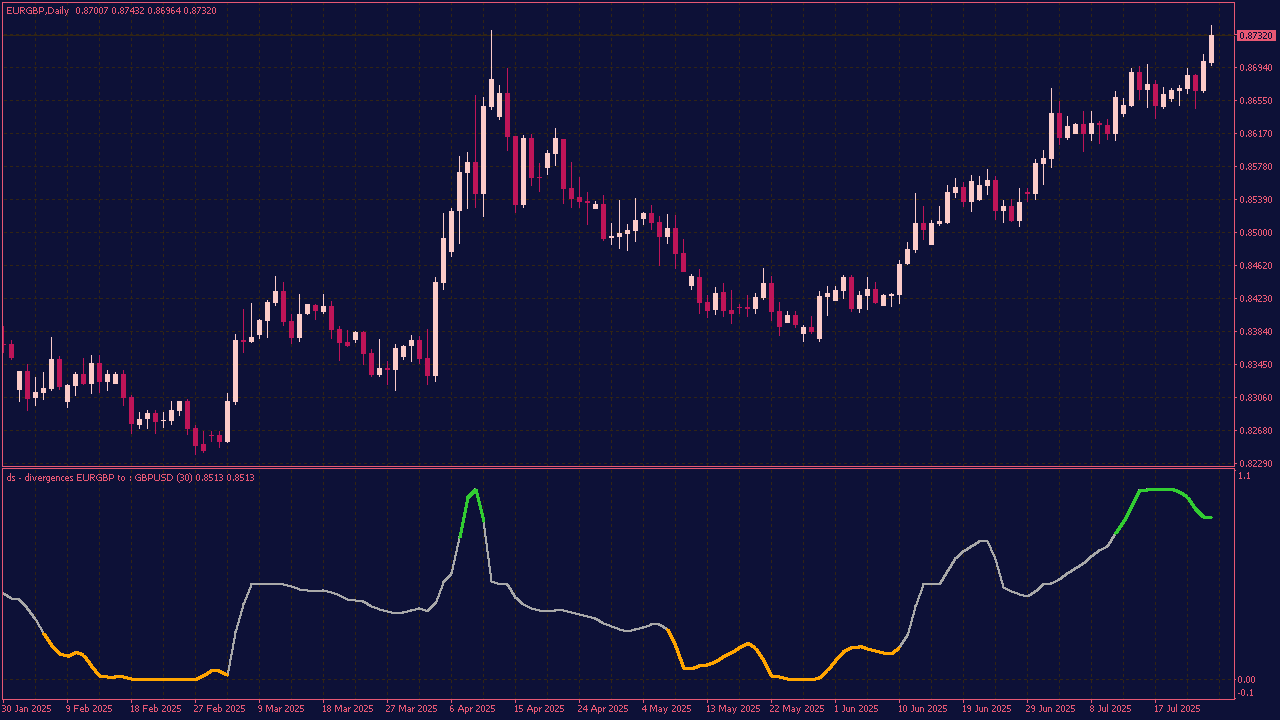
The Dual Stochastic Divergences Indicator is a technical analysis tool that compares the stochastic oscillator values of two different symbols to detect divergences between them. By analyzing how the momentum of each asset moves relative to the other, it identifies shifts in correlation and potential imbalances in market behavior. This helps traders spot early signs of trend reversals or continuation opportunities by highlighting when one symbol’s momentum diverges from the other’s, offering a unique perspective for intermarket or cross-asset trading strategies.
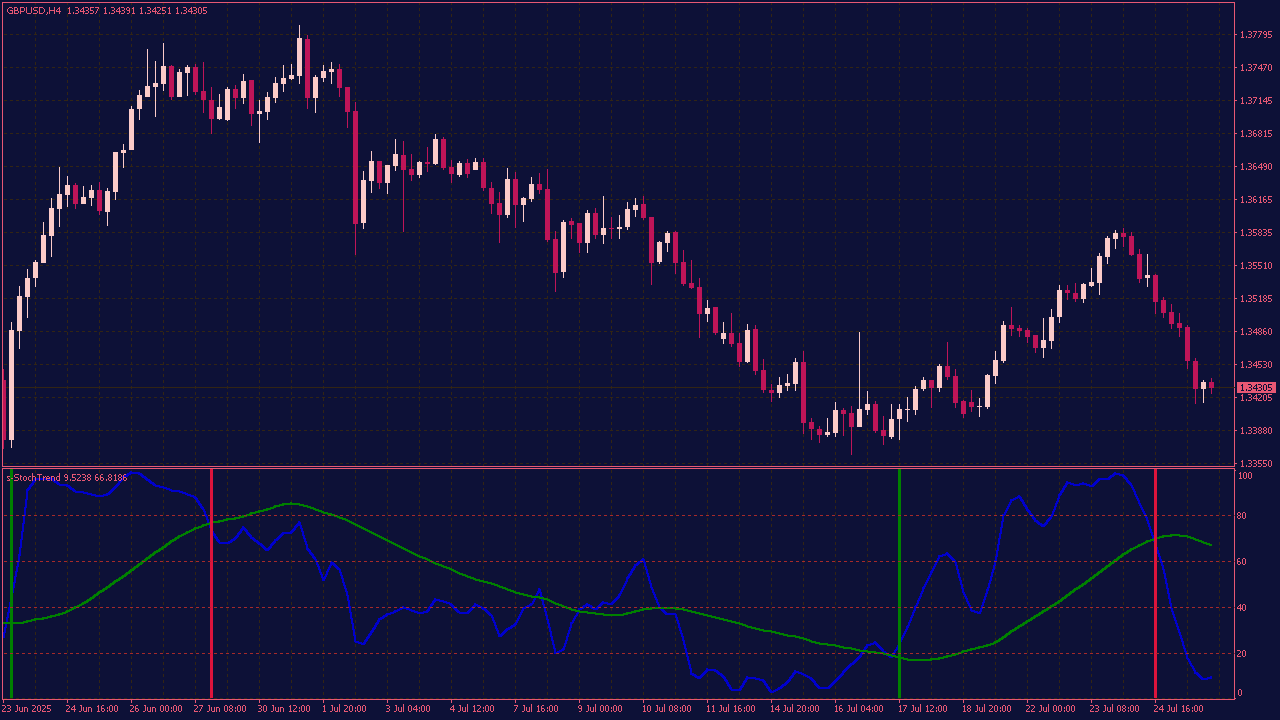
The Stoch-Trend Indicator is a trend-following tool that combines the Stochastic Oscillator with a trend filter to highlight momentum signals only in the direction of the prevailing market trend. It helps reduce false signals and improves trade accuracy by confirming stochastic entries with overall trend direction.
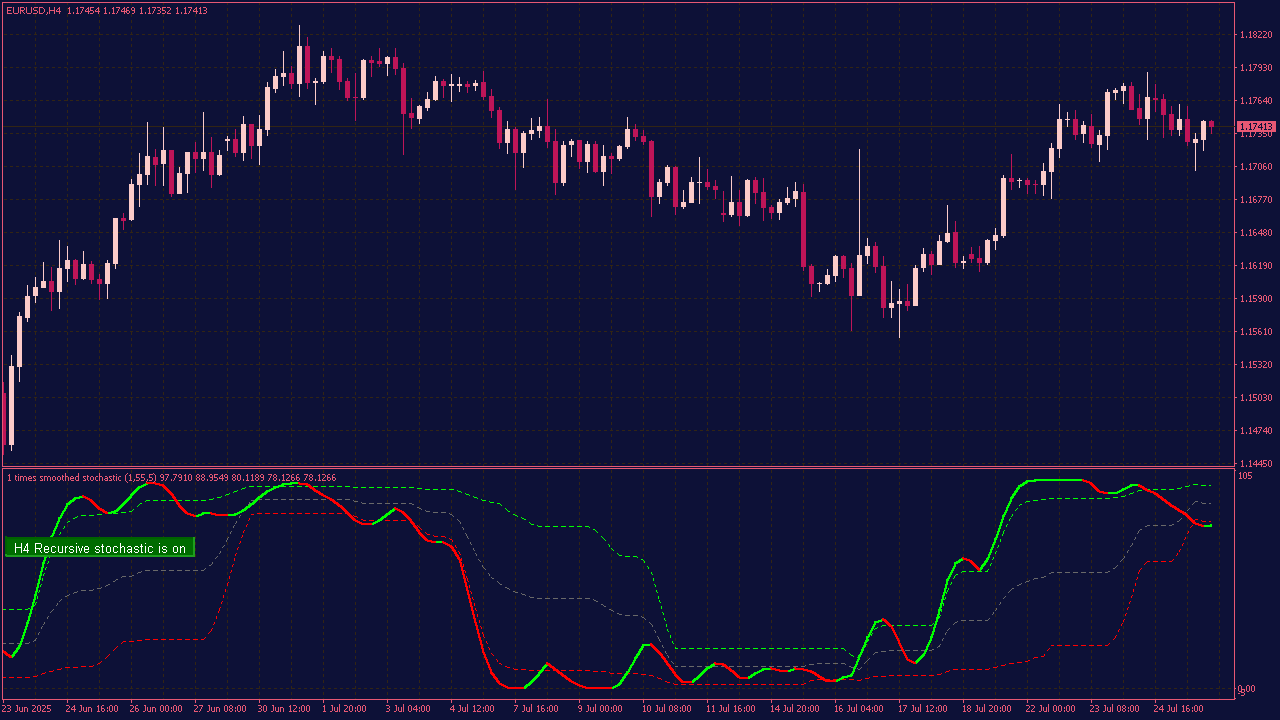
The Recursive Smoothed Stochastic MTF Indicator is an advanced momentum oscillator that combines the classic stochastic formula with multiple layers of smoothing to reduce market noise. It supports multi-timeframe analysis, allowing traders to view higher-timeframe momentum signals on lower-timeframe charts. This helps identify trend strength and reversals with greater clarity and fewer false signals.
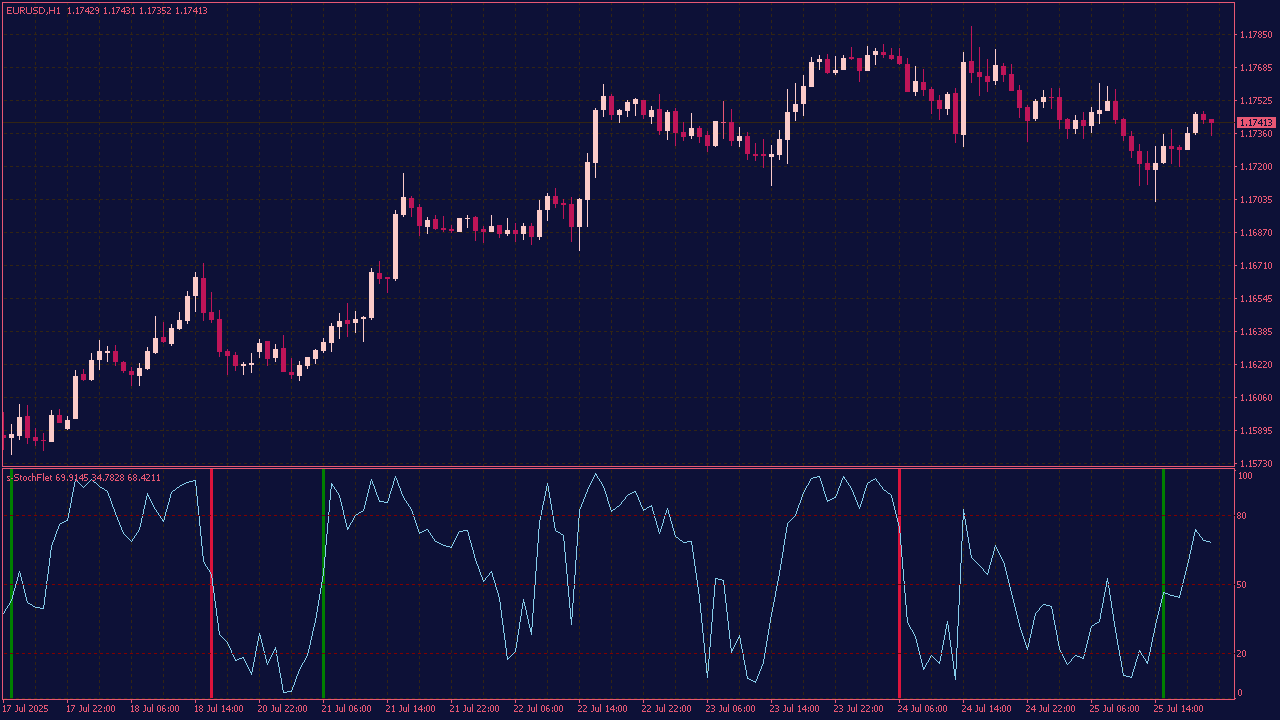
The Stoch-Flat Indicator is a custom technical tool designed to identify flat or ranging market conditions using the principles of the Stochastic Oscillator. It helps traders avoid false signals during sideways markets and focus on trend-trading only when conditions are favorable.
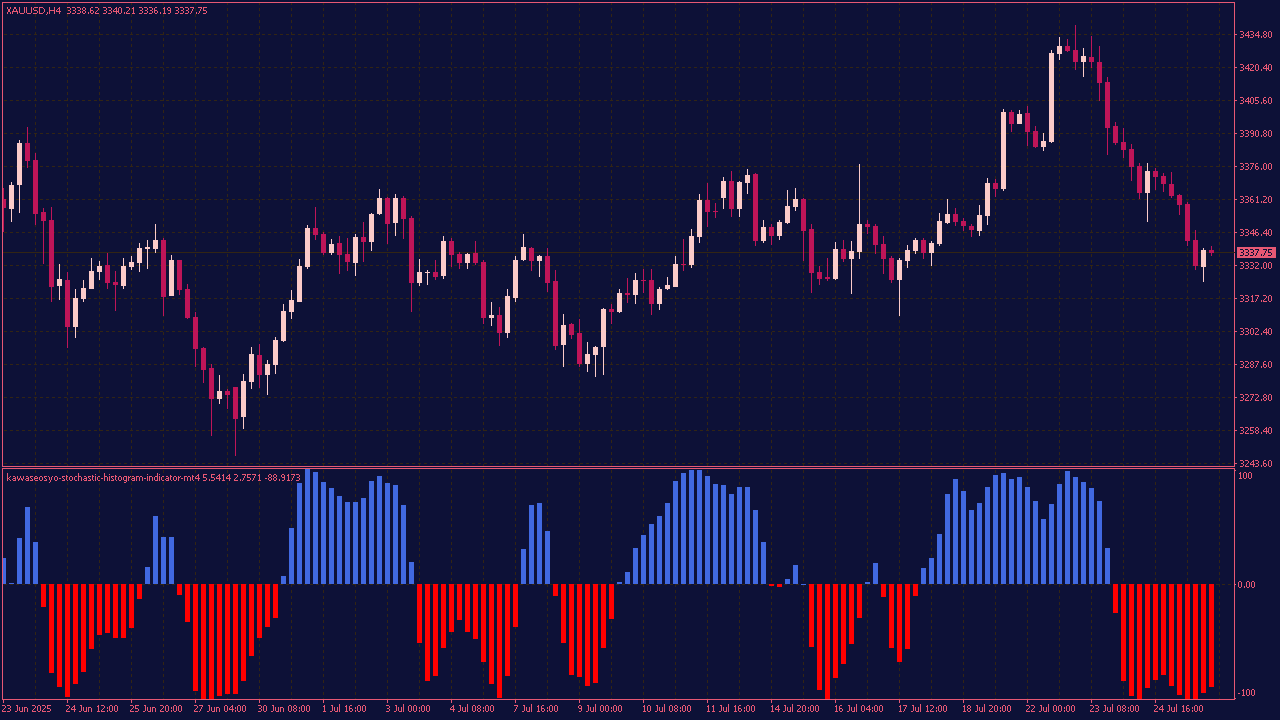
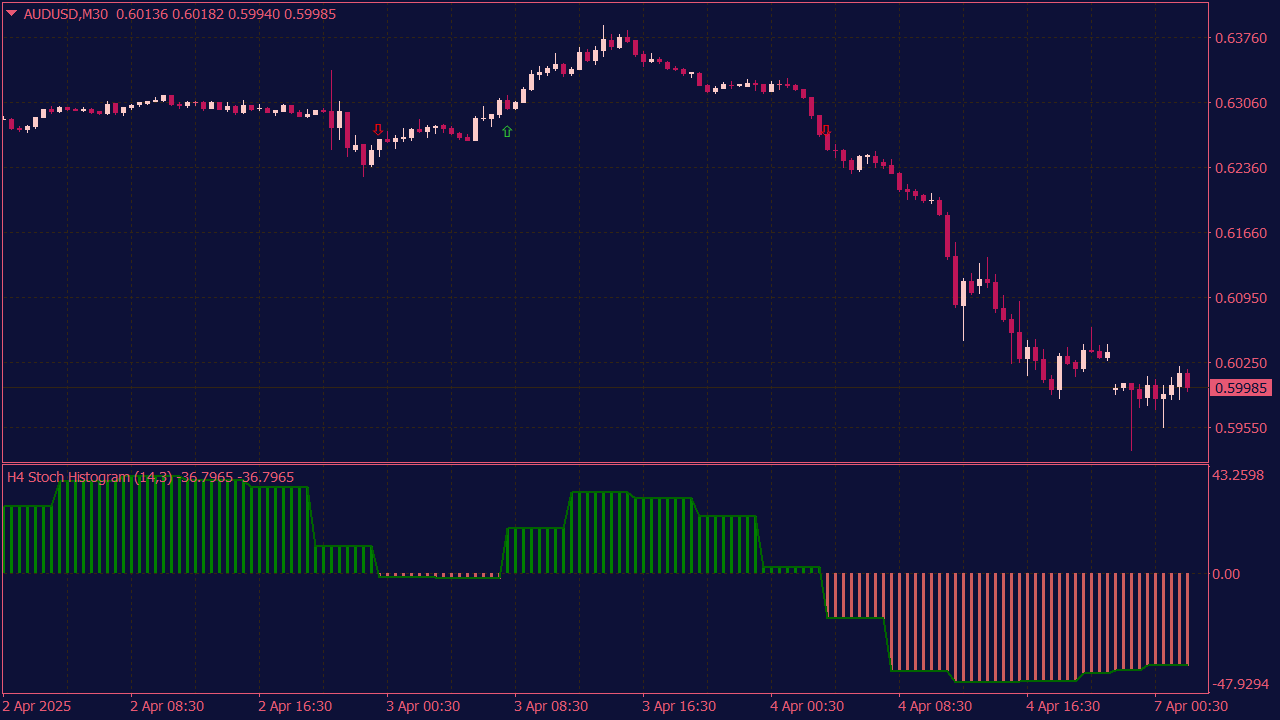
The KawaseOsyo Stochastic Histogram Indicator is a custom technical analysis tool that visualizes the momentum and overbought/oversold conditions of the market using a histogram-style representation of the Stochastic Oscillator.
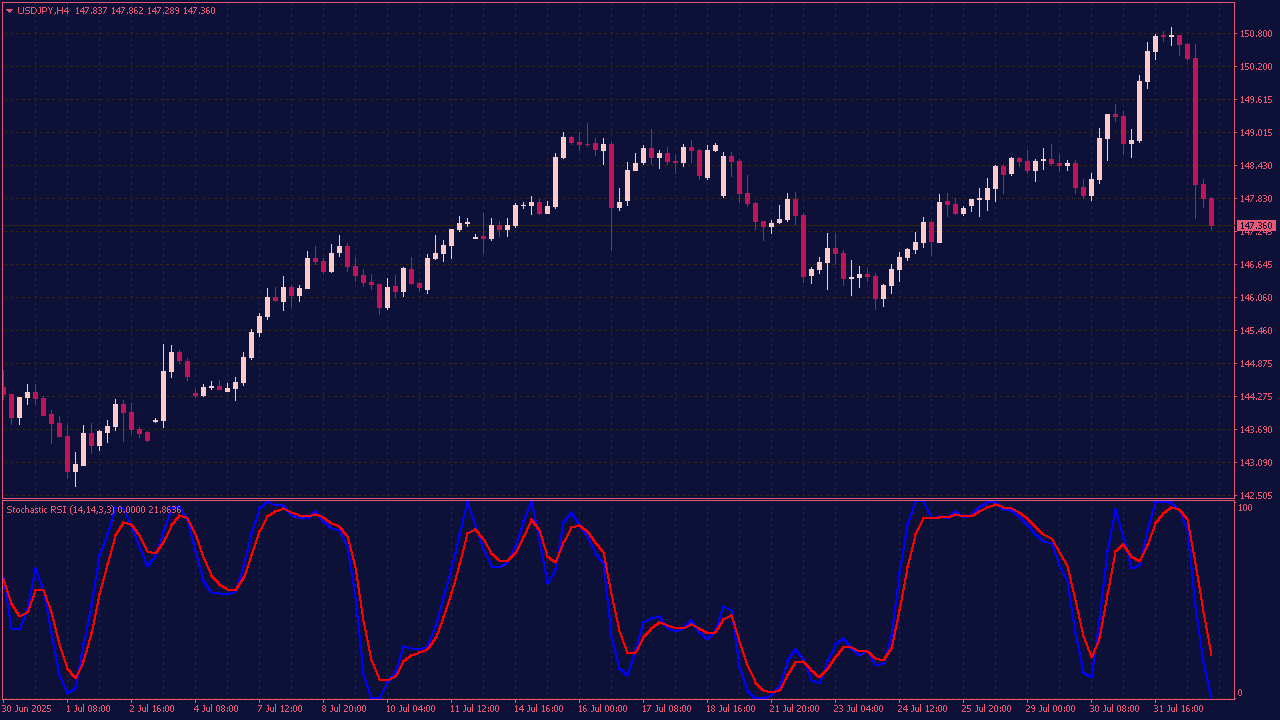
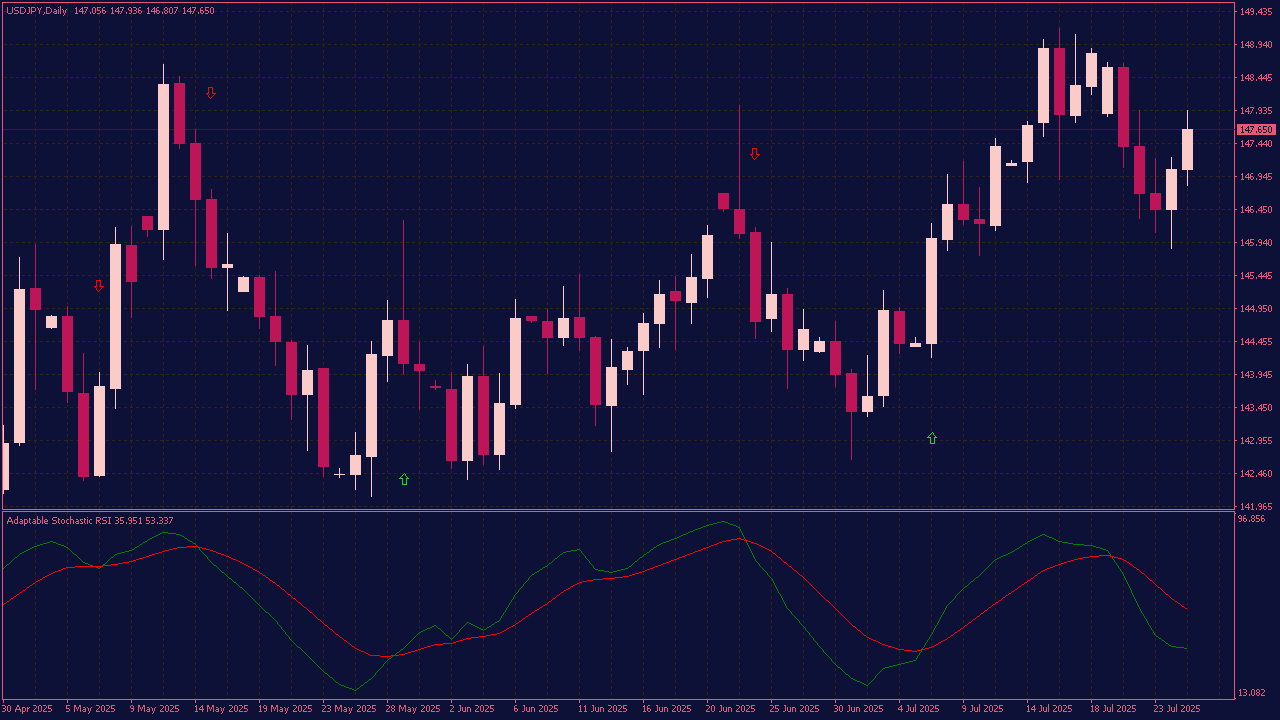
The Adaptable Stoch RSI with Arrows is a technical indicator that combines the Stochastic RSI with customizable input parameters and visual buy/sell arrows on the chart. It highlights potential overbought and oversold conditions with enhanced flexibility, allowing traders to adjust RSI and Stoch periods, smoothing, and threshold levels. Arrows appear when bullish or bearish reversal conditions are met, aiding in clearer, more actionable trading signals. Ideal for momentum and trend-reversal strategies.
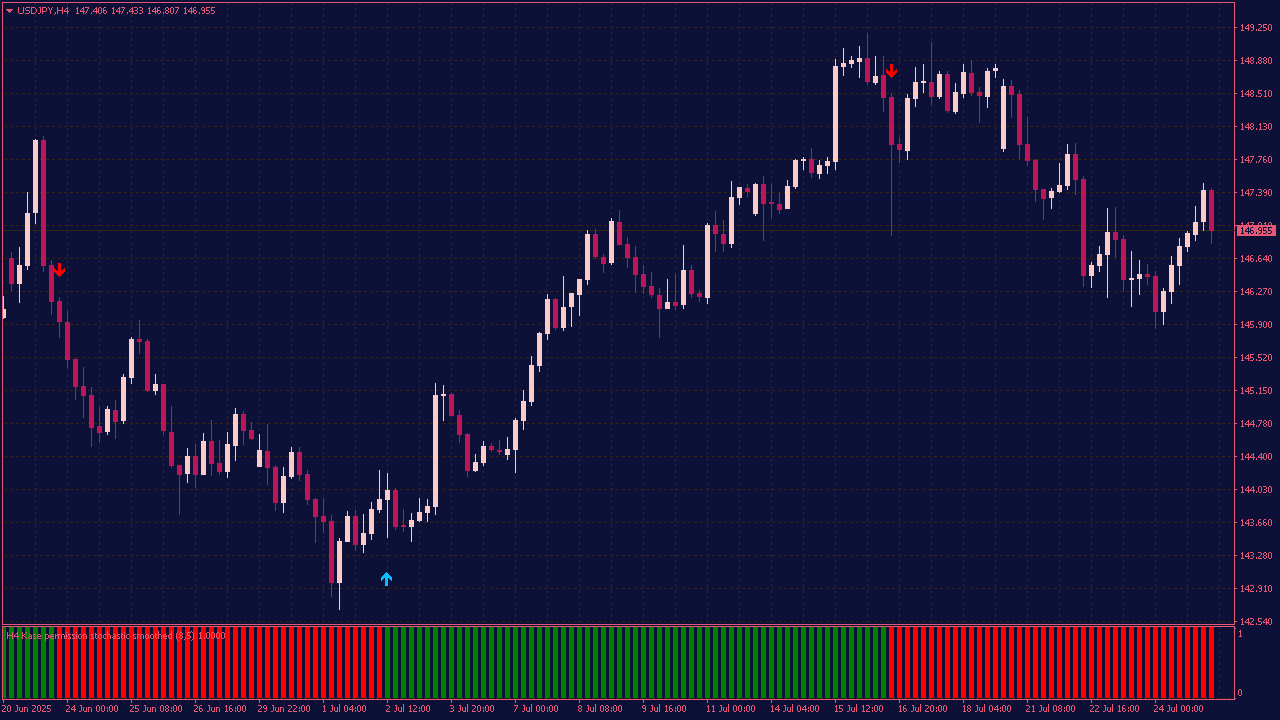
Kase Permission Stochastic Histogram with Arrows and Alerts
The Kase Permission Stochastic Histogram with Arrows and Alerts is a momentum-based indicator that combines the stochastic oscillator with Kase permission logic to filter signals. It displays a histogram showing bullish or bearish momentum, plots arrows for potential buy/sell entries, and includes alerts when trade conditions are met. Designed to reduce false signals and confirm trend-aligned opportunities.
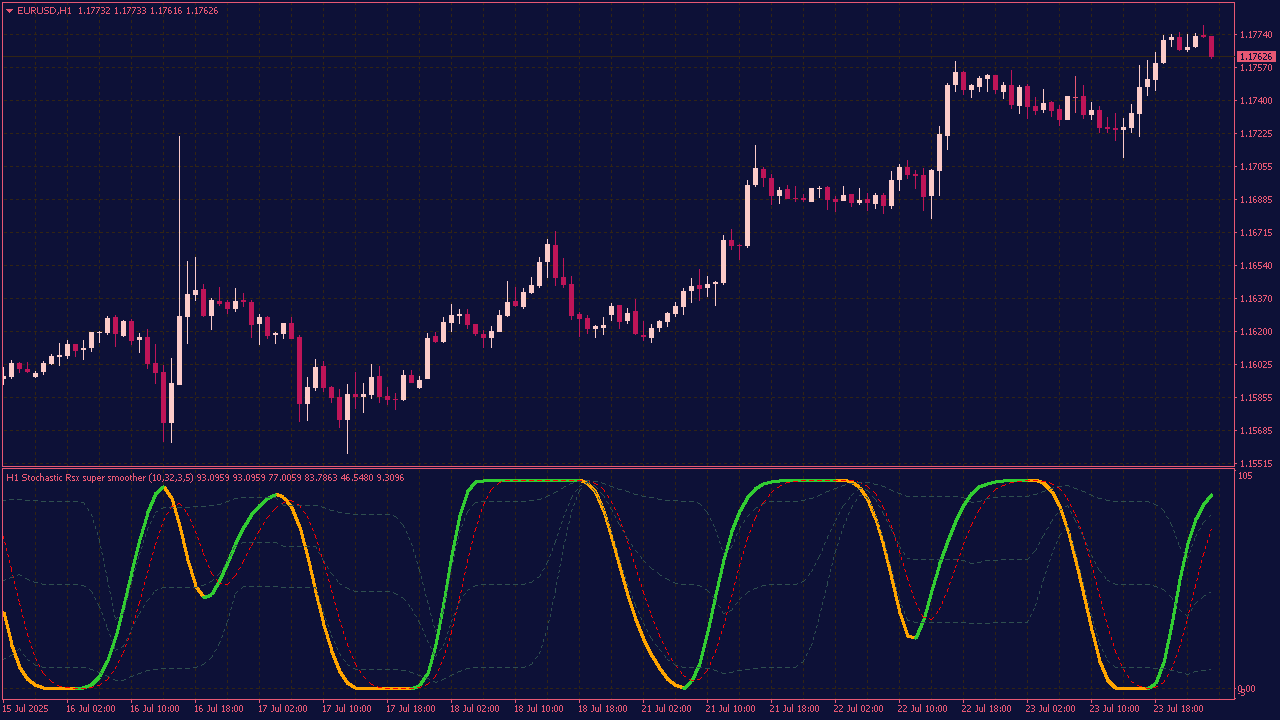
Stochastic RSI Super Smoother with Floating Levels
The Stochastic RSI Super Smoother with Floating Levels is a technical indicator that enhances the traditional Stochastic RSI by applying a smoothing filter and adjustable overbought/oversold levels. This allows for cleaner, more reliable signals by reducing noise and adapting dynamically to changing market conditions. The floating levels adjust based on market behavior, offering more flexibility in detecting overbought or oversold conditions. It's designed to provide more accurate entry and exit points for traders.
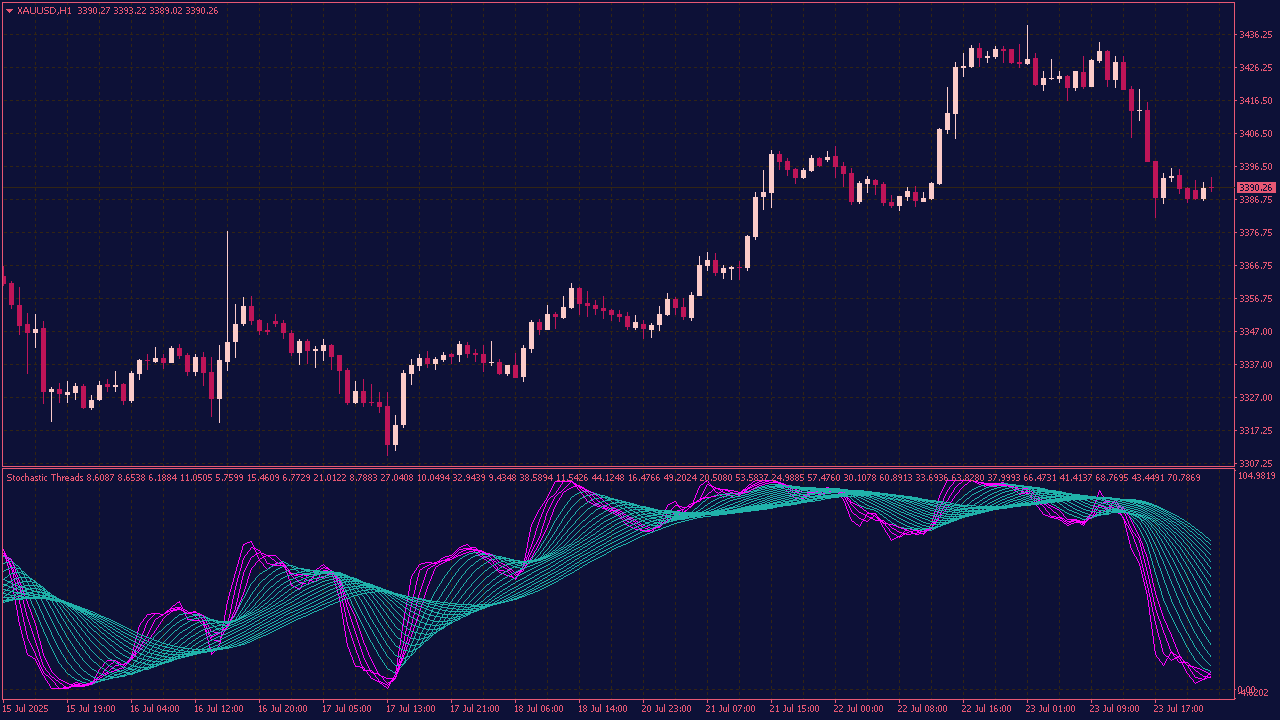
The Stochastic Threads Indicator is a variation of the traditional Stochastic Oscillator that uses a unique "threading" technique to smooth price action. It combines the typical %K and %D lines with additional filtering, offering clearer signals for identifying overbought or oversold conditions, trend reversals, and potential entry or exit points. The indicator aims to reduce market noise and improve the accuracy of timing in trades.
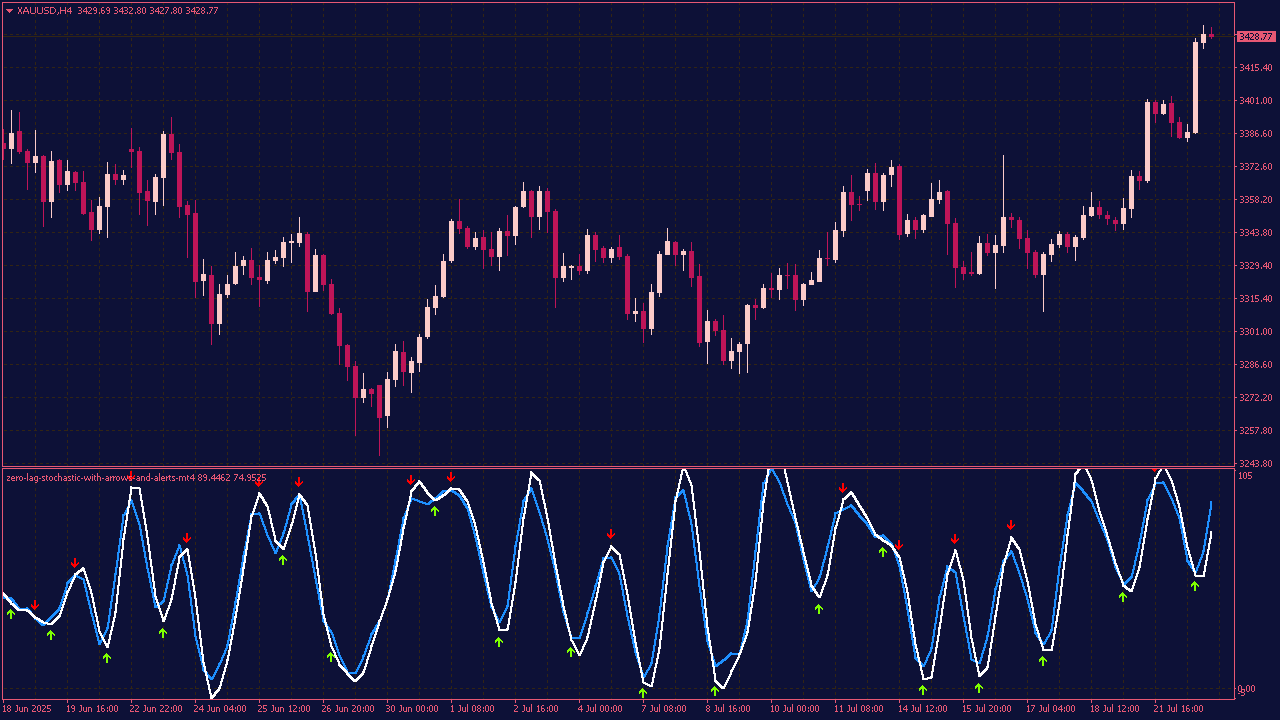
The Zero Lag Stochastic with Arrows and Alerts is an advanced version of the standard stochastic oscillator. It uses a zero-lag smoothing technique to provide faster and more accurate overbought/oversold signals. The indicator plots arrows on the chart when bullish or bearish crossover signals occur and can trigger alerts to notify traders in real-time. It's useful for identifying early trend reversals and improving entry/exit timing.
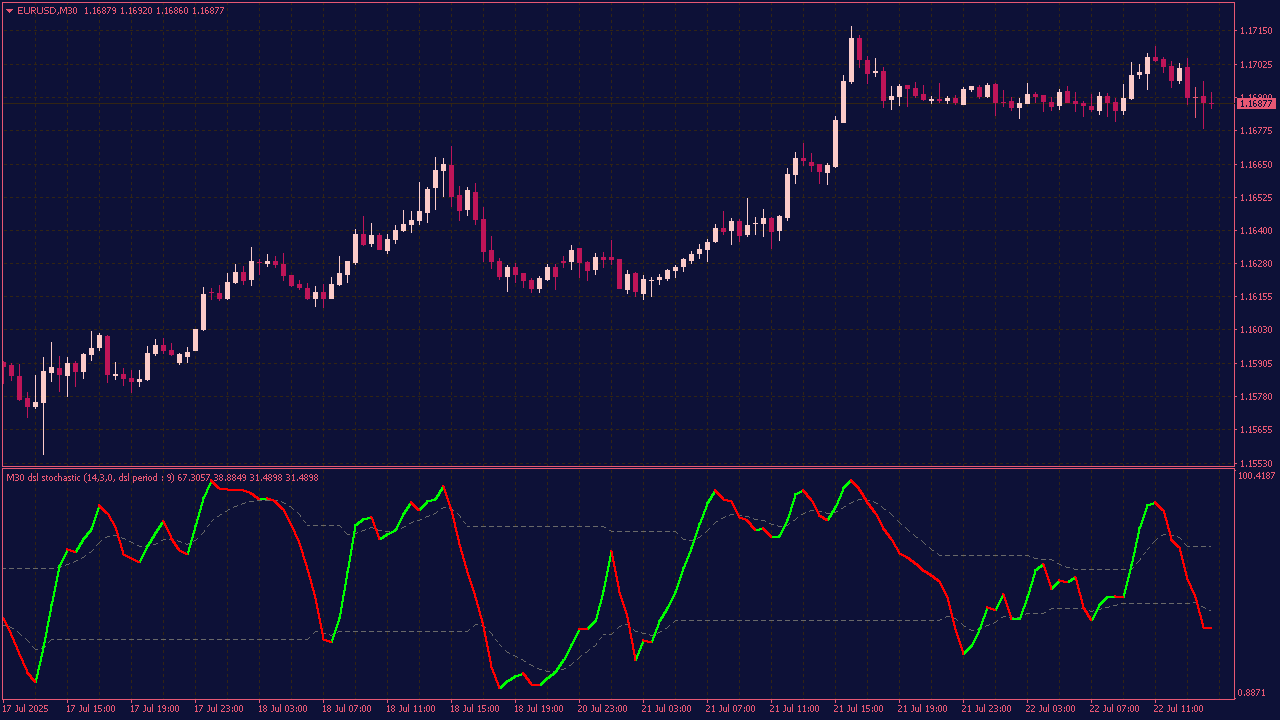
The DSL (Discontinued Signal Lines) Stochastic is a variation of the classic stochastic oscillator that uses adaptive, dynamic signal lines instead of fixed levels. These signal lines adjust based on market conditions, helping to filter out noise and provide more accurate overbought/oversold signals. It aims to improve timing for entries and exits by offering smoother, context-sensitive trend signals.
The Stochastic on Chart indicator overlays the Stochastic Oscillator directly onto the price chart, rather than in a separate panel. It visually aligns the oscillator's signals (overbought, oversold, and crossovers) with price action, helping traders identify potential reversal points and trend shifts more intuitively. This tool is particularly useful for spotting divergences and refining entry/exit timing within the price structure.
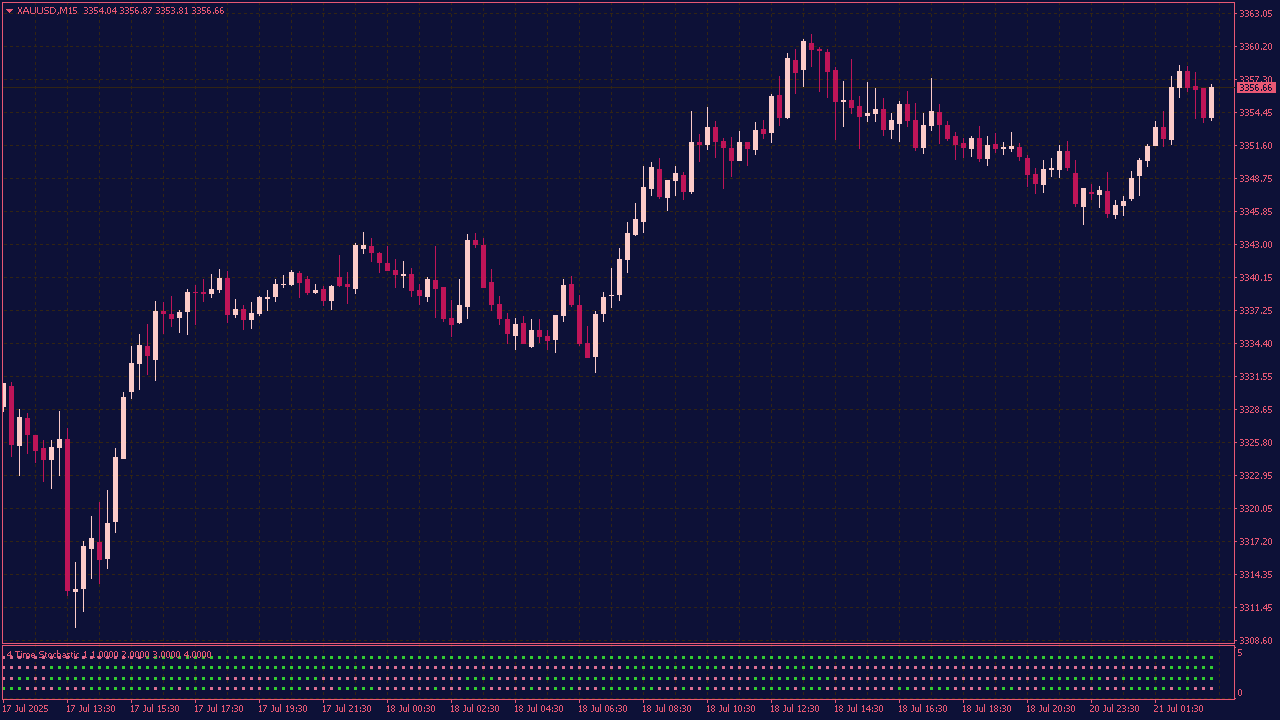
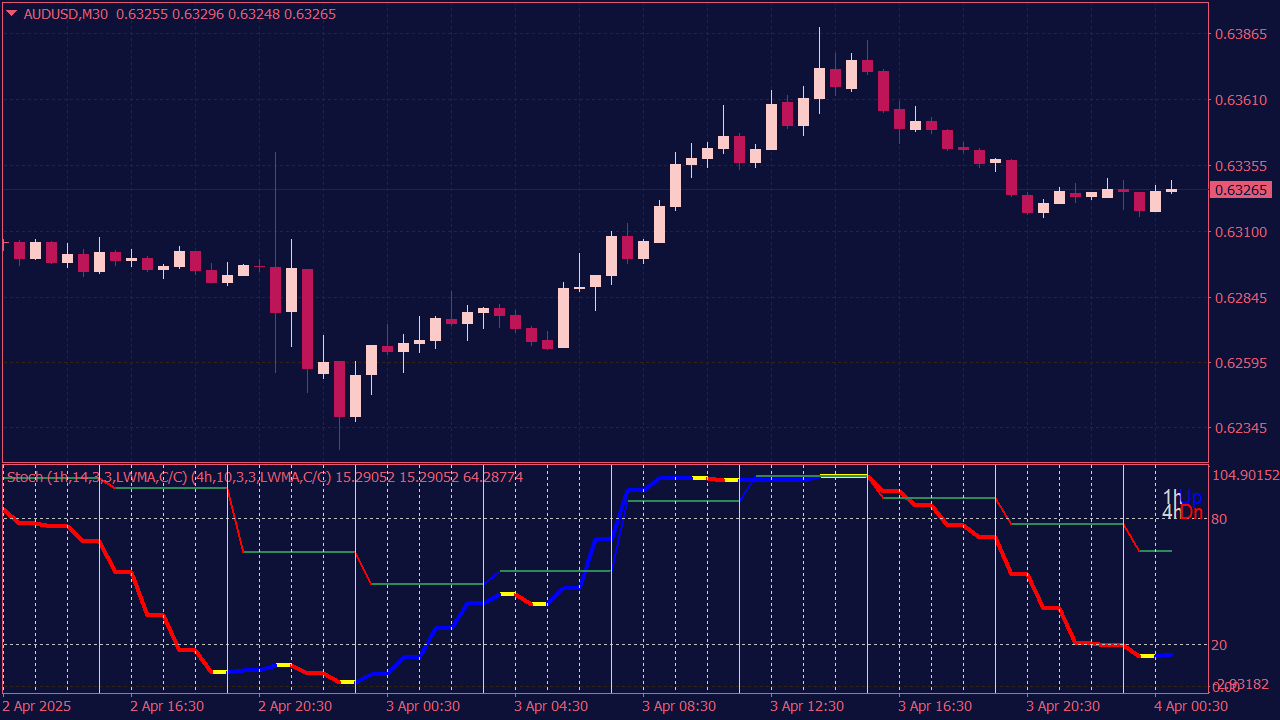
The 4 Time Frame Stochastic Indicator displays Stochastic Oscillator values from four different time frames on a single chart. It helps traders identify overbought or oversold conditions across multiple time frames simultaneously, improving trend confirmation and signal accuracy for better trading decisions.
The Color Stochastic MTF Indicator with Arrows is a multi-timeframe version of the Stochastic Oscillator that displays buy and sell signals using arrows and color changes. It highlights overbought and oversold conditions across different timeframes and marks potential reversal points with clear visual cues. This helps traders identify trend shifts and entry/exit opportunities more effectively.
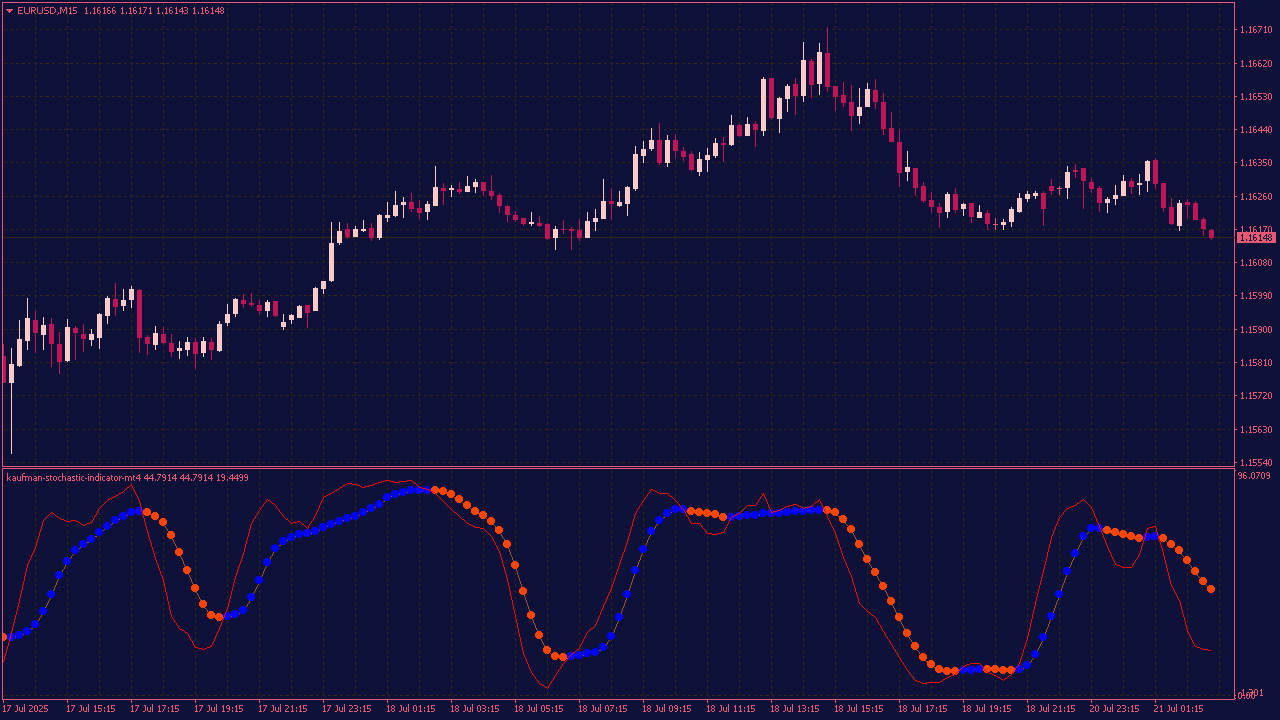
The Kaufman Stochastic Indicator is a momentum-based technical indicator that blends the Stochastic Oscillator with Kaufman’s Adaptive Moving Average (KAMA). It aims to reduce market noise and provide smoother, more adaptive signals for identifying overbought and oversold conditions.
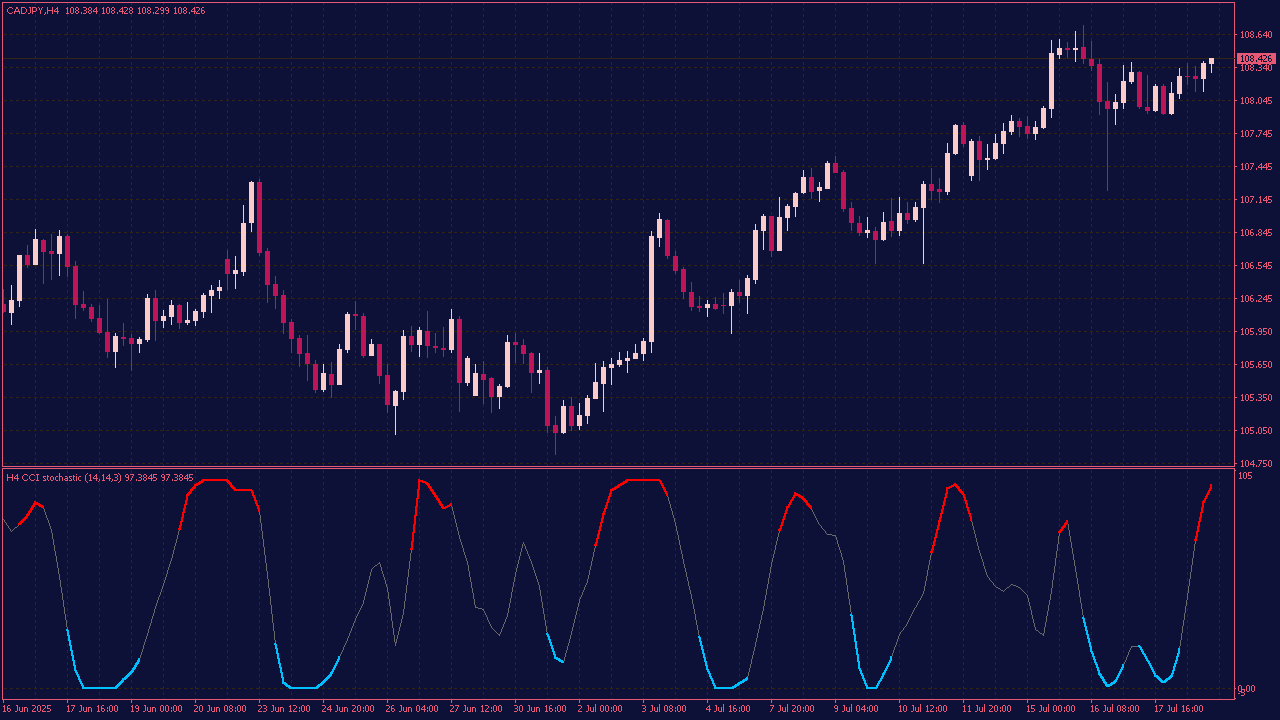
The CCI Stochastic Indicator is a custom technical analysis tool that combines the Commodity Channel Index and the Stochastic Oscillator to identify overbought or oversold market conditions with greater precision. It blends CCI’s ability to detect price deviations from the average with the Stochastic Oscillator’s momentum tracking, helping traders spot potential trend reversals and entry/exit points more effectively.
The Multi Pair Stochastic MTF Dashboard is a powerful and intuitive trading tool designed to monitor Stochastic Oscillator values across multiple currency pairs and timeframes in real time. With a compact yet informative heatmap-style interface, this dashboard provides traders with a comprehensive market overview, helping identify potential overbought and oversold conditions at a glance.
The Stochastic Cycle Indicator is a technical analysis tool that combines cyclical price filtering with the stochastic oscillator to better identify market turning points, highlighting overbought and oversold conditions within dominant market cycles.
The Higher High and Lower Low Stochastic is a modified stochastic indicator that focuses on identifying shifts in momentum by tracking when the stochastic makes higher highs (HH) or lower lows (LL) compared to previous swings.
A Higher High in the stochastic suggests strengthening upward momentum.
A Lower Low indicates increasing bearish pressure.
Traders use this tool to confirm trend direction, spot potential reversals, or detect divergence between price and momentum. It enhances the classic stochastic by emphasizing the breakout behavior of the oscillator itself, not just overbought or oversold zones.
The Double Stochastic Indicator is a technical analysis tool that applies the stochastic oscillator formula twice to smooth out price action and generate more reliable buy and sell signals. It helps identify overbought and oversold conditions, with sensitivity to market movement, while reducing false signals compared to a standard stochastic. Traders use it to spot potential reversals and trends through crossovers and divergence patterns.
The Stochastic MTF Histogram with Arrows and Alerts is a trading indicator that combines the Stochastic oscillator applied across multiple timeframes into a histogram format. The histogram visually represents the difference between %K and %D lines from a higher timeframe, highlighting momentum shifts. Arrows appear on the chart to signal potential buy (when histogram crosses above zero) and sell (when it crosses below zero) opportunities. Alerts can be set to notify traders of these signal events in real-time, helping them to time entries and exits more effectively.
The 2 Time Frame Color Stochastic with Direction is a multi-timeframe technical analysis tool designed to enhance the traditional stochastic oscillator by combining momentum data from two different time frames. Its primary purpose is to identify high-probability trade setups by aligning shorter-term momentum with higher time frame trend direction.
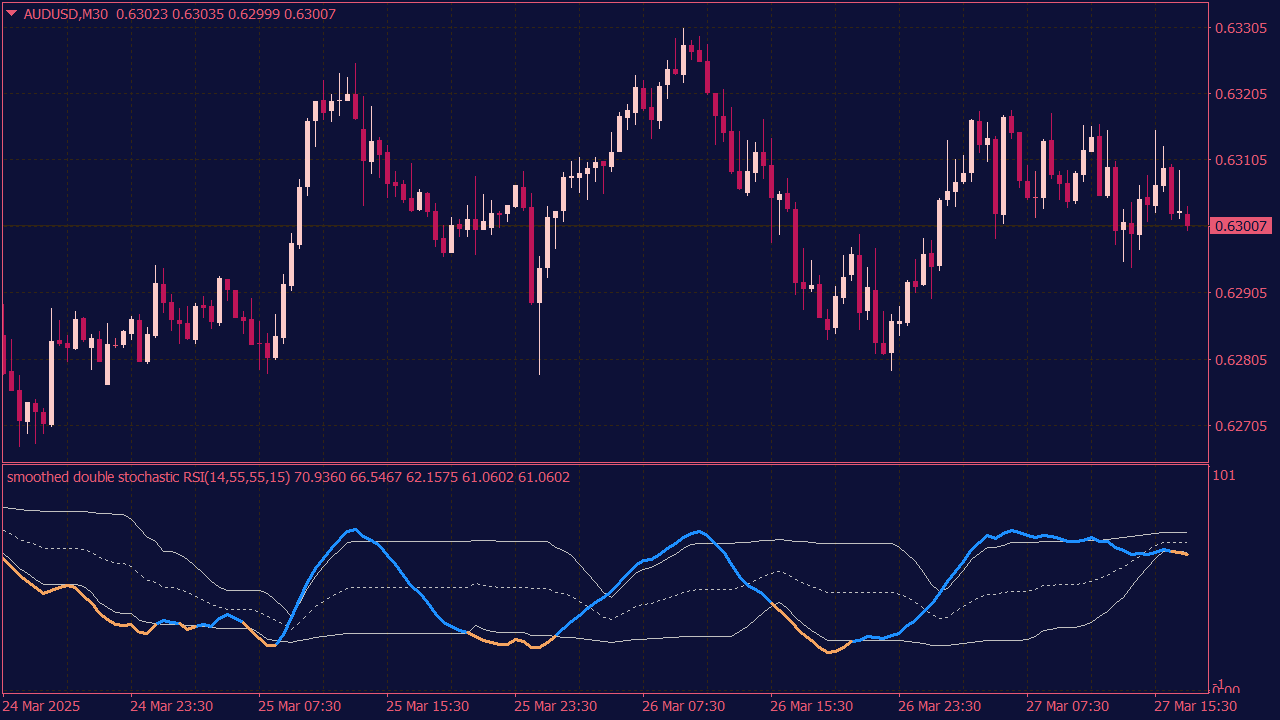
The Double Smoothed Stochastic RSI is a momentum oscillator that applies two layers of smoothing to the Stochastic RSI, reducing noise and improving signal clarity. It features dynamic overbought and oversold levels ("floating levels") that adjust based on market volatility, making it more adaptive than traditional fixed-level indicators. This tool is useful for identifying trend reversals, overbought/oversold conditions, and divergence signals with improved precision.
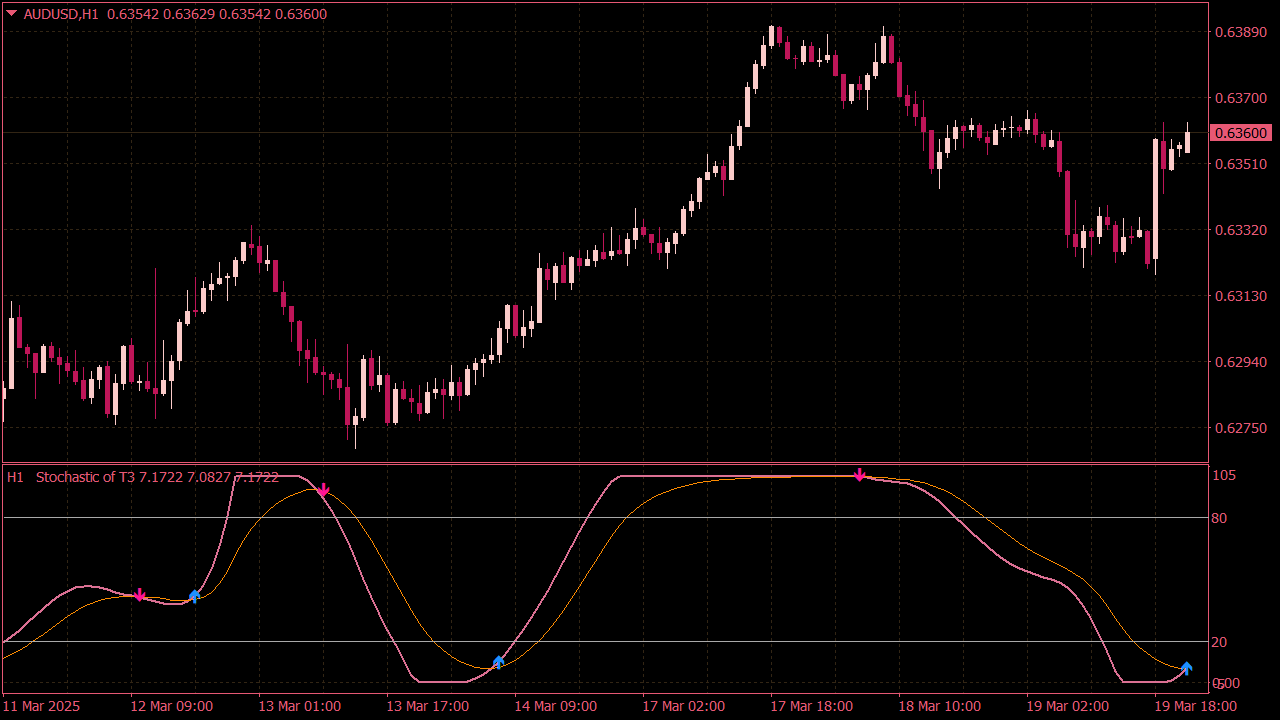
This indicator combines the Stochastic Oscillator with multi-timeframe analysis and the T3 moving average for smoother signals. It displays buy/sell arrows based on overbought/oversold levels and T3 crossovers, with alerts for signal generation. Designed for traders who want to catch trend reversals or continuations with reduced noise, this tool enhances decision-making using a blend of momentum, smoothing, and timeframe confirmation.
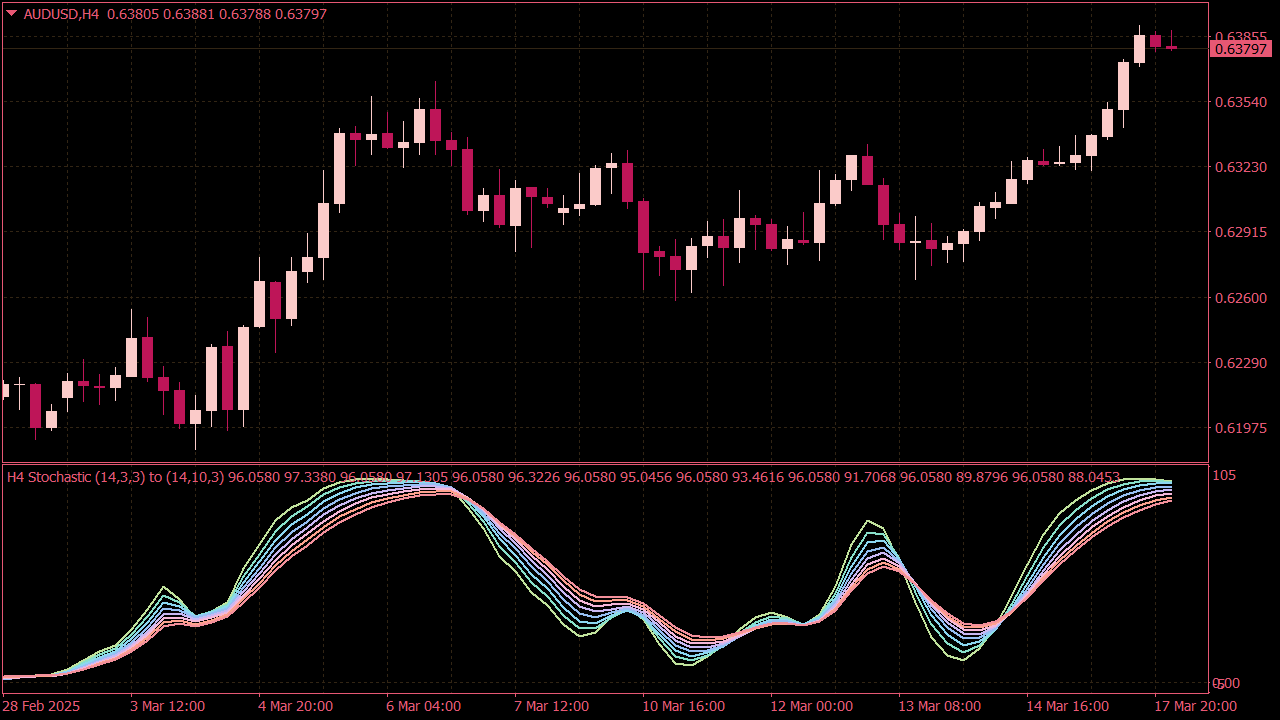
The Multi Stochastic Rainbow MTF Indicator is a technical analysis tool that overlays multiple stochastic oscillators from different timeframes on a single chart. This creates a "rainbow" visual effect and helps traders identify overbought/oversold conditions, trend strength, and potential reversal zones with a multi-timeframe perspective. It enhances decision-making by aligning stochastic signals across timeframes, making it useful for scalping, swing trading, and trend confirmation.
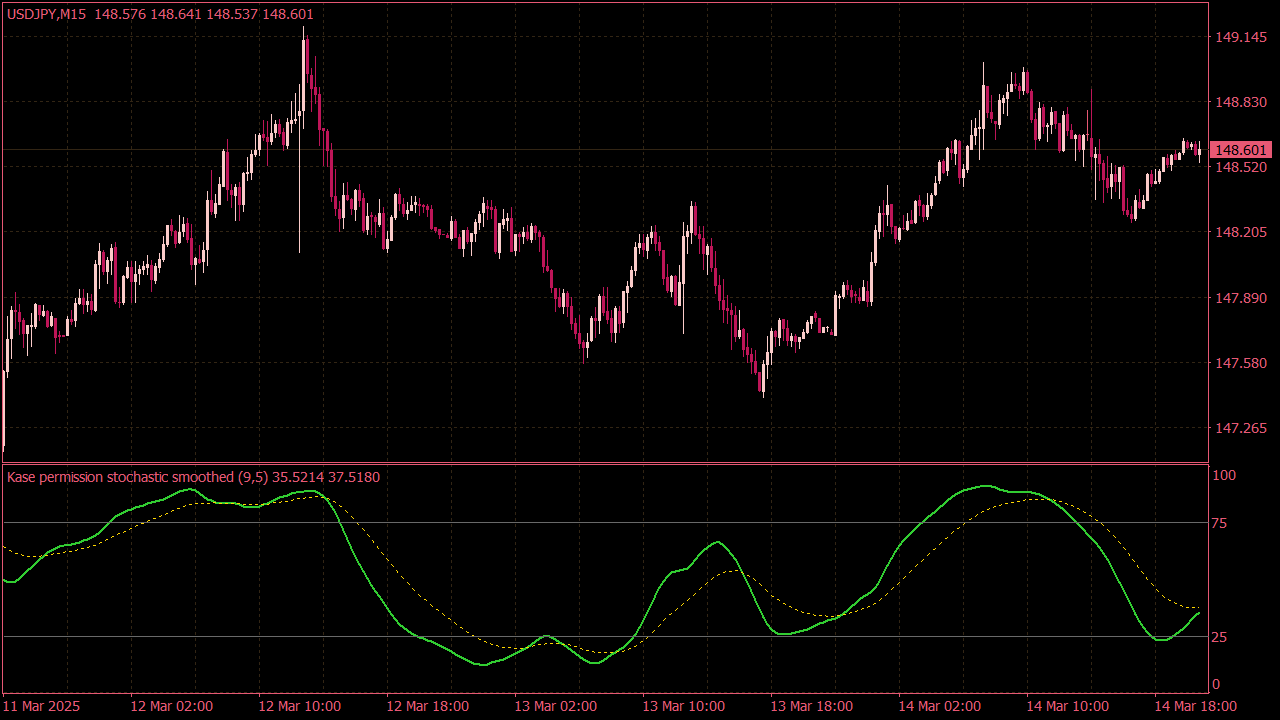
The Kase Permission Smoothed Stochastic with Alerts is a refined momentum indicator that combines the Kase Permission Stochastic method with smoothing techniques to reduce noise and improve signal clarity. It helps traders identify overbought and oversold conditions with enhanced precision. The built-in alert system notifies users of key crossover points and potential trend reversals, making it easier to time entries and exits.
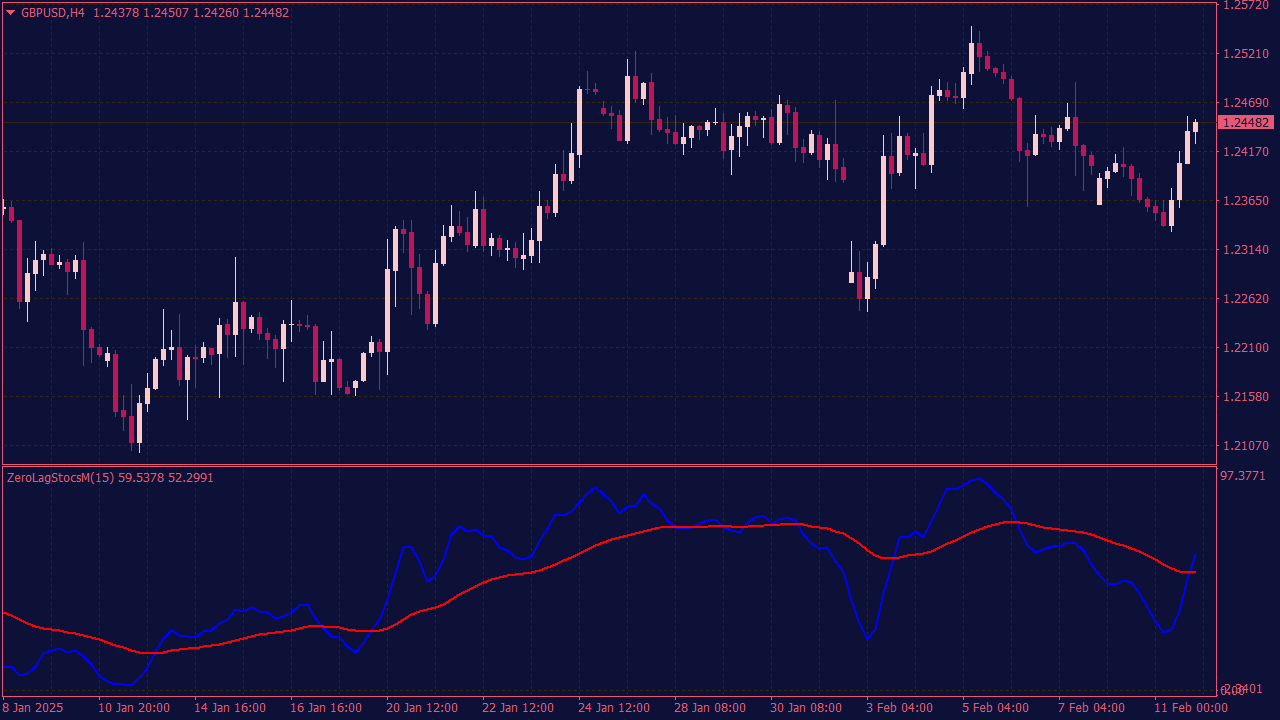
The Zero Lag Stochastic Indicator is a momentum oscillator that improves on the traditional stochastic by reducing lag through advanced smoothing techniques. It provides faster, more responsive signals for identifying overbought and oversold conditions, making it ideal for short-term and intraday trading.
🎯 The Stochastic Oscillator in Forex: What the 80/20 Rule Doesn’t Tell You
The Stochastic Oscillator is one of the first indicators many Forex traders add to their charts. It looks simple, is easy to read, and, at first, feels almost obvious.
The basic idea is simple: above 80 means overbought, below 20 means oversold, and when the two lines cross, a signal appears.
That is the textbook explanation. It is also why many traders get into trouble.
Live markets are rarely that clean. EUR/USD can remain overbought and still push higher. GBP/JPY can stay oversold and continue falling. A neat crossover can appear just before price moves in the opposite direction.
The problem is not necessarily the indicator. The problem is treating it like a complete trading system.
The Stochastic Oscillator is best understood as a momentum tool. It helps traders identify when short-term momentum is stretched, resetting, weakening, or returning. But it only becomes useful when it is read together with price structure, trend direction, key levels, session timing, and risk management.
Used mechanically, it creates false confidence. Used with context, it can add real clarity.
⚠️ The 80/20 Trap
The most common mistake is also the most expensive one: selling only because the Stochastic is above 80, or buying only because it is below 20.
An overbought reading does not automatically mean the market is ready to fall. In a strong uptrend, it may simply show that buyers are still in control. The same is true in reverse. An oversold reading in a strong downtrend may show continued selling pressure, not an immediate buying opportunity.
This is why the first question should never be, “Is the Stochastic overbought or oversold?”
A better question is: What kind of market is this—trending, ranging, or trapping traders around a key level?
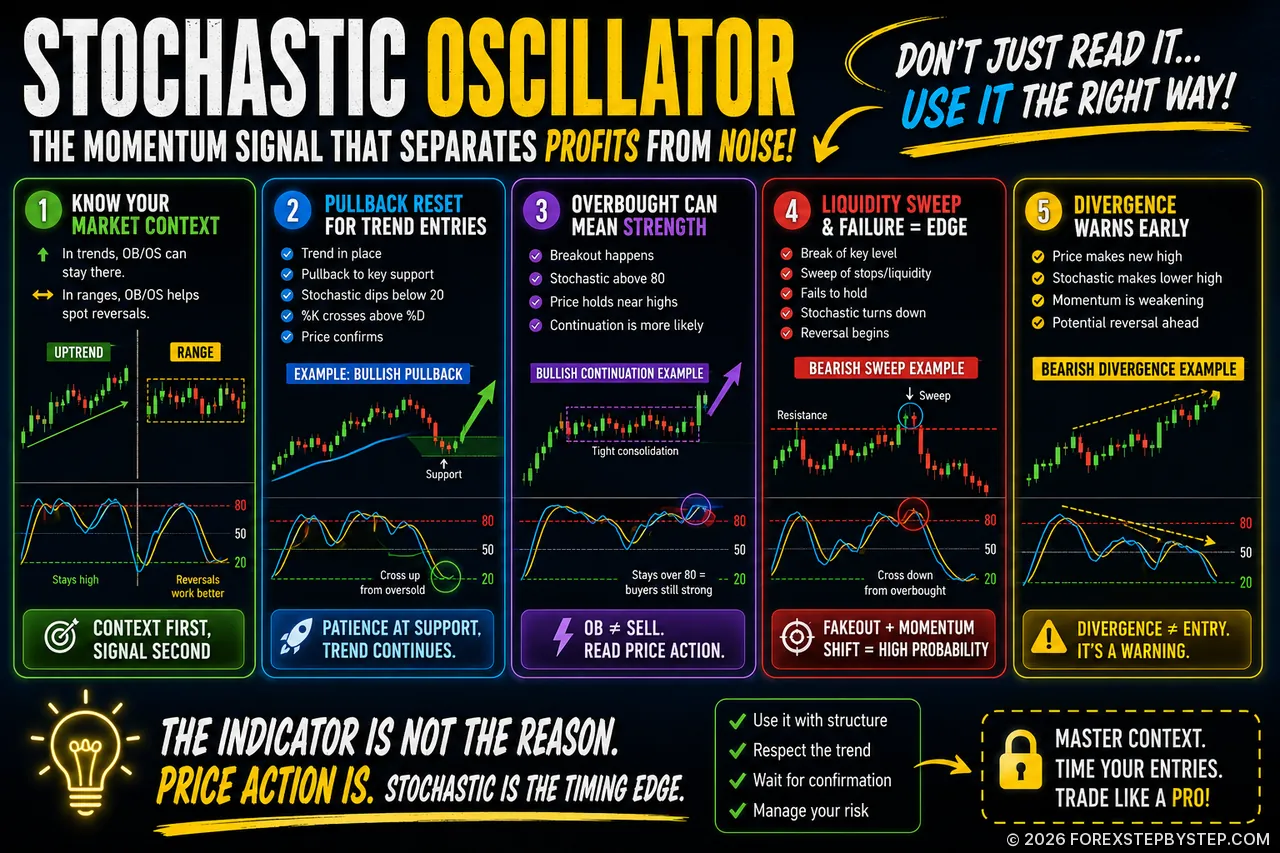
In a range, the 80 and 20 zones can help identify potential turning points. In a strong trend, those same zones can be dangerous if they are used blindly.
The reading matters. But the market condition matters more.
🔄 The Pullback Reset
One of the cleaner ways to use the Stochastic Oscillator is to look for pullbacks inside an existing trend.
This approach is different from trying to pick tops and bottoms. Instead of fighting the trend, the trader waits for price to pull back and uses the Stochastic to judge whether short-term momentum has cooled down enough for the trend to continue.
For example, imagine a currency pair is in a clear uptrend. Price is forming higher highs and higher lows. Then a pullback begins. Some traders become nervous and assume the move is over. Others start looking for short trades too early.
During that pullback, the Stochastic drops toward the oversold zone.
That does not mean the trader should buy immediately. It simply means the pullback may be reaching a momentum reset point.
A stronger bullish pullback setup usually includes:
A clear uptrend on the chart.
A pullback into support, a moving average, a trendline, or a previous breakout zone.
The Stochastic moving below 20 or close to it.
%K crossing back above %D.
Price confirming with a bullish candle, a higher low, or a break of minor resistance.
The Stochastic is not the reason for the trade. It is the timing filter.
The same logic applies in a downtrend. Price rallies into resistance, the Stochastic becomes overbought, and the trader waits for evidence that sellers are returning.
This is where the indicator becomes more useful: not as a reversal button, but as a way to time a continuation setup.
🚀 When Overbought Is Actually Bullish
This is one of the ideas newer traders often struggle with.
Sometimes an overbought Stochastic reading is not bearish at all. Sometimes it confirms strength.
Suppose price breaks above resistance and the Stochastic moves above 80. Many traders immediately start looking for a short entry. But instead of falling back into the range, price holds near the highs. Pullbacks are shallow. Buyers keep stepping in.
That is not weakness. That can be a sign of strong demand.
The key is to watch what price does while the Stochastic is overbought. If price rejects resistance and closes back below the breakout level, the overbought reading becomes more meaningful. But if price holds firm near the highs, the market may be preparing for continuation.
The same indicator reading can tell a completely different story depending on price behavior.
The chart comes first. The oscillator comes second.
🧲 The Liquidity Sweep Setup
A more advanced use of the Stochastic Oscillator appears after failed breakouts.
Forex markets often push beyond obvious highs and lows before reversing. These areas attract stop losses, breakout orders, and emotional entries. When price breaks through such a level but quickly returns back inside the previous range, the move may have been a liquidity sweep rather than a real breakout.
The Stochastic can help confirm whether that move is losing momentum.
A bearish version may look like this:
Price breaks above a visible resistance level or previous high.
The Stochastic is already above 80.
The breakout fails to hold.
Price closes back below the broken level.
%K crosses below %D.
Sellers begin to take control.
The signal is not interesting simply because the Stochastic is overbought. It becomes interesting because price attacked a key level, failed to stay above it, and momentum started turning down.
The bullish version works in reverse. Price breaks below a previous low, triggers stops, then quickly reclaims the level. If the Stochastic is below 20 and begins to turn upward while price closes back inside the range, late sellers may be trapped.
This setup is strongest when the level is obvious. If there is no meaningful high, low, support, or resistance nearby, the signal loses much of its value.
🌀 The Double-Dip Signal
A single oversold or overbought reading is often too early. The second one can be more useful.
Imagine price is falling and the Stochastic drops below 20. Price bounces slightly, then makes another push lower. Now the important question is whether momentum confirms the new low.
If price makes a lower low but the Stochastic forms a higher low, selling pressure may be weakening. Price is still moving lower, but the force behind the move is no longer as strong.
That does not mean the market must reverse immediately. It simply tells the trader to pay attention.
The bullish version becomes more convincing when price later breaks minor resistance or forms a clear rejection candle near support.
The bearish version is the opposite. Price makes a high, pulls back, then pushes higher again. If the Stochastic forms a lower high on the second attempt, buying momentum may be fading.
Markets often turn after a second failed attempt, not after the first warning.
🕵️ Hidden Divergence: The Underused Continuation Signal
Most traders know regular divergence. Fewer traders use hidden divergence well.
Regular divergence often warns that a trend may be weakening. Hidden divergence is different. It often points toward continuation.
In a bullish trend, price may form a higher low while the Stochastic forms a lower low. At first, the indicator looks weak. But the important detail is that price has not broken structure.
Momentum has reset, but the trend remains intact.
That can create a continuation opportunity.
A bullish hidden divergence setup may include:
Price is in an uptrend.
Price pulls back and forms a higher low.
The Stochastic forms a lower low.
Support holds.
%K crosses above %D.
Price breaks short-term resistance.
In simple terms, the oscillator became weaker, but price did not. The market cooled down without damaging the larger trend.
The bearish version works the other way around. Price forms a lower high while the Stochastic forms a higher high. The oscillator shows temporary strength, but price fails to change the broader bearish structure.
Hidden divergence is not dramatic. It does not always produce a perfect entry. But for traders who prefer continuation trades, it is one of the more useful Stochastic signals.
⚖️ The 50 Line Matters More Than It Gets Credit For
Most traders focus on 20 and 80. That makes sense, but it leaves out an important part of the indicator.
The 50 line can help traders read momentum direction.
When the Stochastic moves above 50 and stays there, bullish momentum may be improving. When it moves below 50 and remains there, bearish momentum may be gaining strength.
This can be especially useful after consolidation.
For example, price has been moving sideways below resistance. The Stochastic is chopping around the middle, offering no clean signal. Then price breaks resistance, and the oscillator moves above 50.
That can be the first sign of a momentum shift.
If price later retests the breakout area and the Stochastic holds above 50, the breakout becomes more credible.
The same idea applies to bearish moves. If price breaks support and the Stochastic moves below 50, the market may be shifting into a more bearish phase.
The 50 line is less dramatic than an extreme reading, but it often gives a cleaner view of direction.
📦 Compression: When No Signal Is the Signal
There are times when the Stochastic looks almost useless. The two lines cross repeatedly. The oscillator moves sideways. Signals fail quickly.
Many traders get frustrated and start forcing trades.
But that messy behavior can still tell a story.
A flat or compressed Stochastic often appears when the market is building pressure. Price may be forming a tight range, triangle, flag, or consolidation box. Volatility dries up. Momentum becomes unclear.
This is not the moment to trade every crossover. It is the moment to wait.
The opportunity usually appears after price breaks out of the range. If the Stochastic expands in the same direction as the breakout, momentum may be returning.
Inside the range, the oscillator is mostly noise. After the breakout, it can become confirmation.
🕰️ Session Timing Changes Signal Quality
A Stochastic signal is not equally useful at every hour of the trading day.
Forex is a liquidity-driven market. A signal during an active session can carry more weight than the same signal during a quiet period.
For EUR/USD and GBP/USD, signals during the London session, the New York session, or the London-New York overlap often deserve more attention. For AUD, NZD, and JPY pairs, the Asian session may be more relevant.
This does not mean every signal outside an active session is useless. It simply means traders should be realistic.
A Stochastic reversal at a major level during London trading is not the same as a random crossover in the middle of a quiet market.
Momentum needs participation. Without enough liquidity, even a clean-looking signal can fail to develop.
📰 Be Careful Around Major News
The Stochastic Oscillator becomes less reliable when the market is reacting to major news.
Inflation reports, central bank decisions, employment data, and unexpected policy comments can create fast, emotional price moves. During those periods, the oscillator may be reacting to volatility rather than offering a clean technical signal.
A pair can look overbought and still move much higher. It can look oversold and still fall sharply.
For that reason, many traders avoid fresh oscillator-based entries directly before high-impact news events.
A more patient approach is to wait for the first reaction, then see whether price confirms or rejects the move. Often, the first move after news is emotional. The second move is cleaner.
The Stochastic can still be useful after the initial shock, but it should not be treated as reliable during the first burst of volatility.
🧠 A Better Way to Read Every Stochastic Signal
Before acting on any Stochastic signal, traders should slow down and ask a few practical questions:
Is the market trending or ranging?
Is price near support, resistance, or a liquidity area?
Does the signal agree with the higher timeframe?
Is the Stochastic confirming price action, or only showing an extreme?
Has price actually reacted?
Is there enough room for a realistic target?
Is the risk clear before entering?
This process filters many weak setups.
The Stochastic Oscillator should not create a trade idea on its own. It should support a trade idea that already makes sense on the chart.
That is the difference between reacting and analyzing.
🔥 Five Practical Stochastic Setups for Forex Traders
1️⃣ The Trend Reload
This setup works best when the market is already trending.
In an uptrend, wait for price to pull back into a support area. The Stochastic should move below 20 or close to it. If price holds structure and %K crosses above %D, the pullback may be losing strength.
A stronger version appears when price forms a higher low and then breaks the minor pullback high.
This is not a bottom-picking strategy. It is a continuation setup with better timing.
For a bearish version, reverse the logic. Price rallies into resistance during a downtrend, the Stochastic becomes overbought, and sellers return after confirmation.
2️⃣ The Liquidity Sweep Reversal
This setup starts with a failed move beyond an obvious level.
For a bullish version, price breaks below a previous low, triggers stops, and then quickly closes back above the level. If the Stochastic is oversold and begins to turn upward, the market may have trapped late sellers.
Confirmation matters. A break above the rejection candle or minor resistance can make the setup cleaner.
For a bearish version, price breaks above a previous high, fails to hold the move, and closes back below resistance while the Stochastic turns down from overbought territory.
The key is not the oscillator alone. The key is the failed breakout.
3️⃣ The Hidden Divergence Continuation
This setup is useful when the larger trend remains intact.
In a bullish market, price forms a higher low while the Stochastic forms a lower low. This shows that momentum has reset more deeply than price. If support holds and price breaks minor resistance, the trend may continue.
In a bearish market, price forms a lower high while the Stochastic forms a higher high. If resistance holds and price breaks minor support, sellers may regain control.
Hidden divergence works best when it appears at a logical pullback area, not in the middle of nowhere.
4️⃣ The Midline Breakout
This setup uses the 50 line instead of the classic 20 and 80 zones.
After consolidation, watch how the Stochastic behaves around 50.
If price breaks resistance and the Stochastic moves above 50, bullish momentum may be improving. If price retests the breakout zone and the oscillator stays above 50, the breakout becomes more credible.
For bearish setups, look for price to break support while the Stochastic moves below 50 and remains there.
This setup is less dramatic than an extreme-zone signal, but it can be cleaner because it focuses on momentum direction rather than exhaustion.
5️⃣ The Double Extreme Exhaustion
This setup works best after an extended move.
In a downtrend, price makes two pushes lower. If the second push creates a lower low but the Stochastic forms a higher low, selling pressure may be weakening.
That is only a warning. The entry should come after price confirms with a break of minor resistance or a clear reversal candle.
In an uptrend, look for two pushes higher. If price makes another high but the Stochastic forms a lower high, buying pressure may be fading. Confirmation comes when price breaks minor support.
The second extreme matters because it shows whether momentum is still supporting the trend.
✅ Final Thoughts
The Stochastic Oscillator is often treated as a beginner indicator, but that reputation is misleading.
The tool itself is not the problem. The problem is using it too mechanically.
Buying only because the indicator is below 20 is not a strategy. Selling only because it is above 80 is not analysis. In many market conditions, that kind of thinking leads traders into weak entries.
The real value of the Stochastic Oscillator appears when it is combined with market structure, support and resistance, liquidity behavior, session timing, trend direction, and risk management.
A useful Stochastic signal should answer one question:
Is momentum confirming what price is already suggesting?
When the answer is yes, the indicator can add clarity. When the answer is no, it is usually better to wait.
That is the difference between using the Stochastic as a shortcut and using it as a professional decision-making tool.
📝 Editor’s Note
The strategies and market concepts discussed in our content are designed to help readers better understand market behavior. They are not trading recommendations. Financial markets are volatile, and every trader should test ideas carefully, manage risk and make independent decisions.