MT5 Trend Following or Trend Strength Indicators Histogram and Arrows

MT5 Trend Following or Trend Strength Indicators Histogram and Arrows

by Specialist 🫡 -
Number of replies: 8

Perfect Trendline Indicator

Perfect Trendline Indicator for MT5

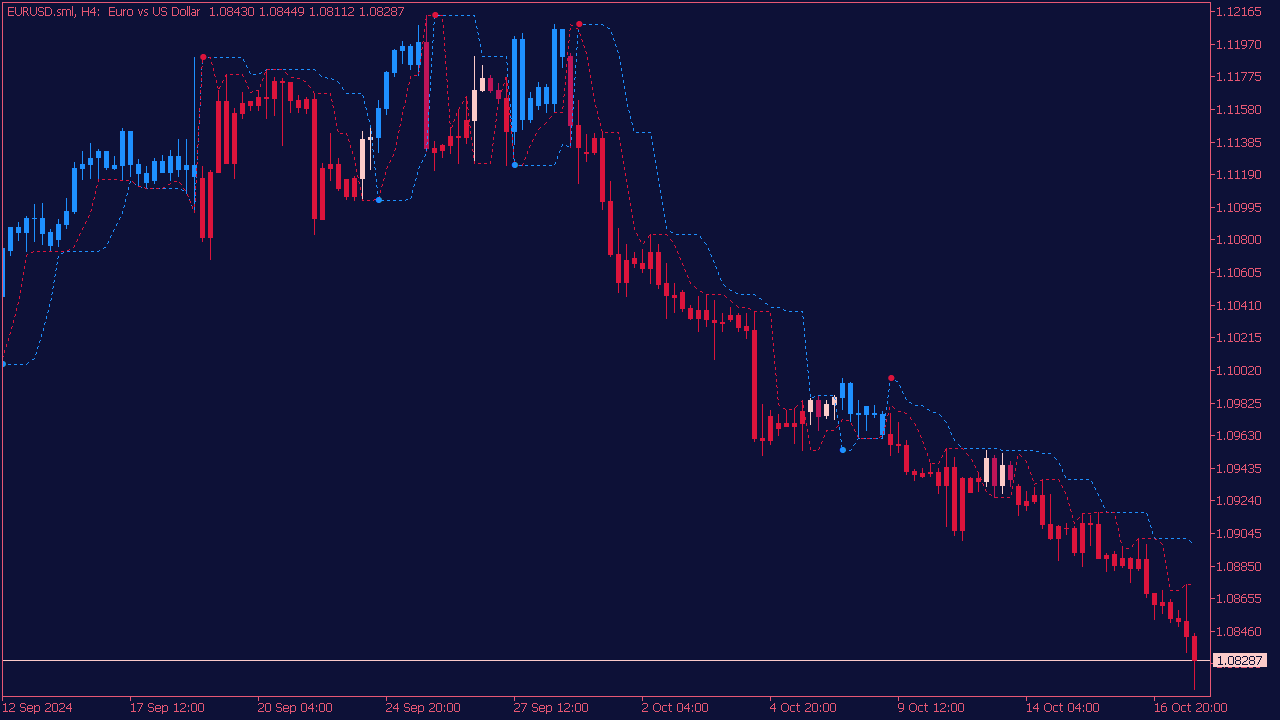
The Perfect Trendline Indicator helps traders identify key support and resistance levels, allowing for more informed decision-making. Here are some tips for using it effectively: Firstly, pay attention to the trend direction indicated by the trendlines; trade in the direction of the prevailing trend for higher success rates. Secondly, look for confluence with other technical indicators, such as moving averages or RSI, to confirm entry and exit points. Thirdly, use the indicator's signals in conjunction with proper risk management, setting stop losses just beyond the trendlines to minimize potential losses. Finally, practice on a demo account to familiarize yourself with the indicator's signals before trading with real money.

Trend Strength and Trend Following Indicators for MT5

by Specialist 🫡 -

Gann Multi Trend Indicator

Gann Multi Trend Indicator for MT5

The Gann Multi Trend Indicator is a tool used in technical analysis, based on the principles developed by W.D. Gann. It helps traders identify potential long and short trading opportunities by analyzing price trends and patterns over various timeframes. The indicator typically utilizes support and resistance levels, along with Gann angles, to provide signals: a long position may be suggested when the price is above certain moving averages or Gann lines, while a short position may be indicated when the price falls below them. Traders often incorporate this indicator with other analysis techniques to enhance decision-making.

Trend Strength and Trend Following Indicators for MT5

by Specialist 🫡 -

Trend Following Indicator

Trend Following Indicator for MT5

When using trend-following indicators for trading, consider the following tips: First, identify the primary trend through moving averages, such as the 50-day or 200-day, to determine your bias. Next, combine trend indicators like the Average Directional Index (ADX) to assess trend strength, ensuring you only enter trades when the trend is strong enough. Use momentum indicators, such as the Relative Strength Index (RSI), to avoid overbought or oversold conditions. Set your entry points based on breakouts or pullbacks to key support or resistance levels, and always utilize stop-loss orders to manage risk. Finally, maintain a disciplined trading plan, adjusting your strategy as market conditions change.

Trend Strength and Trend Following Indicators for MT5

by Specialist 🫡 -

Trend Flex Indicator

Trend Flex Indicator for MT5

The Trend Flex Indicator is a technical analysis tool used in trading to signal potential entries based on market trends. The blue color typically indicates a bullish trend, suggesting traders consider buying or going long, while the red color signals a bearish trend, prompting traders to sell or go short. Traders often look for confirmation through other indicators or price action before making entry decisions to enhance the reliability of the signals provided by the Trend Flex Indicator.