MT5 Support & Resistance Indicators with Supply & Demand

MT5 Support & Resistance Indicators with Supply & Demand

by The Specialist -
Number of replies: 3

Support and Resistance Indicator

Support and Resistance Indicator for MT5

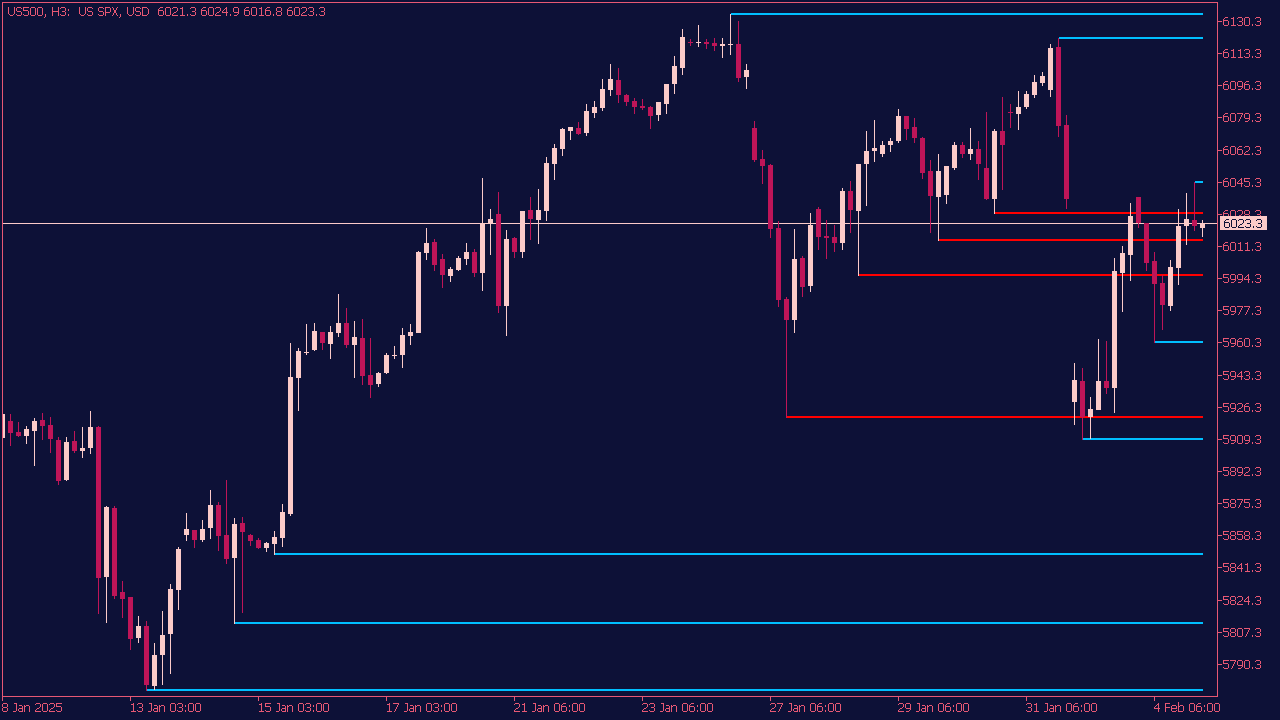
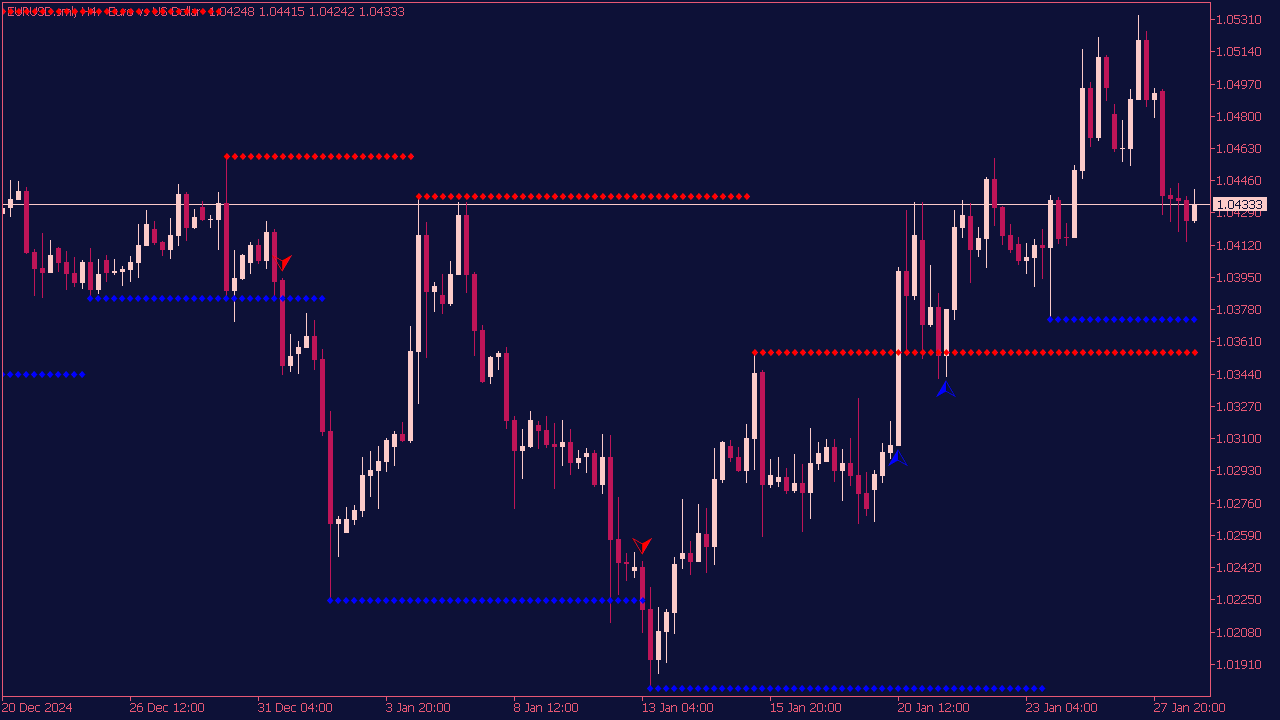
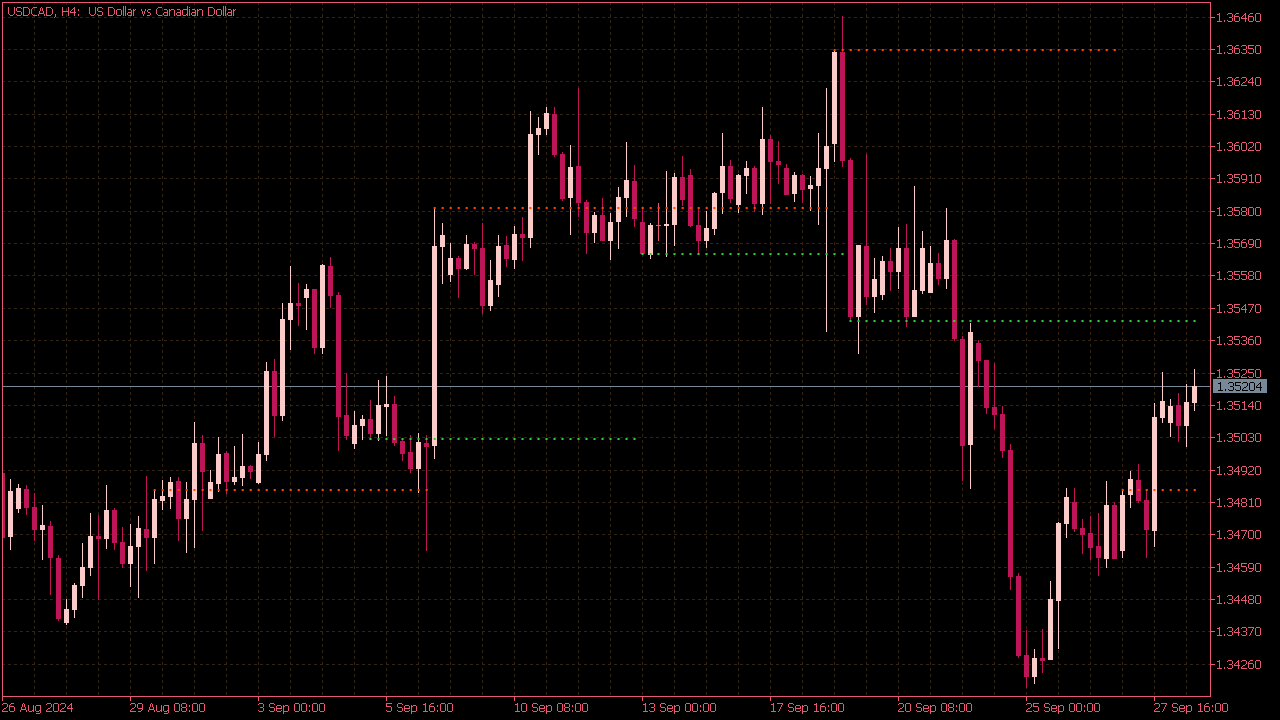
The Support and Resistance Indicator helps traders identify potential price levels where an asset might reverse direction or consolidate. Support represents a price level where buying interest is strong enough to overcome selling pressure, while resistance indicates a level where selling interest prevails over buying. To use these indicators effectively, traders should look for patterns where the price repeatedly bounces off support or gets rejected at resistance. Additionally, combining these indicators with other tools like trend lines, moving averages, or volume analysis can enhance decision-making. Monitoring price action around these levels can inform entry and exit points for trades, as well as stop-loss placements.

Support & Resistance Indicators for MT5

by The Specialist -

Shved Supply and Demand Indicator

Shved Supply and Demand Indicator for MT5

The Shved Supply and Demand Indicator is designed to identify key supply and demand levels on a price chart, aiding traders in determining where prices might reverse or consolidate. To trade using this indicator, first, you should identify the demand zones (areas where buying interest may increase) and supply zones (areas where selling interest may rise) marked by the indicator. Look for price action signals, such as reversals or breakouts, at these zones to time your entries. For risk management, consider placing stop-loss orders just outside the identified zones and aim for a risk-reward ratio that aligns with your trading strategy. Always combine this indicator with other analyses, like price action or fundamental factors, to enhance trading decisions.

Support & Resistance Indicators for MT5

by The Specialist -

Price Heatmap Indicator

Price Heatmap Indicator for MT5

The Price Heatmap Indicator is a visual tool designed to highlight areas of price activity based on volume and volatility, aiding in trading decisions. Trading rules typically include entering buy orders when the heatmap shows strong bullish sentiment (indicated by green zones) and selling or shorting when bearish sentiment is present (indicated by red zones). Traders may also consider the intensity of colors to gauge momentum strength, using price breakouts above key resistance levels or breakdowns below support levels indicated on the heatmap for timing their entries. Additionally, combining the heatmap analysis with other indicators such as moving averages or RSI can enhance decision-making and risk management.

Support & Resistance Indicators for MT5

by The Specialist -

WPR Support & Resistance Indicator

WPR Support & Resistance Indicator for MT5

An Auto Support & Resistance Indicator combined with the Williams Percent Range (WPR) can be an effective tool for traders seeking entry points. The indicator identifies key support and resistance levels based on historical price action, while the WPR, which ranges from -100 to 0, helps determine overbought or oversold conditions. A potential trade entry signal could occur when the price approaches a support or resistance level, and the WPR indicates that the market is overbought (above -20) or oversold (below -80), prompting traders to look for reversal or continuation patterns. Implementing risk management strategies alongside this approach can enhance trading effectiveness.