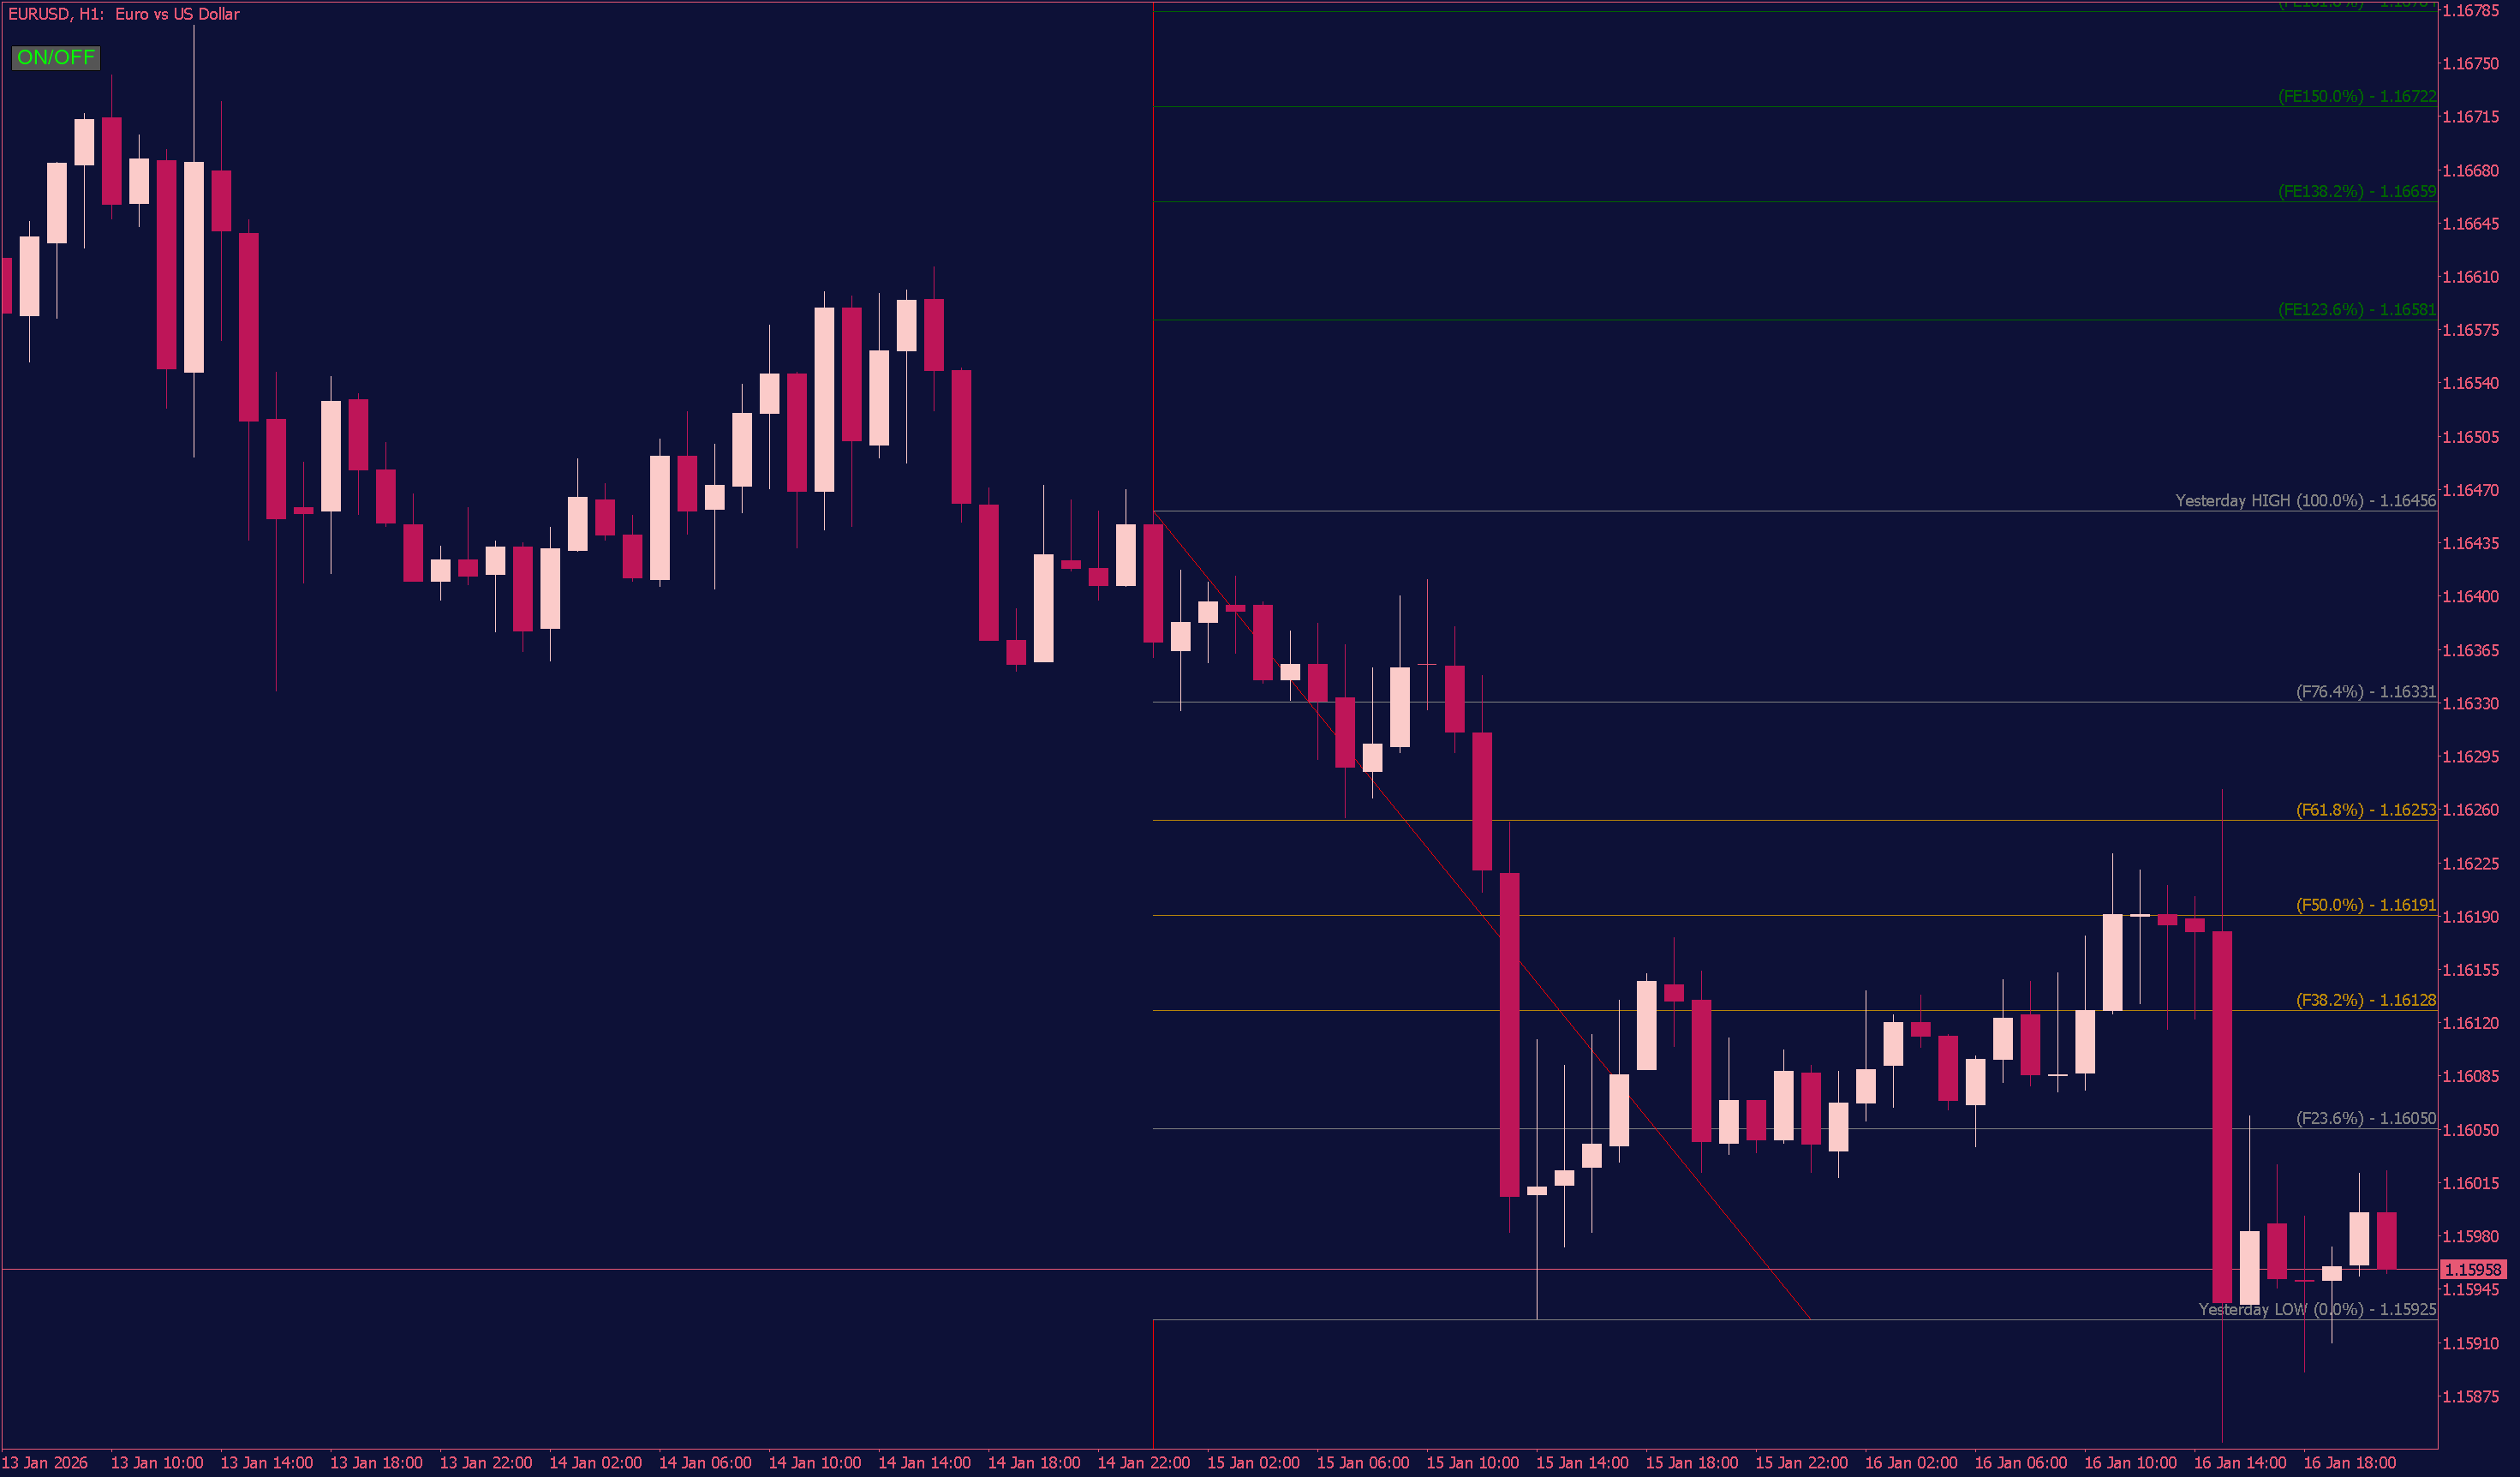
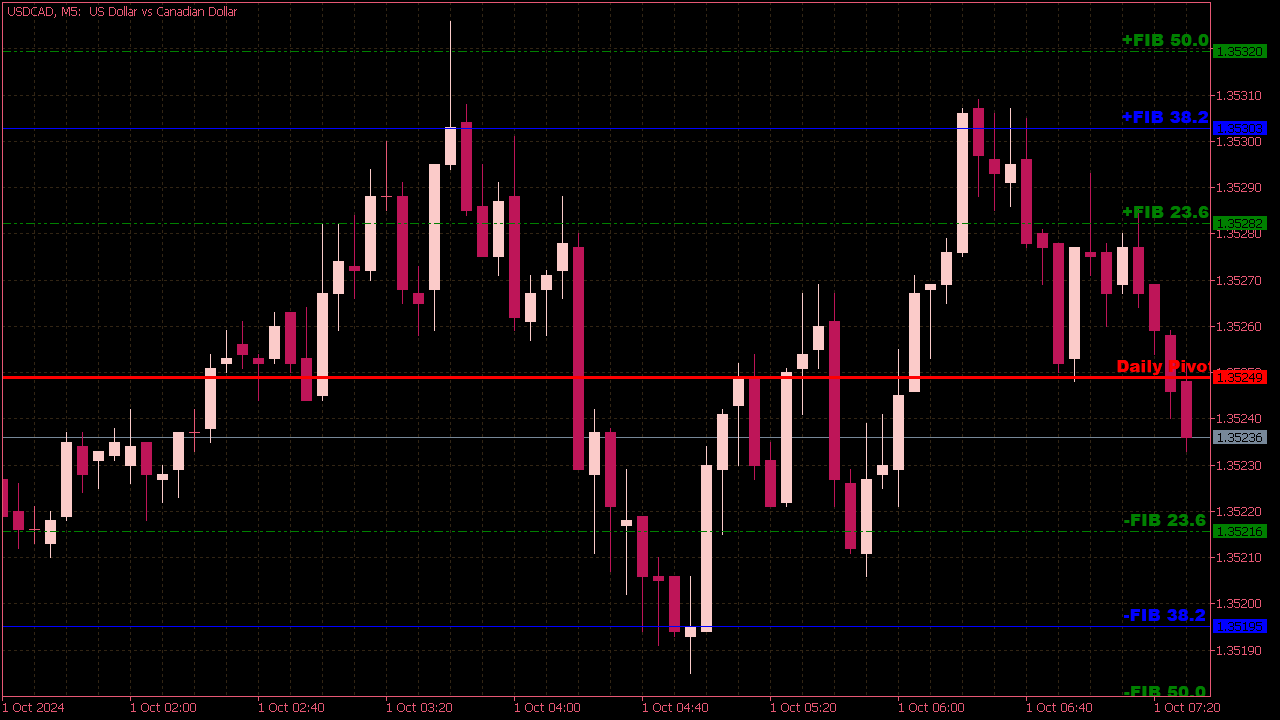
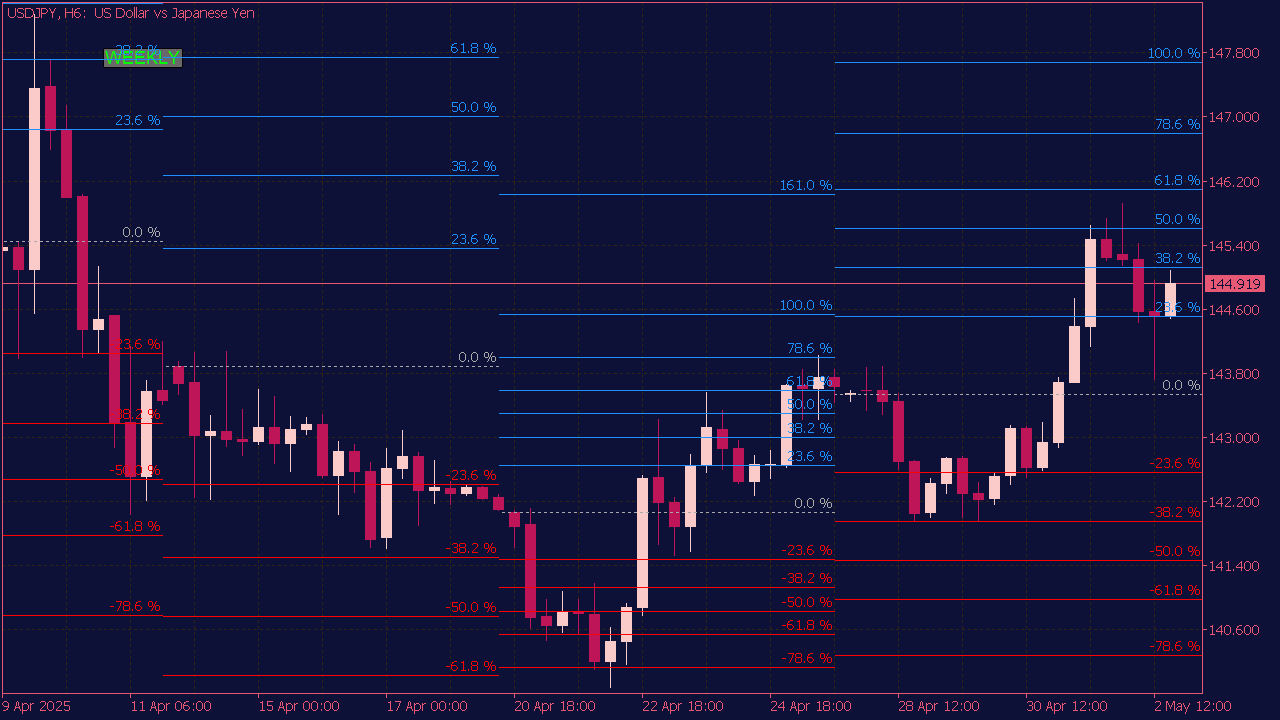
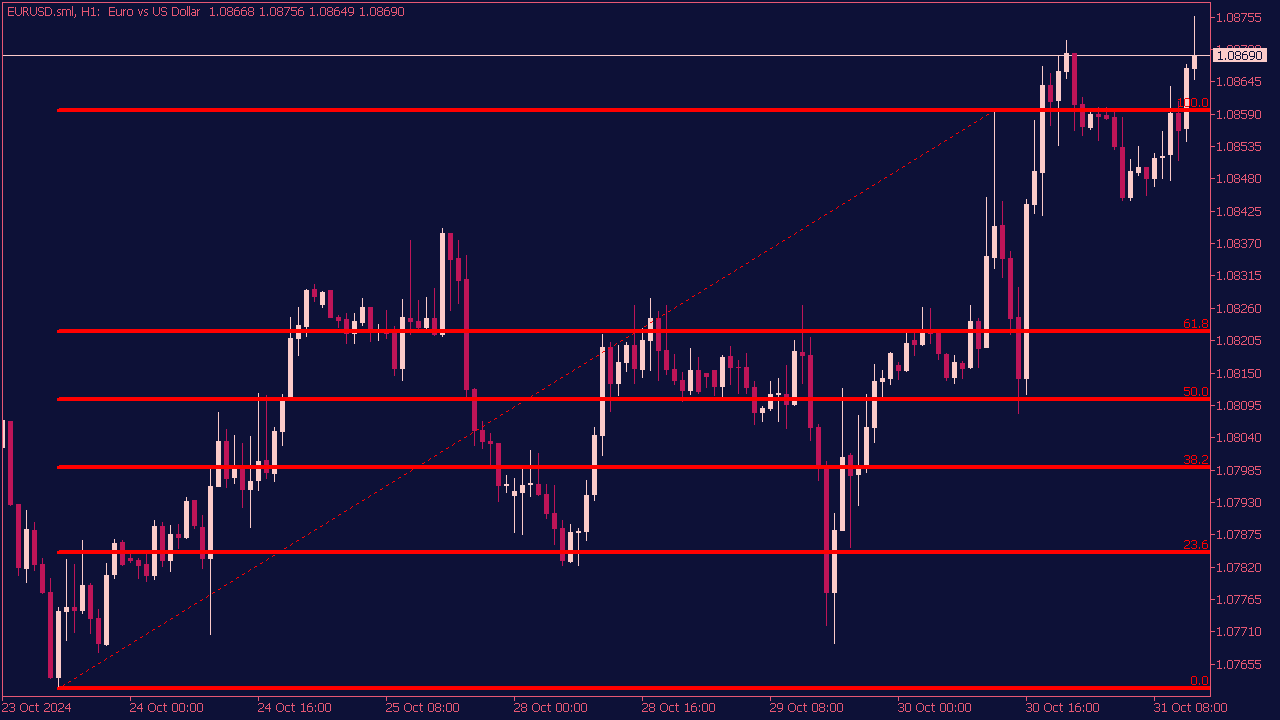
Auto Fibonacci Indicator
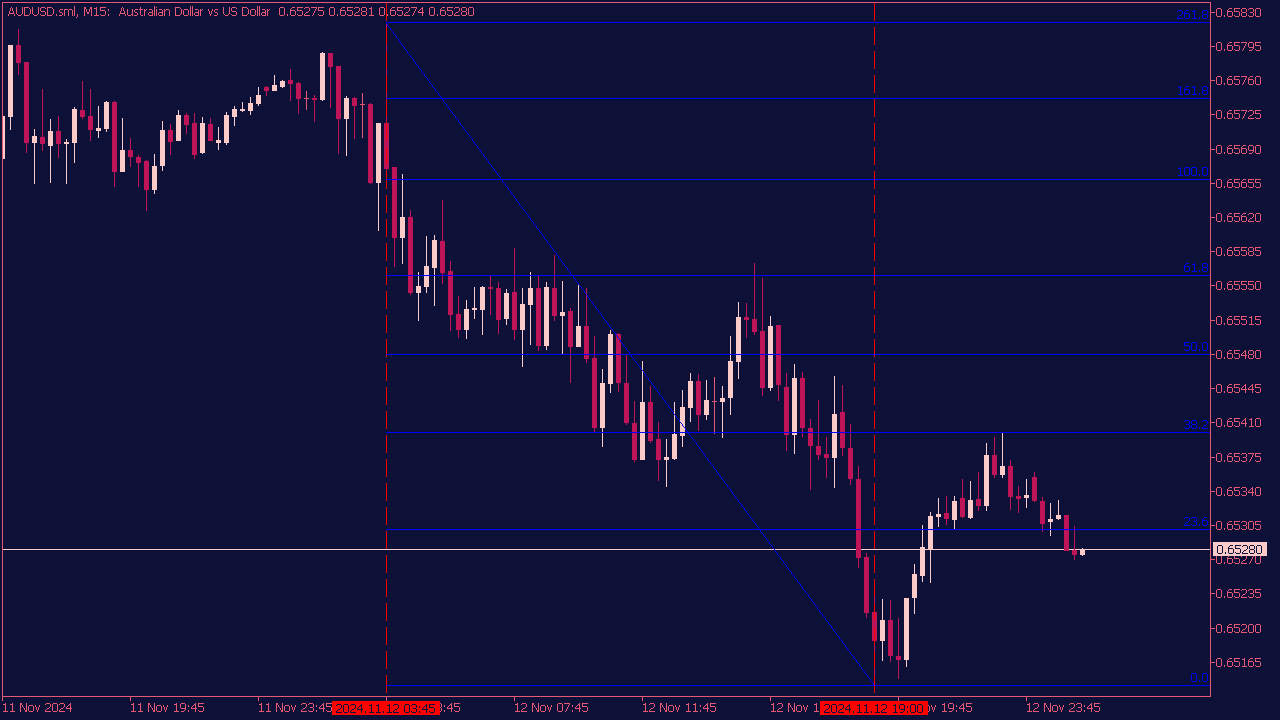
The Auto Fibonacci Indicator helps traders identify potential entry points by plotting Fibonacci retracement levels automatically based on the price action of a particular asset. Traders often look for entry signals when the price approaches key Fibonacci levels (such as 23.6%, 38.2%, 50%, 61.8%, and 78.6%) which may act as support or resistance. A common strategy is to enter a long position when the price bounces off a retracement level accompanied by bullish signals (like candlestick patterns or indicators) or a short position if it fails at a Fibonacci resistance level. Always consider incorporating additional technical analysis and risk management techniques for more effective trading.