Bollinger Fibo Bands Indicator


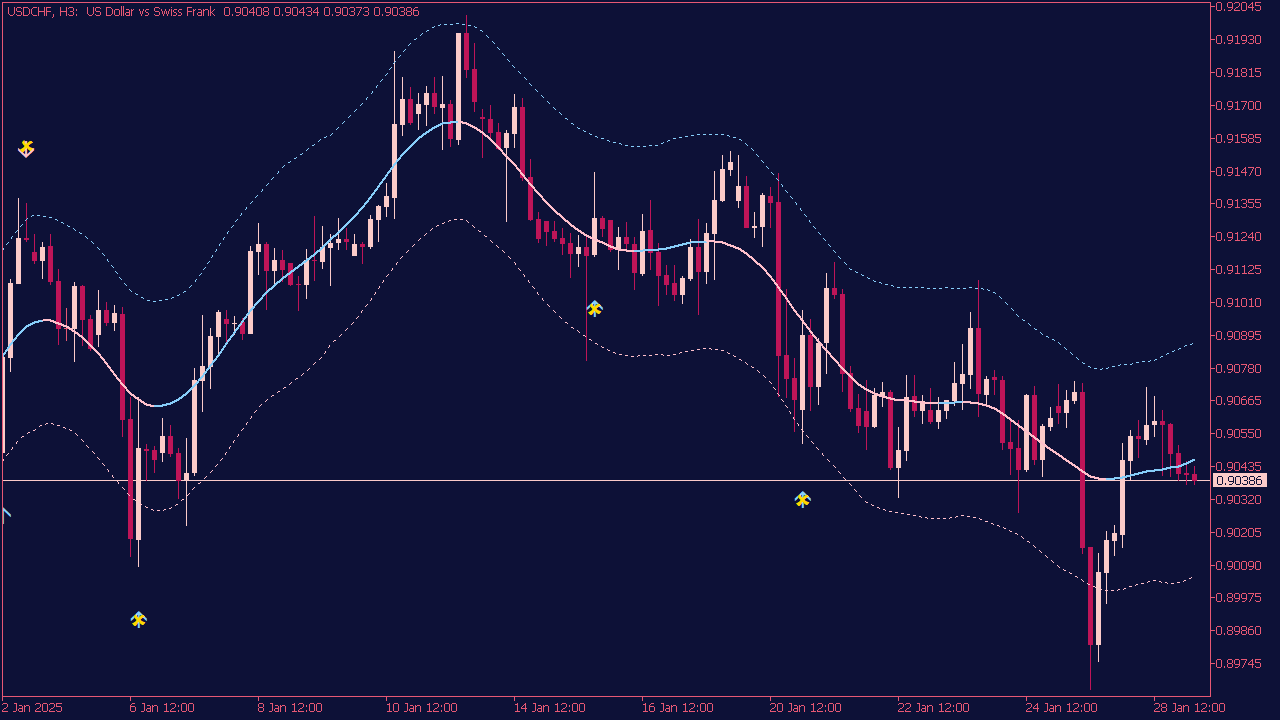
The Spike Detector Indicator identifies sudden, sharp price moves (spikes) that signal rapid market volatility or potential reversals. It highlights these events to help traders anticipate momentum shifts and adjust their strategies accordingly.
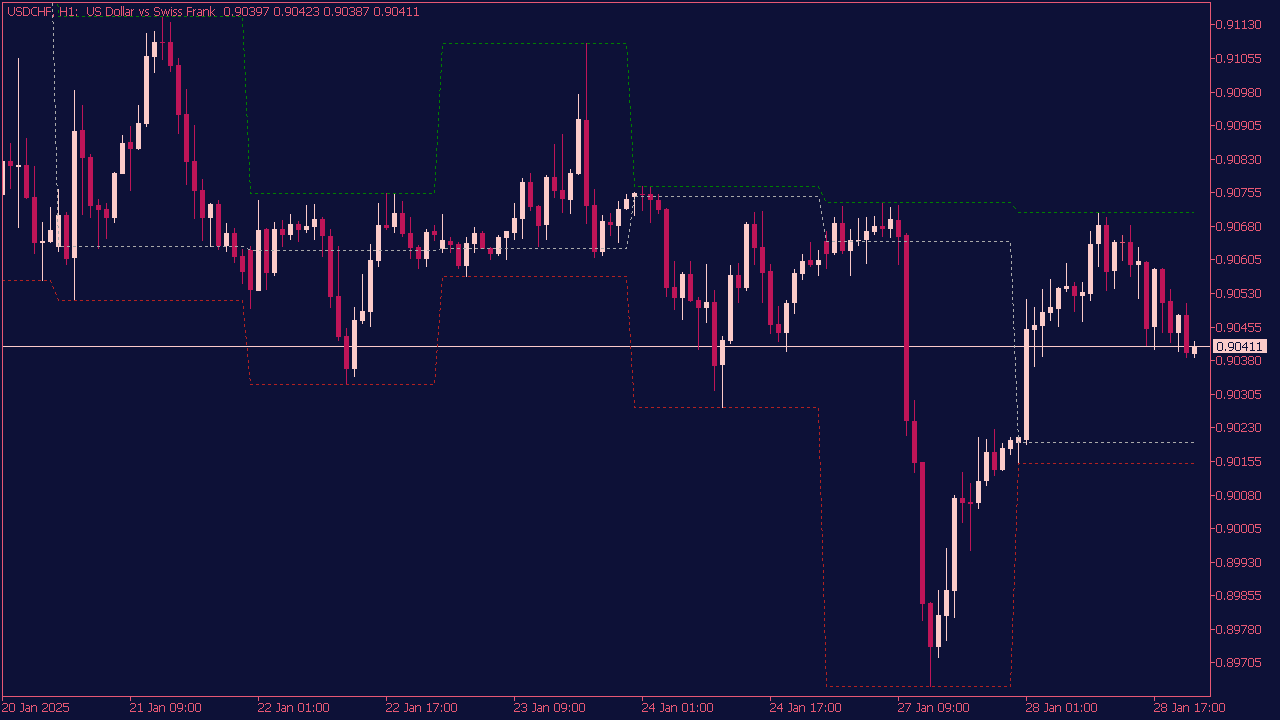
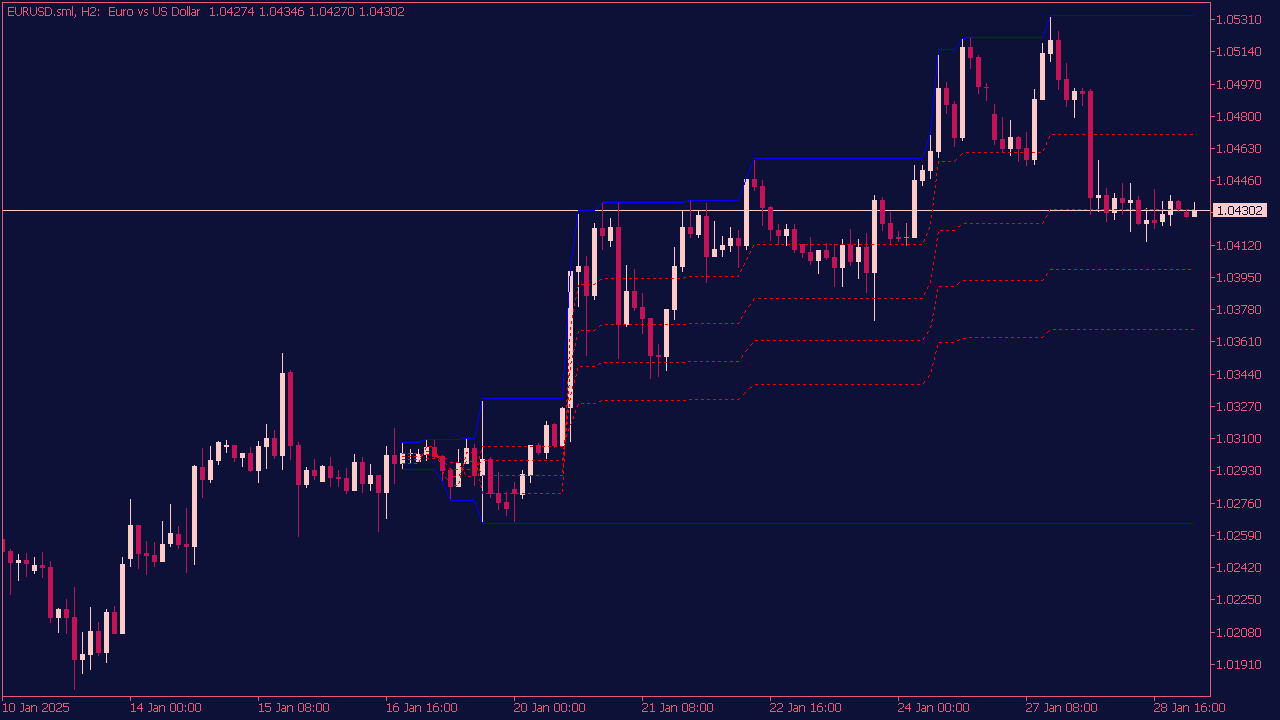
The Auto Fibonacci Channel Indicator is a useful tool for identifying potential support and resistance levels based on Fibonacci retracement levels. When trading with this indicator, consider the following tips: First, wait for the price to approach the Fibonacci levels, as these can act as entry or exit points. Look for confirmation signals, such as candlestick patterns or momentum indicators, before placing trades at these levels. Additionally, always set a stop-loss order to manage risk effectively, and consider using a trailing stop once in profit to maximize gains as the price moves in your favor. Finally, combine the indicator with other technical analysis tools to enhance your trading strategy.
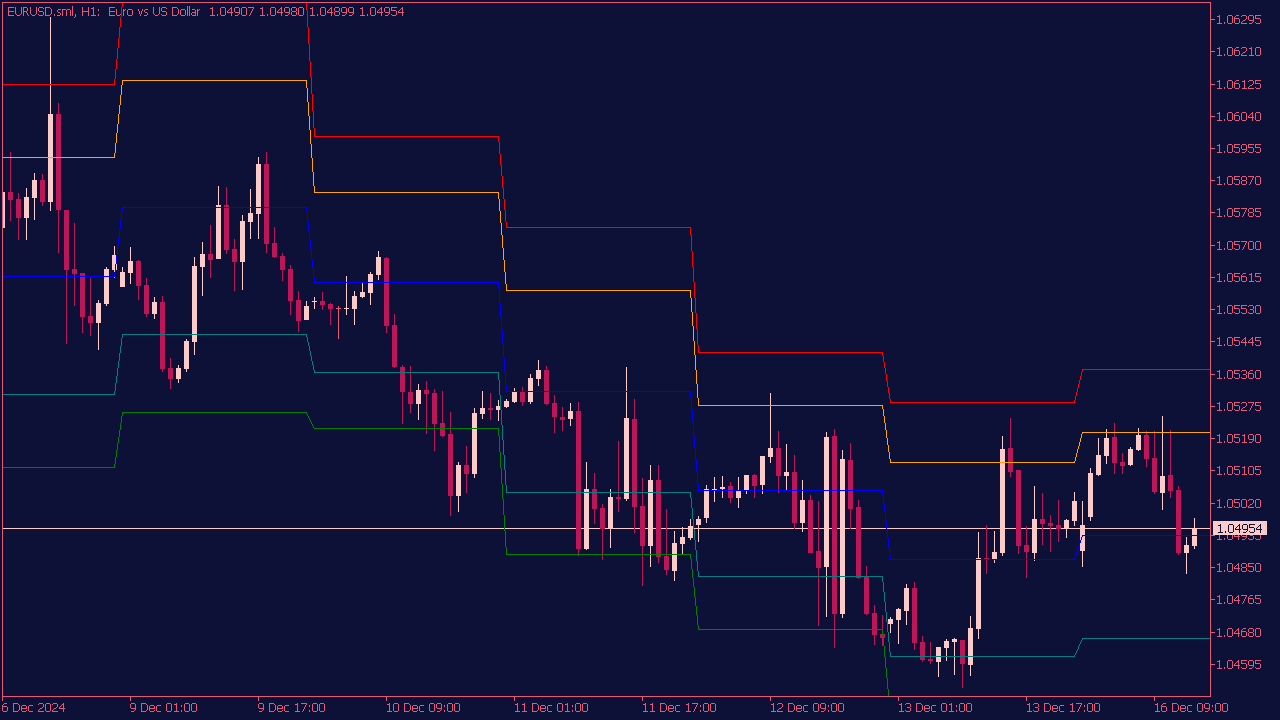
The Fibo Daily Channel Indicator is a technical analysis tool that uses Fibonacci retracement levels to identify potential support and resistance zones in a daily price chart. Traders typically look for buy signals when the price bounces off a key Fibonacci support level and sell signals when it approaches Fibonacci resistance levels. This indicator can help in making informed decisions by providing visual cues for entry and exit points based on market trends. Remember to combine it with other analysis techniques for more robust trading decisions.
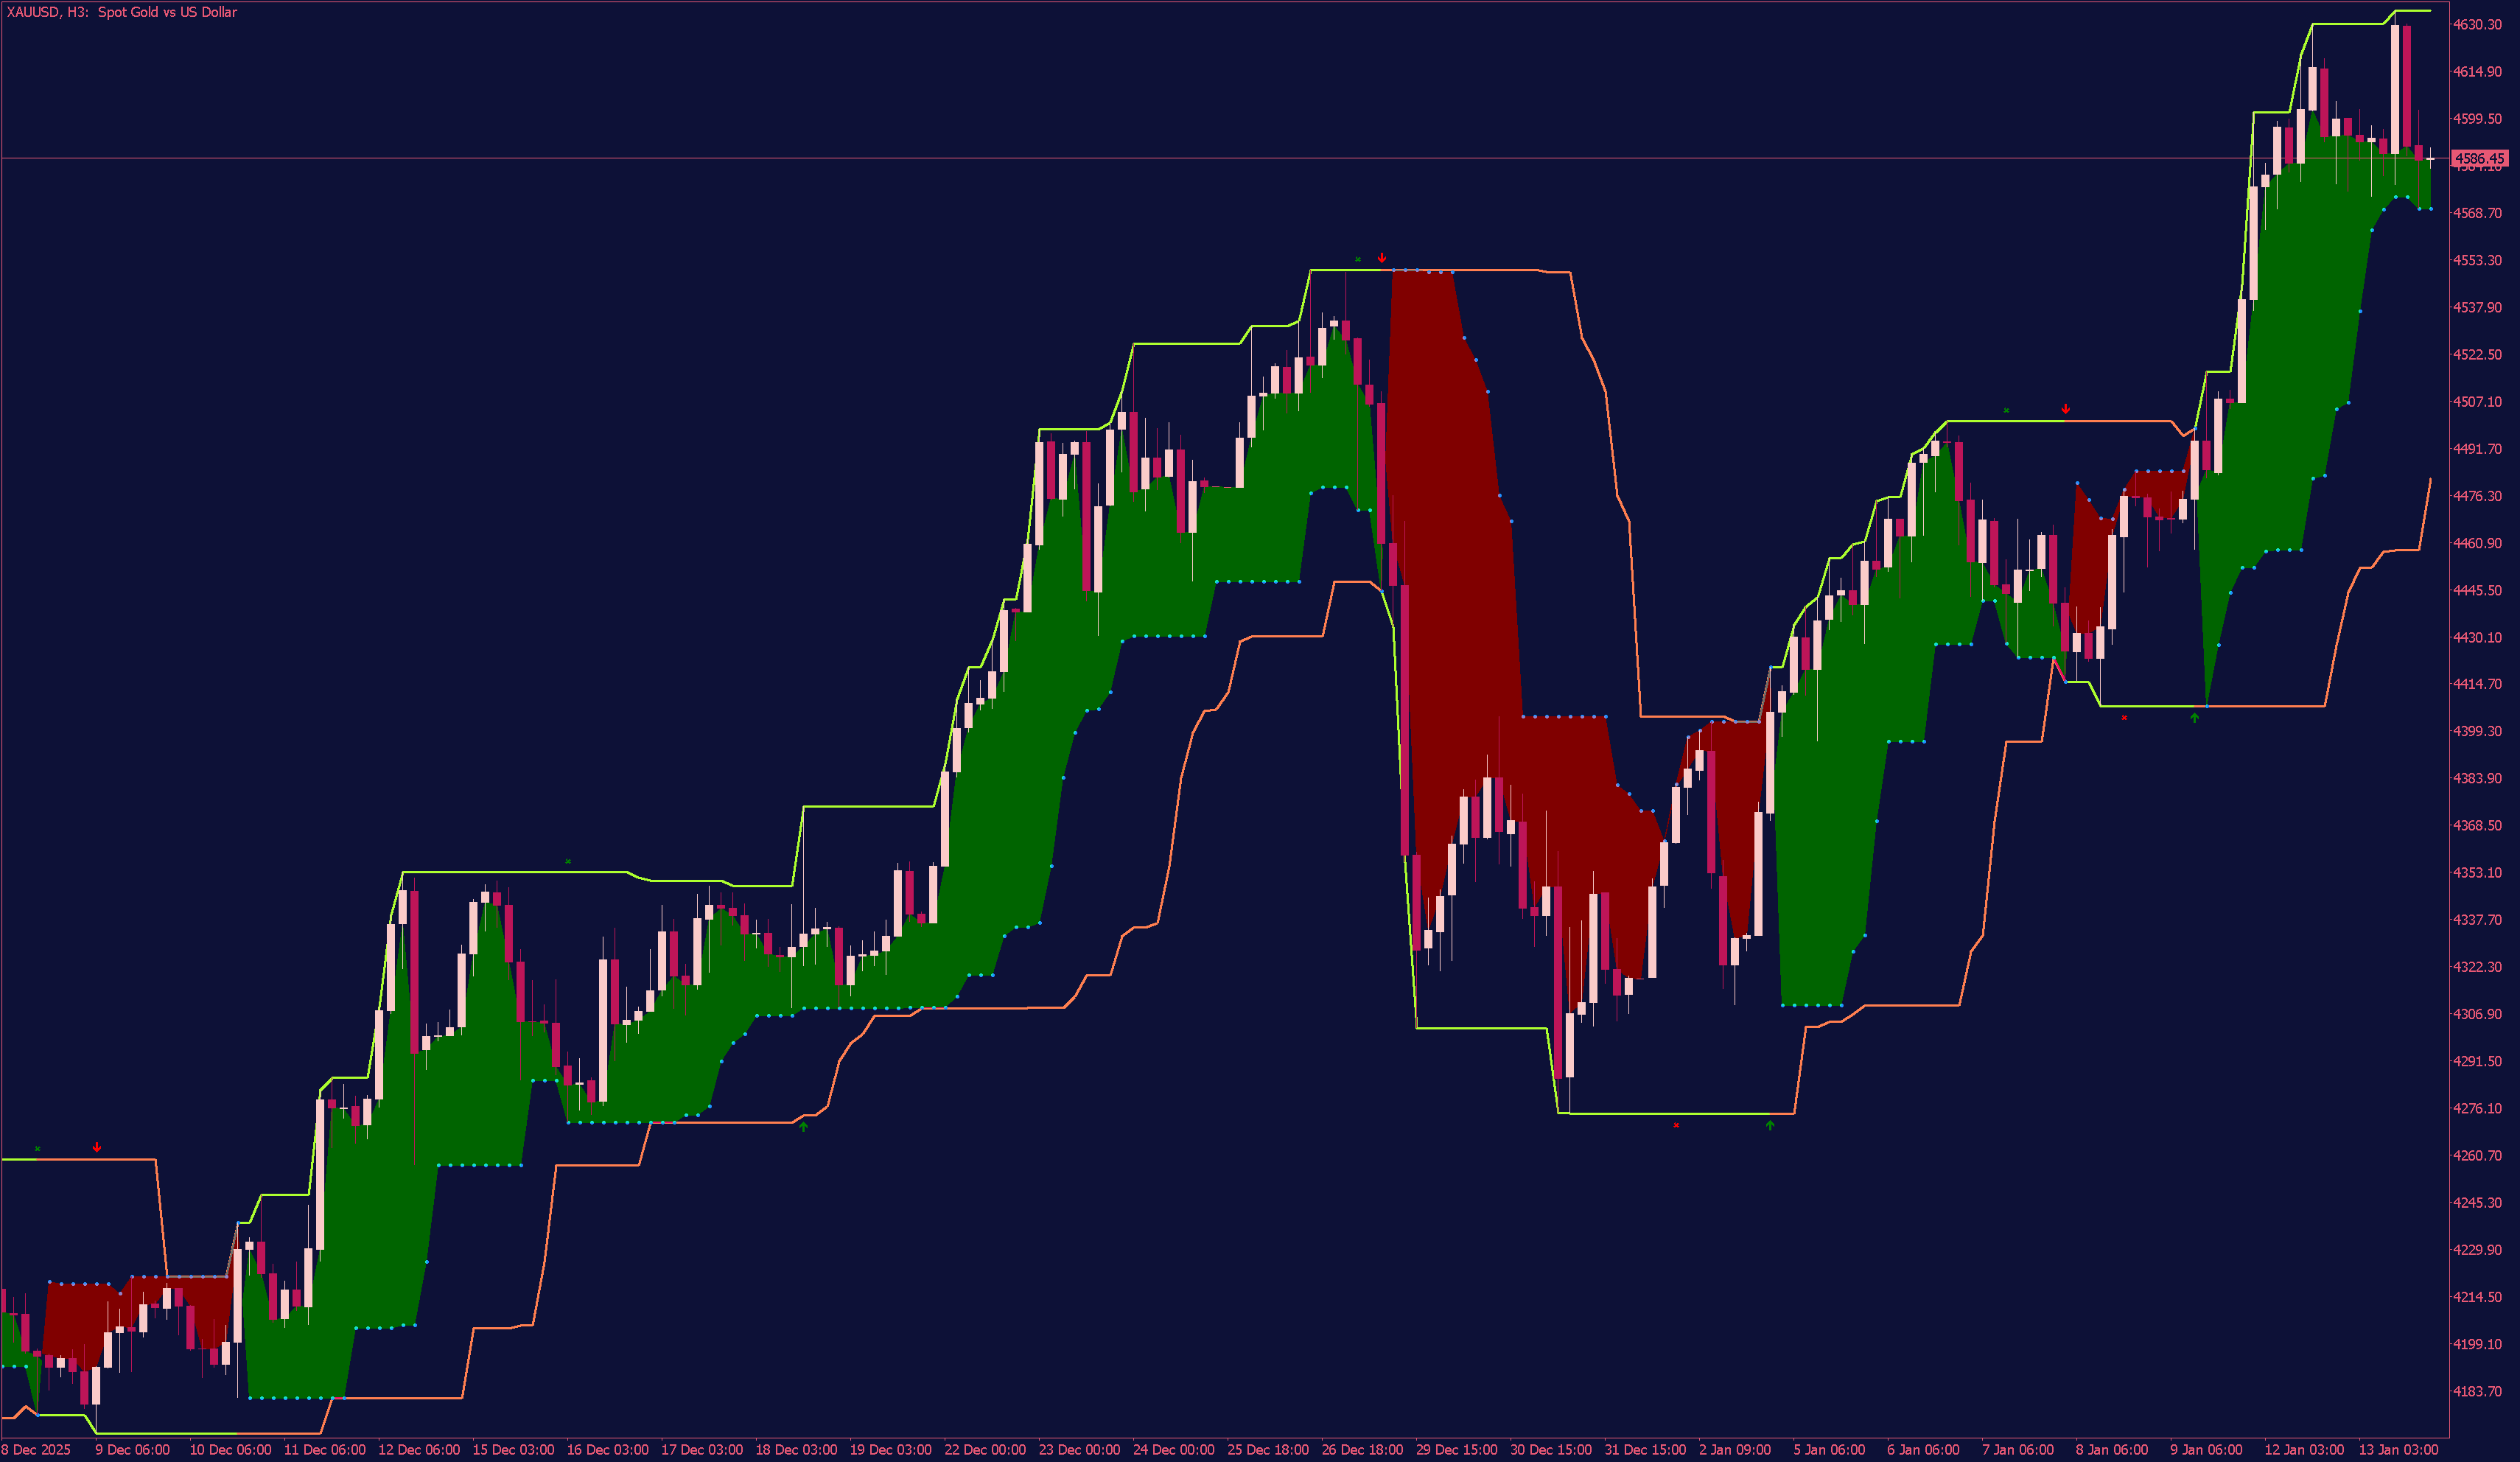
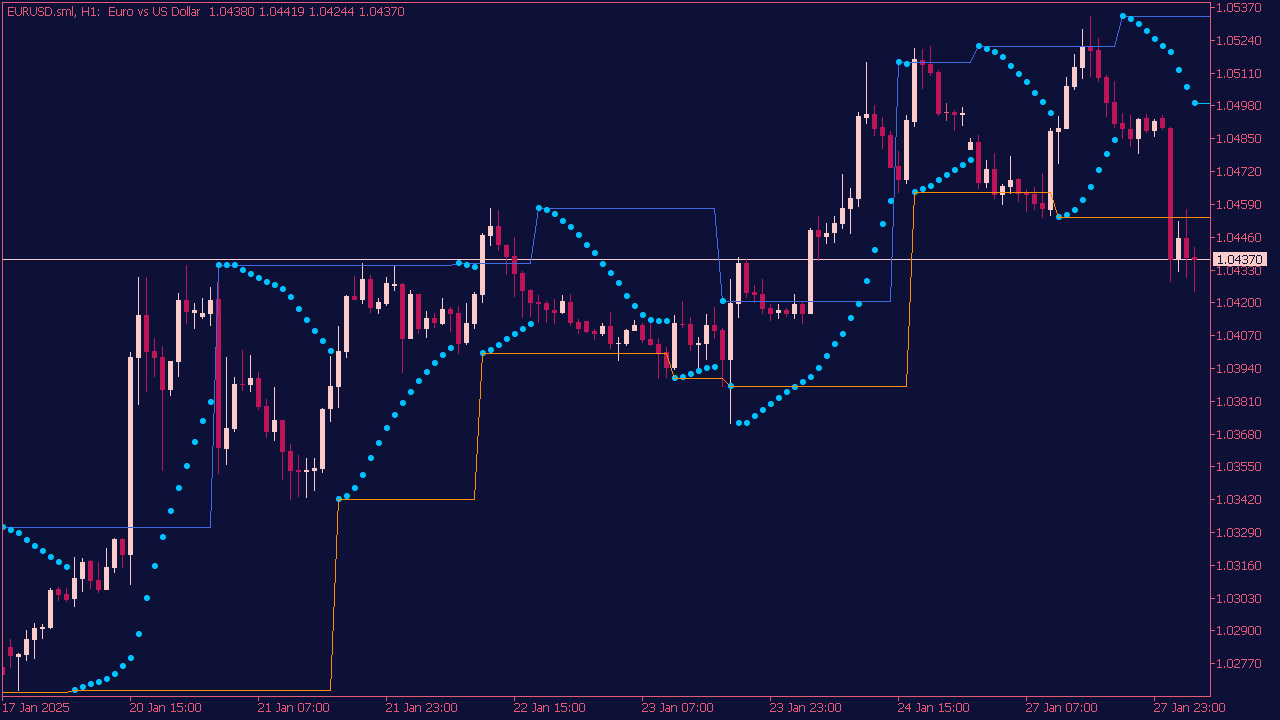
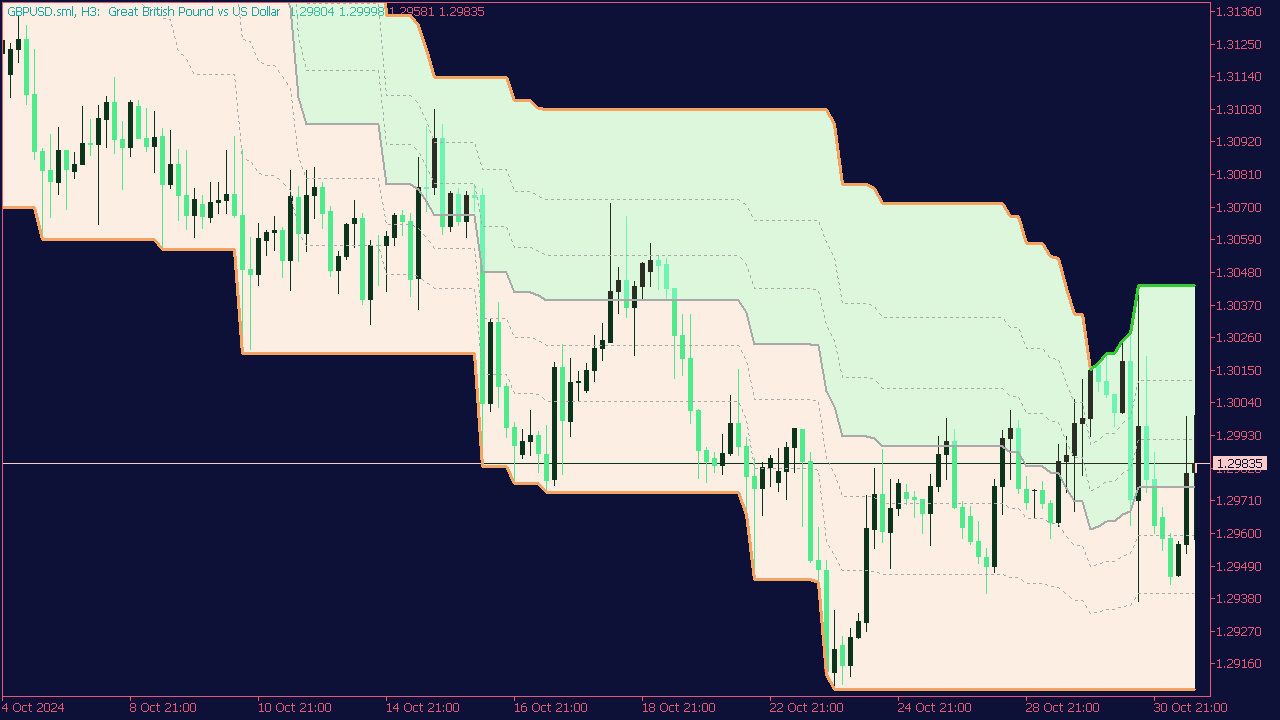
Richard Donchian, a pioneer in trend-following systems and the creator of Donchian Channels, significantly impacted trading despite achieving success later in life, demonstrating that age is no barrier in trading. His volatility indicator, based on recent highest and lowest prices over a defined period, is primarily utilized with a recommended period of 20 days, aligning with typical monthly trading patterns. Notably, variations like periods of 18 or 24 can yield valuable insights, while the Turtle trading system employed a 55-period strategy for market entries. Primarily used in breakout trading systems, Donchian Channels feature upper and lower border lines along with a center line to aid traders in navigating market trends and managing their risk.
The Price Channel Indicator is a technical analysis tool that helps traders identify potential buy and sell signals by defining upper and lower price boundaries over a specified period. When the price breaks above the upper channel line, it can signal a potential buy opportunity, indicating a bullish trend. Conversely, when the price falls below the lower channel line, it may suggest a sell opportunity, indicating a bearish trend. Traders often combine the Price Channel Indicator with other tools, such as moving averages or oscillators, to confirm signals and enhance their trading strategies.
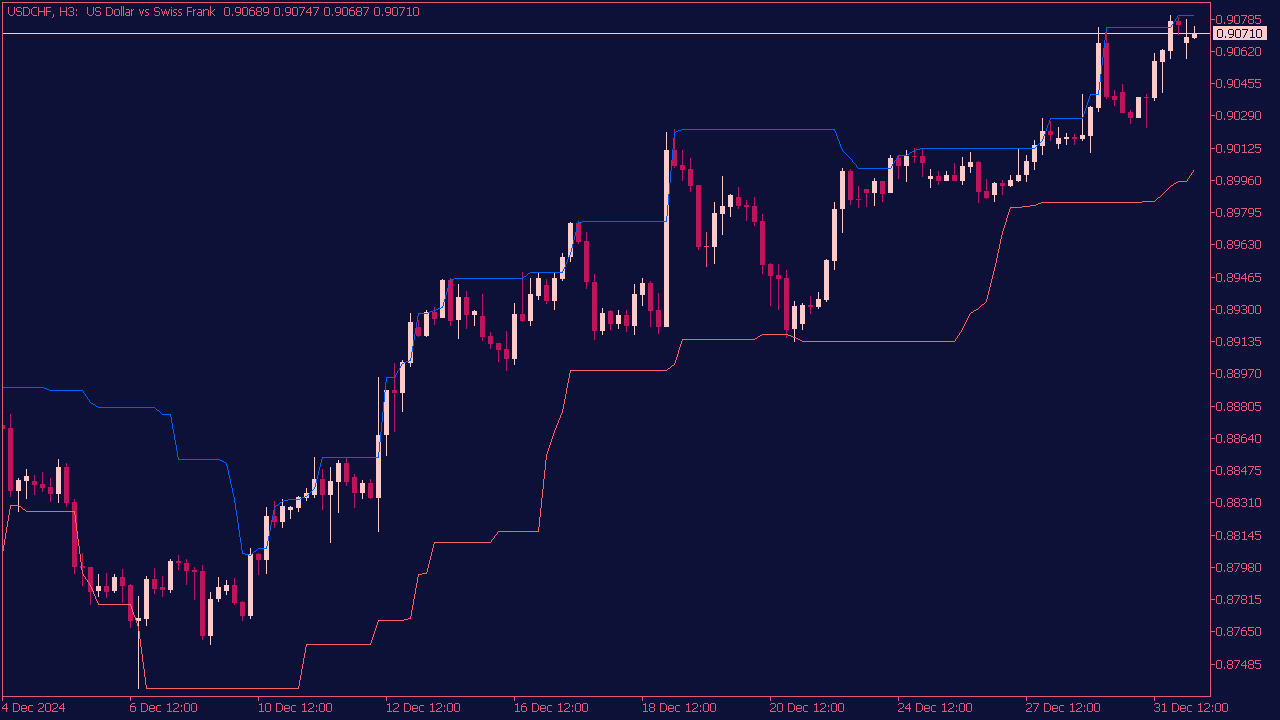
The Donchian Channel Indicator is used to identify potential entry points based on price trends and volatility. A common strategy for entering a trade is to buy when the price crosses above the upper channel line, indicating a possible breakout and upward momentum. Conversely, a sell signal can be identified when the price drops below the lower channel line, suggesting a potential downward trend. Traders often look to confirm these signals with additional indicators or volume analysis to improve the likelihood of successful trades. Additionally, setting stop-loss orders just outside the channel can help to manage risk.
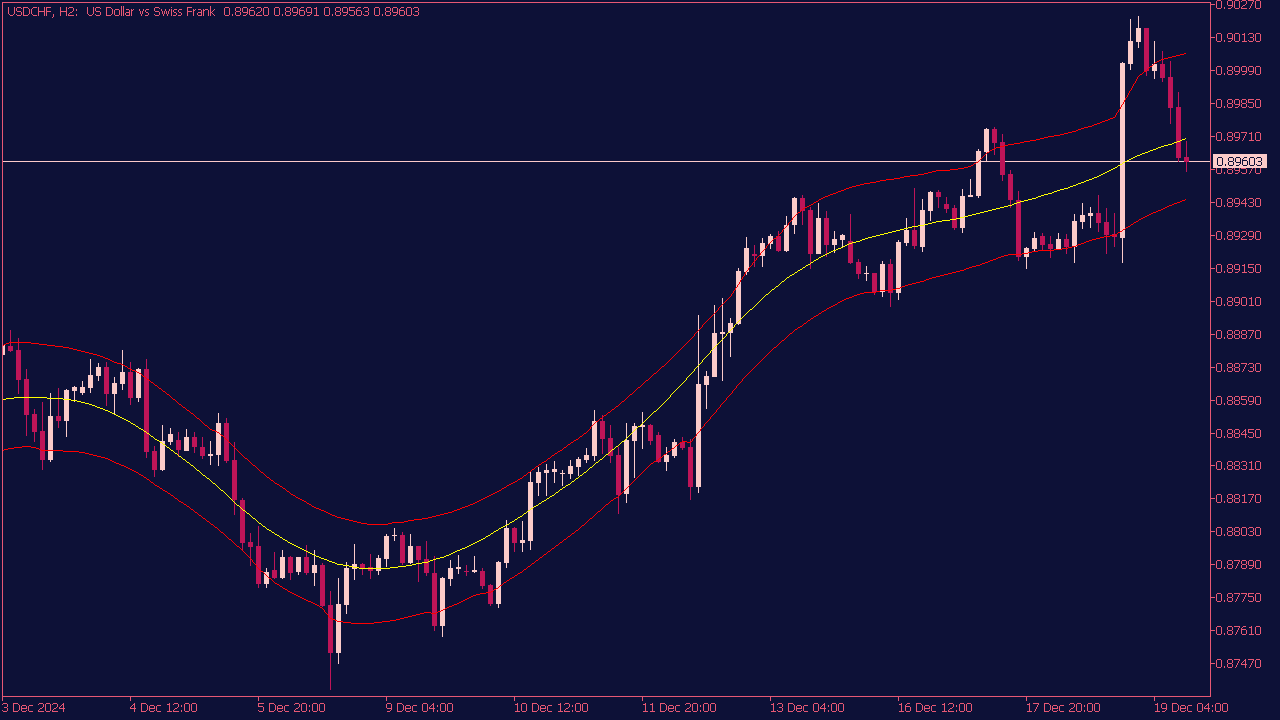
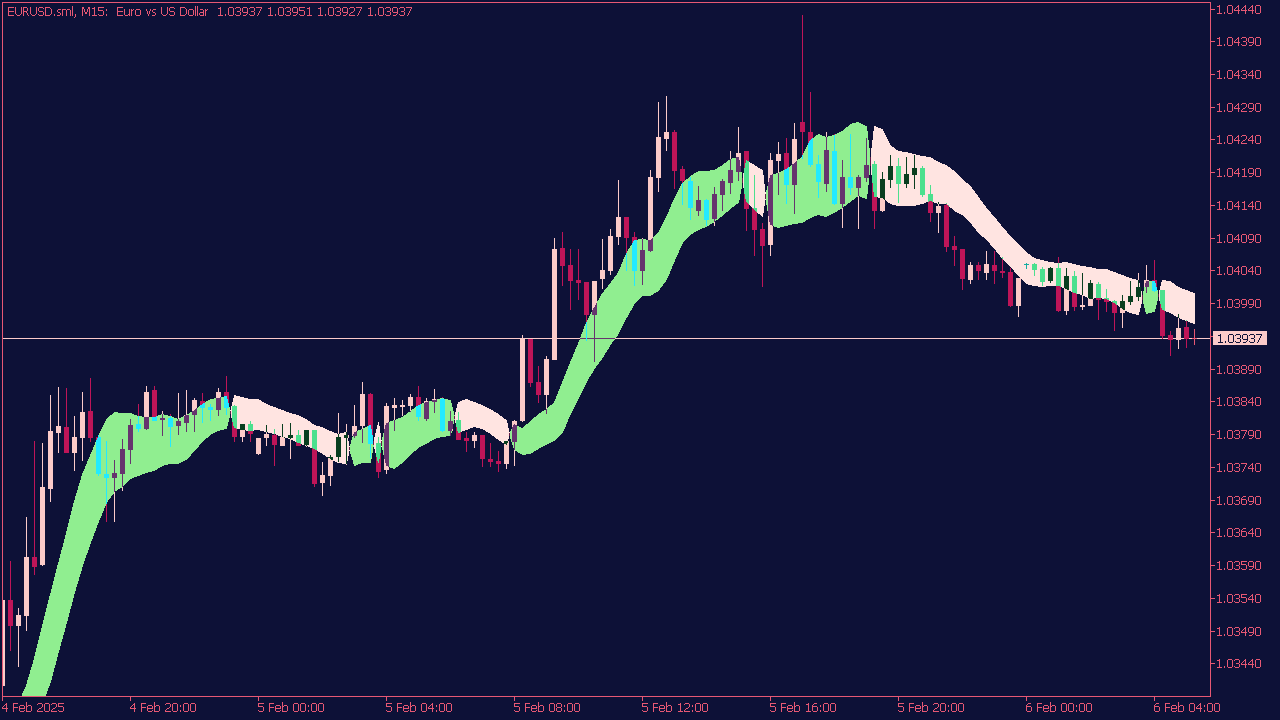
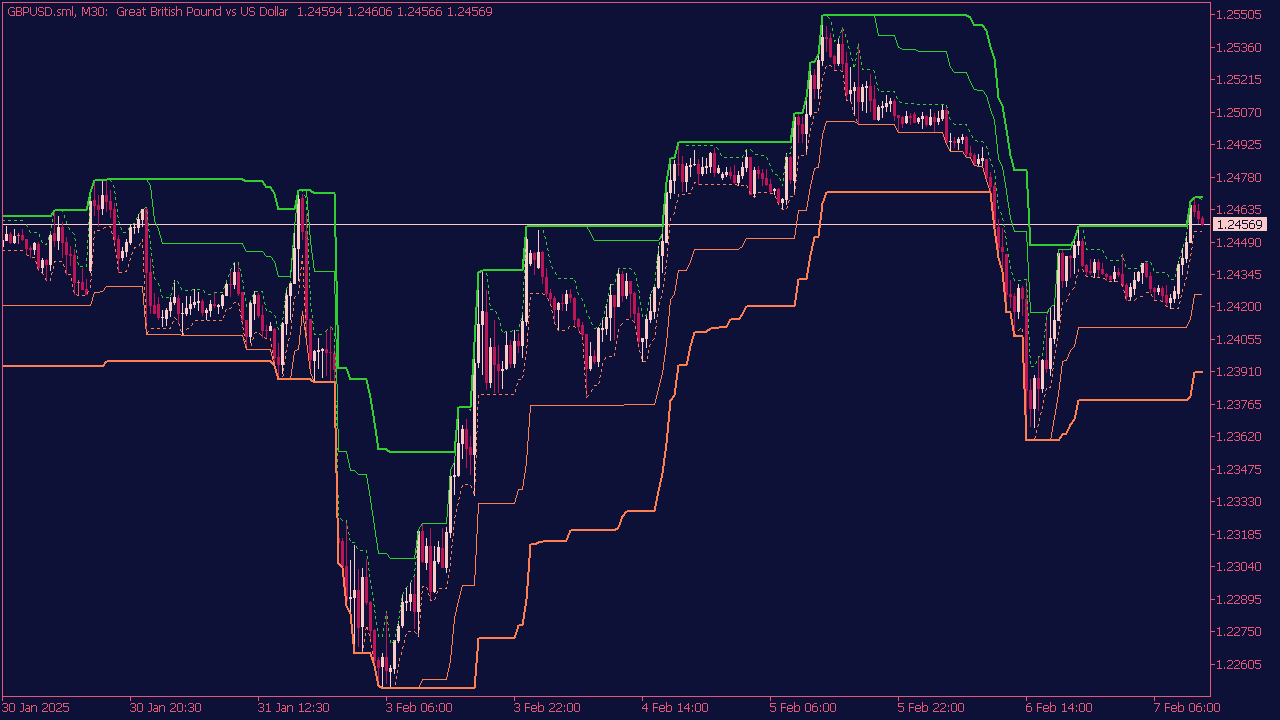
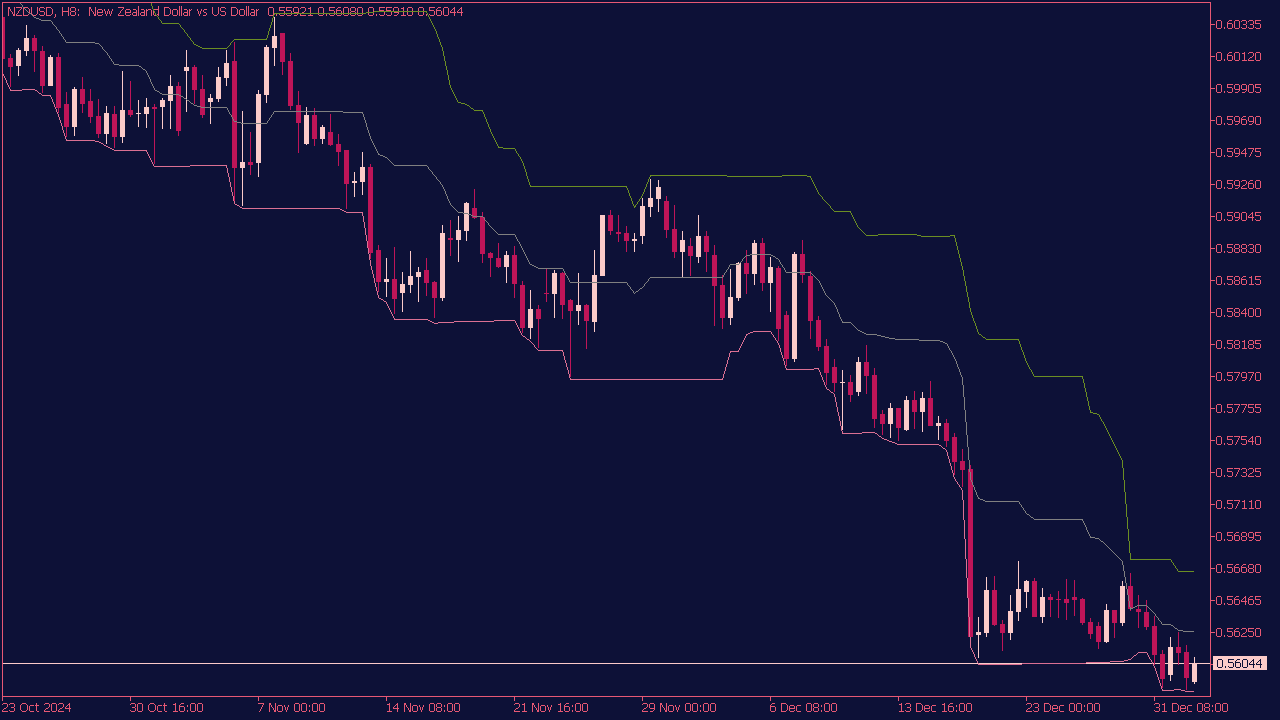
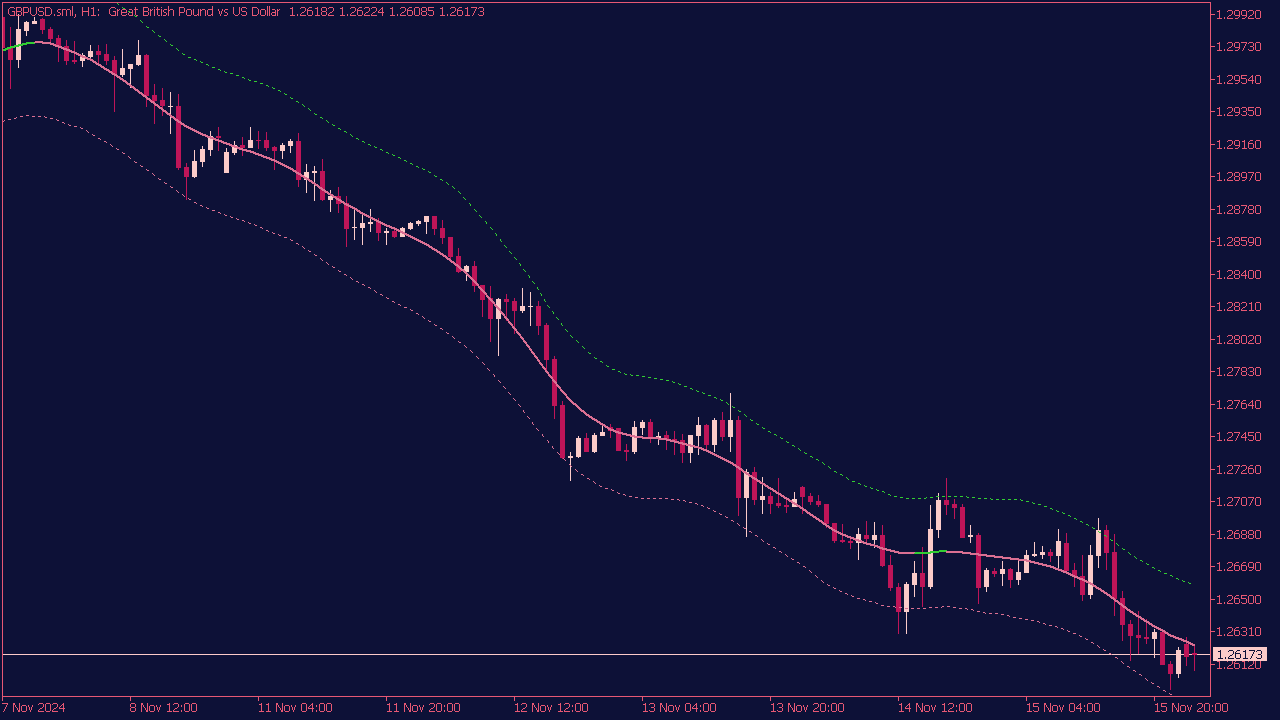
The TMA Bands indicator is a technical analysis tool that helps traders identify potential buy and sell signals based on price action and market volatility. It consists of a central TMA line, which smooths out price data, and upper and lower bands that indicate overbought and oversold conditions. A common strategy for using TMA Bands is to look for buy signals when the price touches or crosses below the lower band and rebounds back above it, indicating a potential upward reversal. Conversely, sell signals may be generated when the price touches or crosses above the upper band and then falls back below it, suggesting a potential downward reversal. As with any indicator, it's essential to use TMA Bands in conjunction with other analysis methods and risk management strategies for optimal trading results.
The Extreme TMA Line Indicator is a trading tool designed to help identify potential market reversals and entry/exit points. It utilizes a smoothed moving average to filter out market noise and highlight extreme market conditions. Traders typically look for signals when the price approaches the upper or lower TMA lines, considering overbought or oversold conditions. A bullish signal may arise when the price touches or bounces off the lower TMA line, while a bearish signal may be indicated when the price interacts with the upper TMA line. As with any indicator, it's essential to combine TMA signals with other analyses and risk management strategies to increase the likelihood of successful trades.
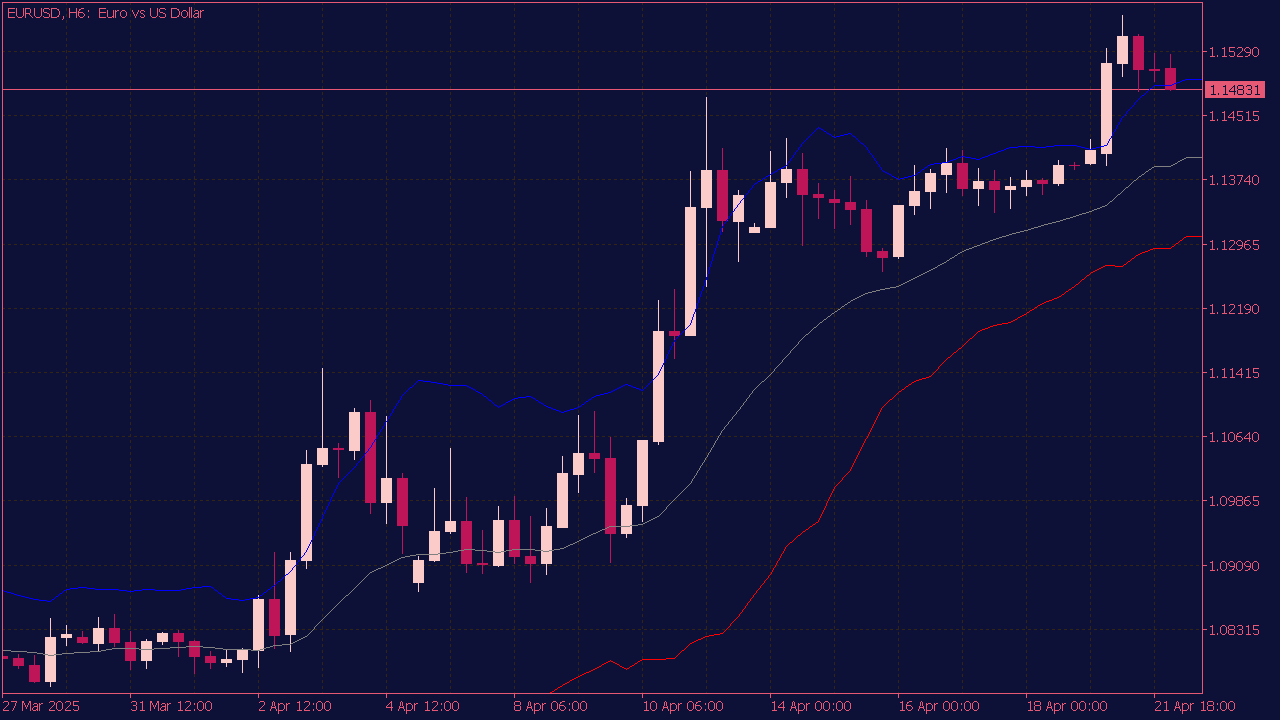
VWAP Bands Indicator uses the Volume Weighted Average Price as a central measure, with upper and lower bands typically set at standard deviations away from the VWAP. Entry levels for trades occur when the price touches or crosses these bands. For long positions, traders might consider entering when the price touches the lower VWAP band, while for short positions, an entry might be considered when the price reaches the upper VWAP band. It’s important to confirm these entries with other technical indicators or patterns for better risk management and validation of the trade signal.

The Multi ATR (Average True Range) Bands Indicator is a volatility-based tool that helps traders identify potential entry points by utilizing multiple bands calculated from the ATR, which measures market volatility. Entry points can be identified when the price action interacts with these bands: a potential buy signal may arise when the price touches or exceeds the lower ATR band, indicating a possible reversal or bounce, while a sell signal may occur when the price reaches or breaches the upper ATR band, suggesting a potential downturn. Additionally, traders can look for confluence with other indicators or patterns to confirm entry points and enhance trade reliability, ensuring adequate risk management is in place.

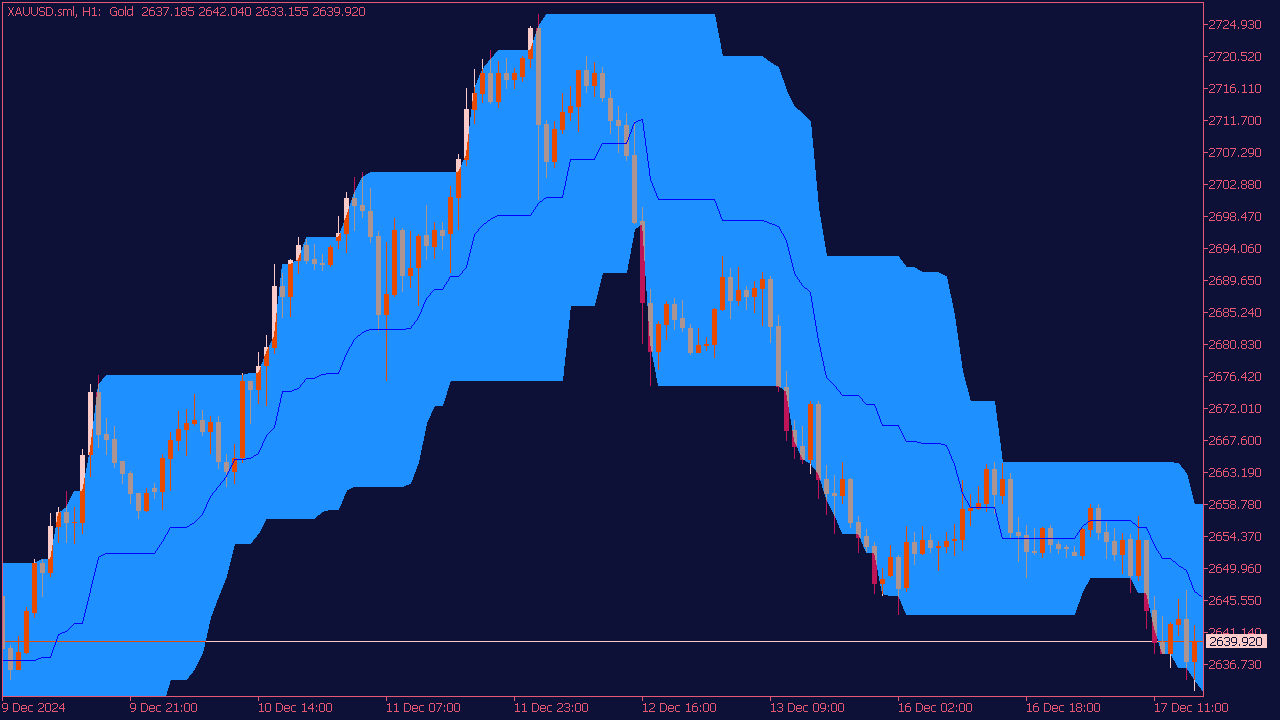
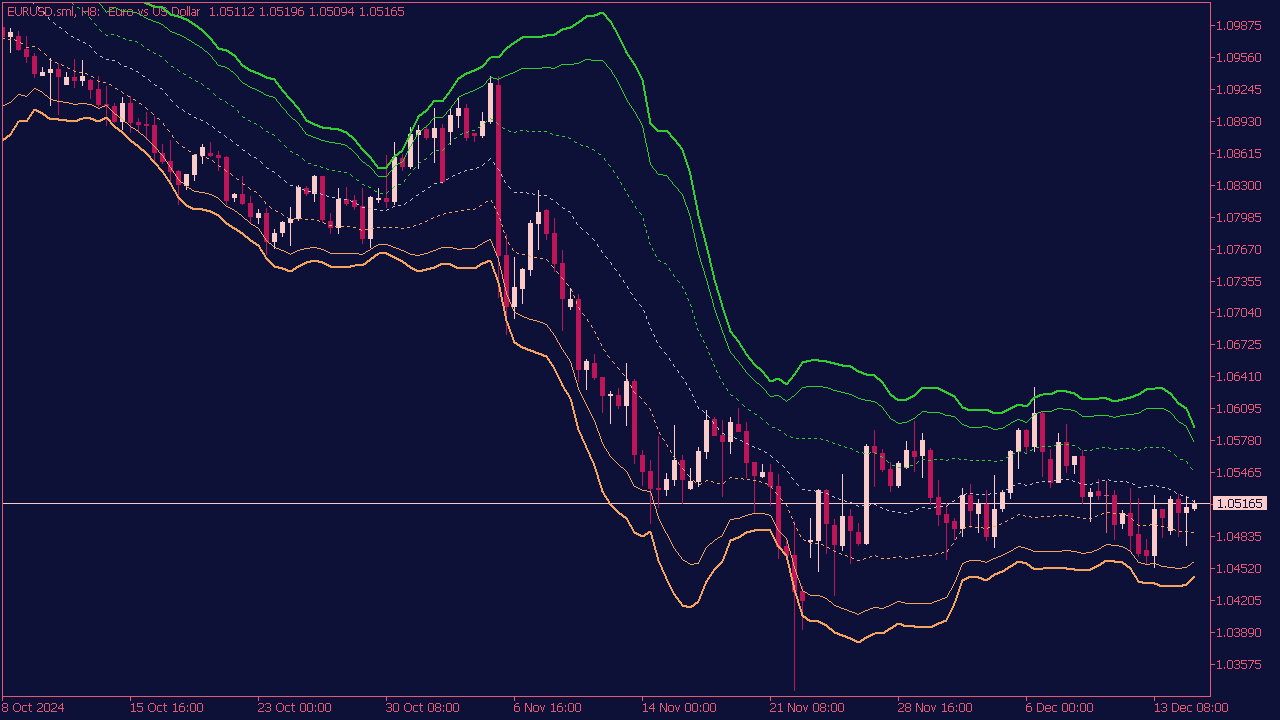
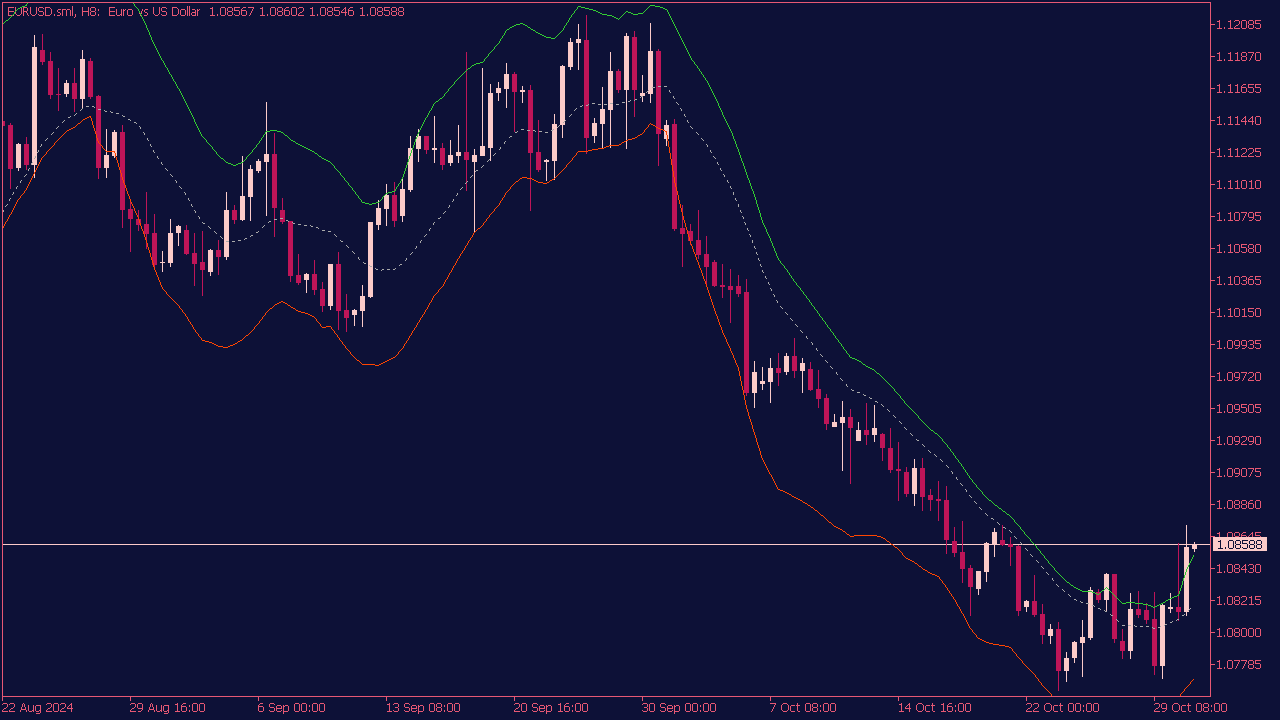
The Bollinger Bands Indicator with filled color is a variation of the standard Bollinger Bands, often enhanced with shading to visually represent the area between the upper and lower bands. Trading signals using this indicator can be generated based on price interactions with the bands: a buy signal occurs when the price touches or bounces off the lower band, particularly if accompanied by a shift in momentum or confirmation from other indicators, suggesting potential upward movement. Conversely, a sell signal may arise when the price hits or breaks through the upper band, indicating potential overbought conditions. Filled colors can help traders quickly assess the volatility range, with the area between the bands representing different market conditions, aiding in decision-making for entries or exits. Always combine these signals with sound risk management practices.
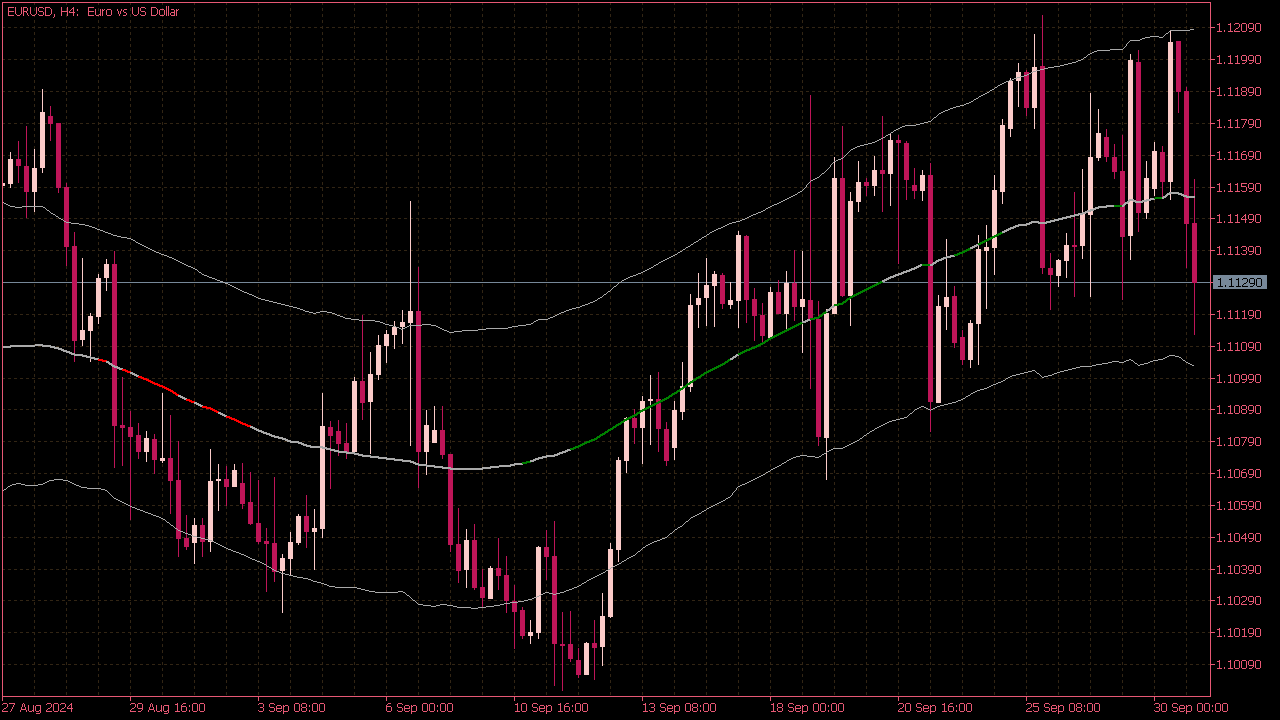
The TMA (Triangular Moving Average) Centered Bands Indicator is a technical analysis tool used in trading to identify potential buy and sell signals. It consists of a central TMA line and upper and lower bands that are equidistant from the central line based on a certain multiplier of the standard deviation. A buy signal is typically indicated when the price crosses above the upper band, while a sell signal occurs when the price drops below the lower band. Traders may also use the central TMA line for trend direction verification, where upward trends may suggest buying opportunities, and downward trends suggest selling opportunities. Always consider risk management and market conditions when utilizing this indicator.
The Asymmetric Bands Indicator (ABI) is a technical analysis tool used to identify market trends and potential reversal points. Trading rules based on the ABI typically involve entering a trade when the price closes outside of the upper or lower bands, suggesting a potential continuation or reversal. A buy signal may be generated when the price closes below the lower band and then reverses back above it, indicating potential upward momentum. Conversely, a sell signal may occur when the price closes above the upper band and then reverses back below it, indicating potential downward momentum. Traders should also consider using additional confirmation signals, like volume or other technical indicators, and always set stop-loss orders to manage risk effectively.