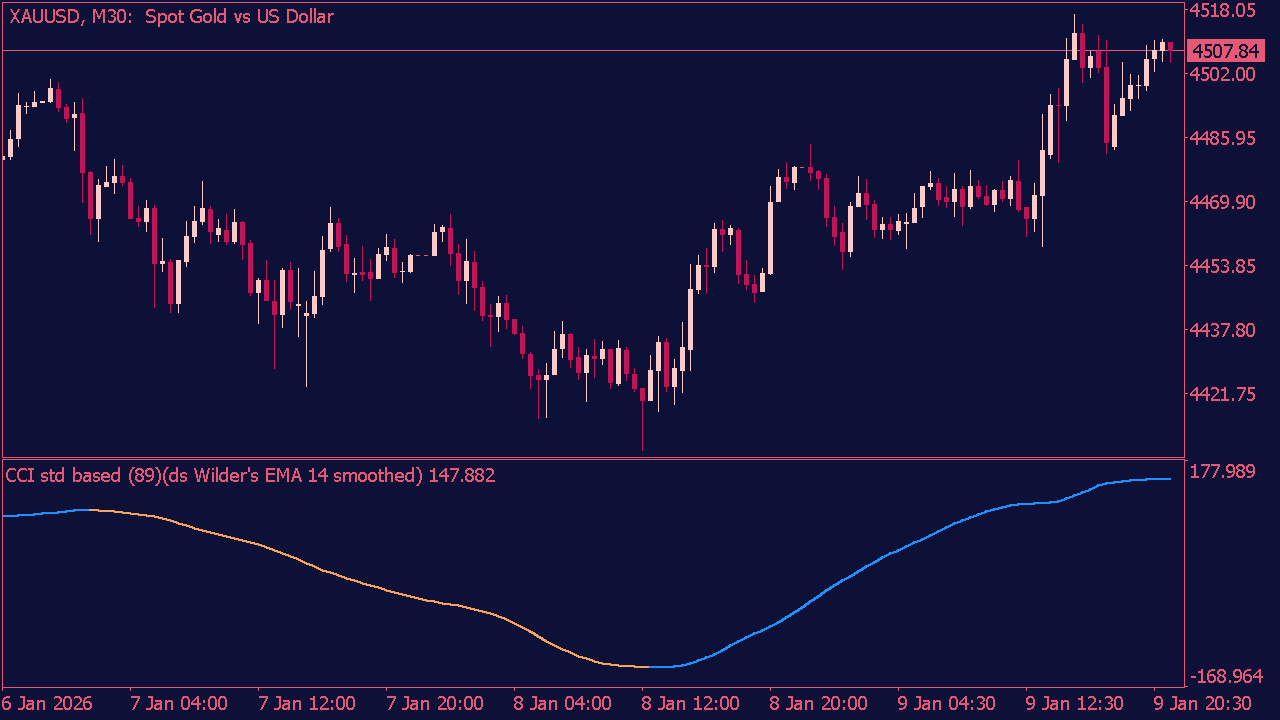
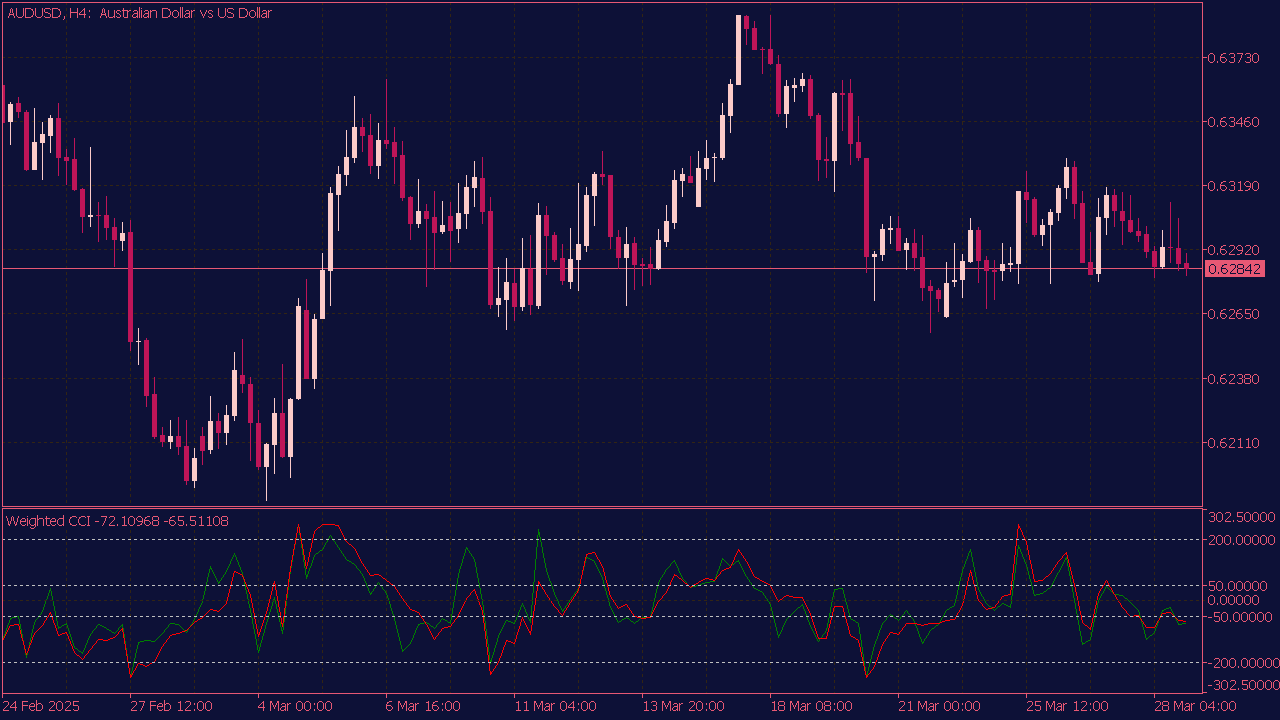
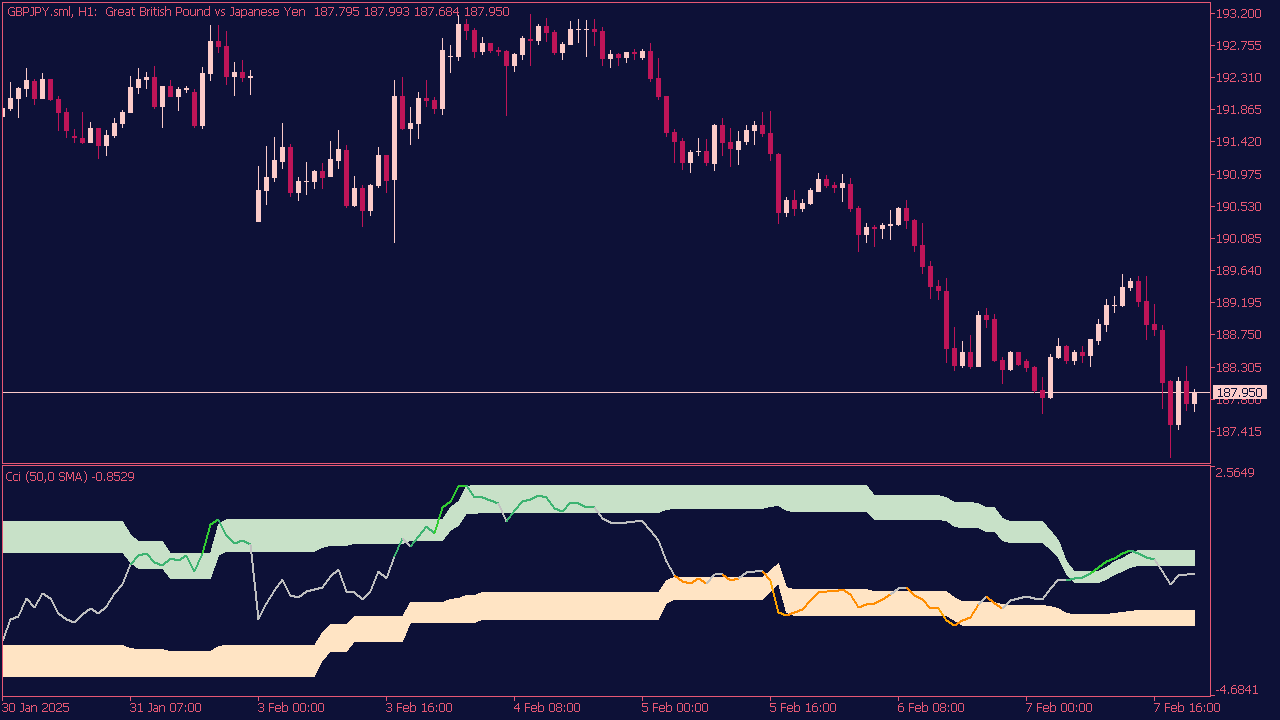
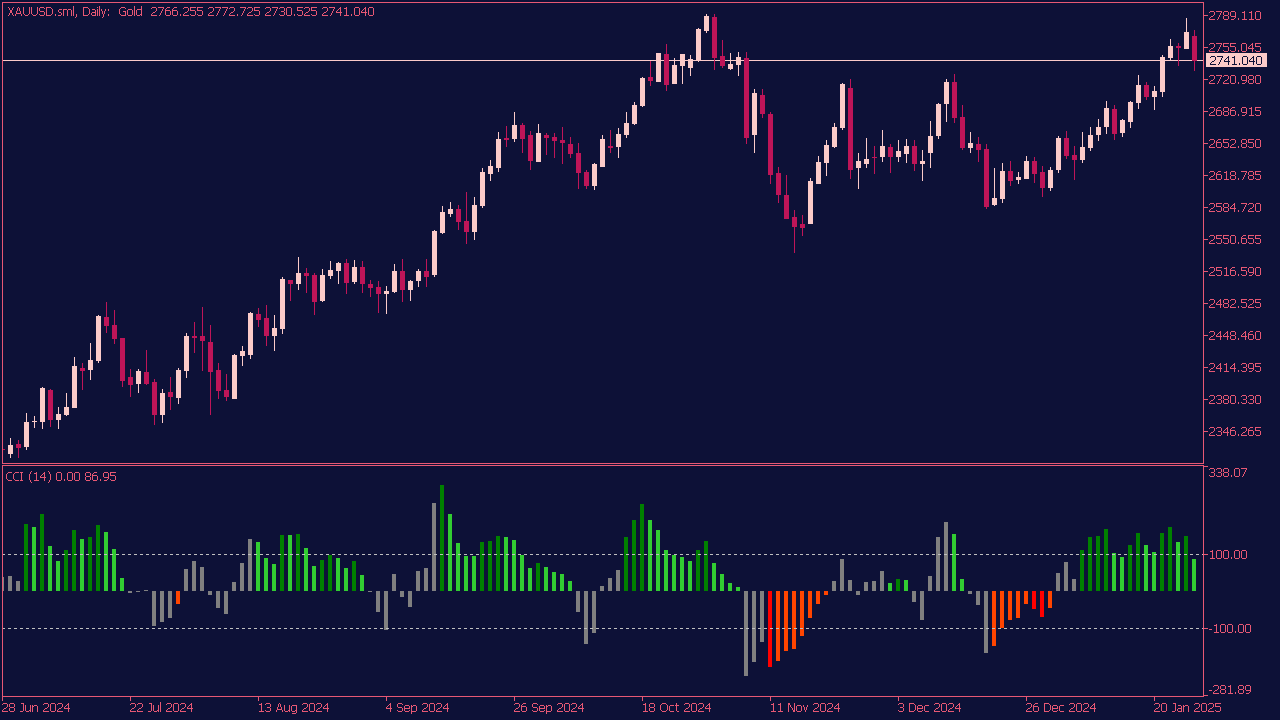
QQE of CCI Indicator
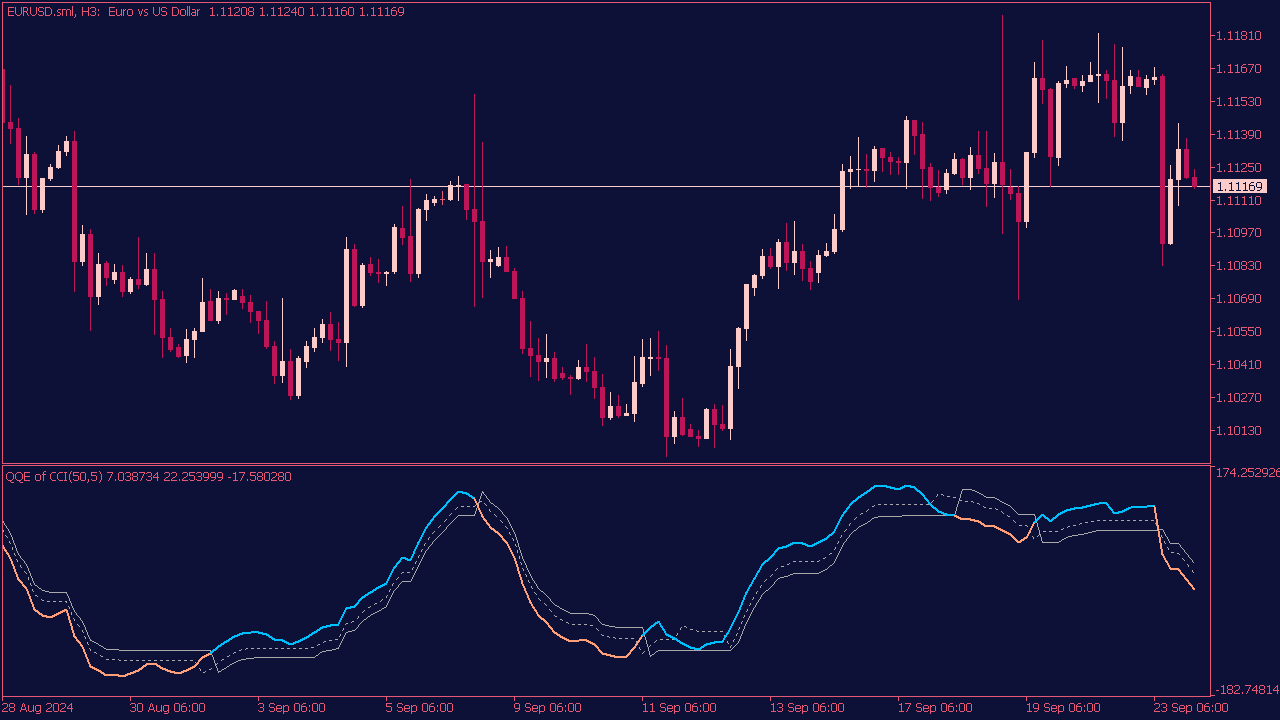
The QQE (Quantitative Qualitative Estimation) indicator, often used in conjunction with the CCI (Commodity Channel Index), offers a way to identify trends and potential reversals in price movement. For a typical trade setup, traders generally look for QQE crossover signals: buy when the QQE line crosses above a certain threshold while the CCI is above +100 or trending upwards, and sell when the QQE crosses below a threshold while the CCI falls below -100 or trends downwards. Additionally, using a combination of both the QQE and CCI can help in filtering out false signals by confirming strength and momentum, enhancing the overall effectiveness of entries and exits in trading strategy.