MT5 DXY, Choppiness, Force, Glitch or Money Flow Index Indicators

MT5 DXY, Choppiness, Force, Glitch or Money Flow Index Indicators

by Specialist 🫡 -
Number of replies: 13

Didi Index Indicator

Didi Index Indicator for MT5

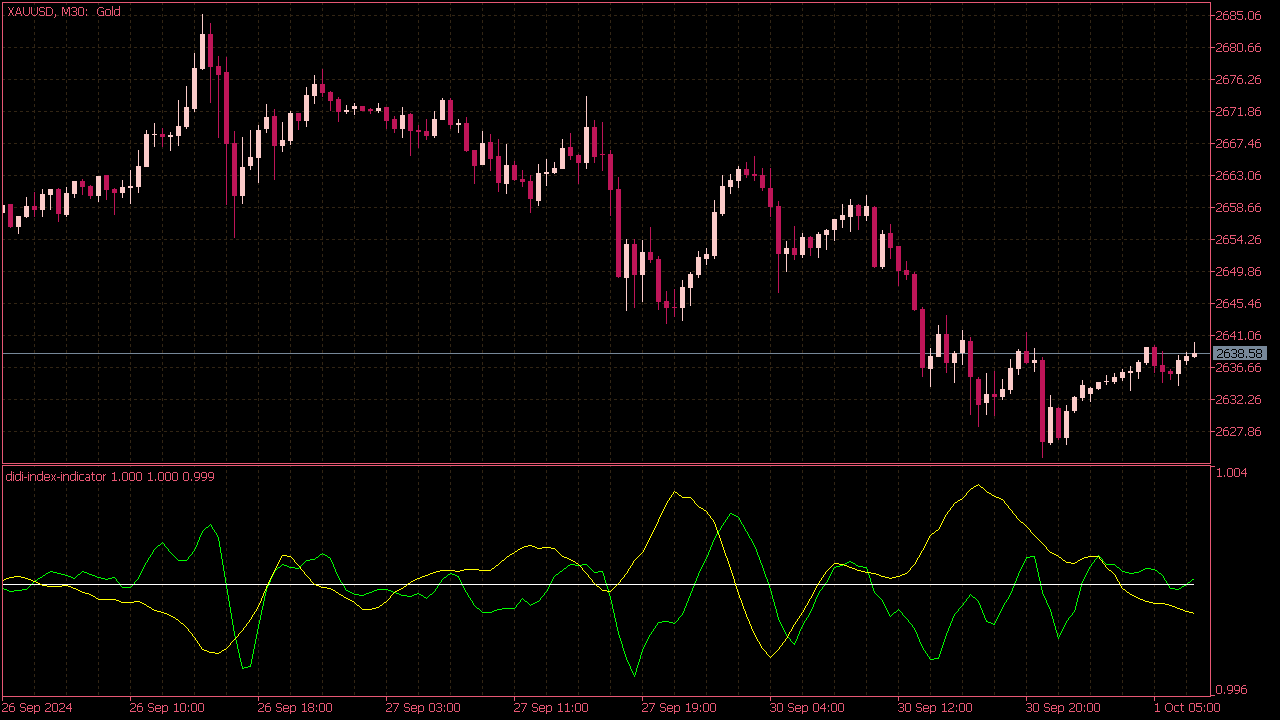
The Didi Index Indicator consists of two lines that help traders identify market trends and potential entry or exit points. To use it, observe the two lines: the first line is typically a short-term average (often a 3-period moving average), and the second is a longer-term average (commonly a 6-period moving average). When the short-term line crosses above the long-term line, it may signal a bullish trend, suggesting a potential buy opportunity. Conversely, when the short-term line crosses below the long-term line, it may indicate a bearish trend, signaling a potential sell opportunity. Always consider using additional confirmation tools for more reliable trading decisions.

Index Indicators for MT5

by Specialist 🫡 -

Blau Ergodic True Strength Index

Blau Ergodic True Strength Index for MT5

The Blau Ergodic True Strength Index (TSI) Indicator is a modified version of the traditional TSI indicator, incorporating additional features. Specifically, it includes a double smoothed momentum formula with one smoothing fixed at five price bars and a further Exponential Moving Average (EMA) smoothing, creating its signal line. This indicator also recognizes if it's operating under "Ergodic" or "regular" TSI settings and comes with three coloring modes to aid decision-making, providing potential signals through signal line crosses, zero line crosses, and changes in TSI line slope direction.

Index Indicators for MT5

by Specialist 🫡 -

Glitch Index Indicator

Glitch Index Indicator for MT5

The Glitch Index Indicator is a trading system designed to capitalize on minor price deviations from a detrended 30-period Simple Moving Average (SMA), established by calculating the percentage difference between the closing price and a modified SMA (Glitch Index). The strategy initiates long positions when the Glitch Index falls below -2, provided the highest Glitch Index within the past 30 bars does not exceed +5, thereby avoiding entry after significant overbought conditions. Exits are triggered when the Glitch Index rises above +2, and trades are sized at 6% of the account equity, with specific color-coded bars indicating trading conditions: light green bars signal restricted long trades, while dark red bars indicate the ideal buy zone.

Index Indicators for MT5

by Specialist 🫡 -

Composite Index Indicator

Composite Index Indicator for MT5

The Composite Index Indicator improves upon the RSI by addressing divergence failures and providing specific horizontal support levels. It achieves this by using the normalized RSI formula without normalization range restrictions, incorporating an embedded momentum calculation, and smoothing a short-term RSI. This combination aims to offer more reliable and detailed insights for traders.

Index Indicators for MT5

by Specialist 🫡 -

Choppiness Index Indicator

Choppiness Index Indicator for MT5

The Choppiness Index Indicator, inspired by Benoit Mandelbrot's fractal geometry, was created by E.W. Dreiss to measure price movement in financial securities. Fractals, with their fractional dimensions, allow for the assignment of a "dimension" to a price chart, where a trending chart would have a dimension of 1 and a choppy chart would have a dimension of 2. The indicator uses this concept to quantify the degree of choppiness in price action, offering traders insights into market trends.

Index Indicators for MT5

by Specialist 🫡 -

Traders Dynamic Index V2 Indicator

Traders Dynamic Index V2 Indicator for MT5

The Traders Dynamic Index indicator is an advanced trading tool that integrates multiple indicators, including the RSI, Bollinger Bands, and Moving Averages, to analyze market dynamics effectively. Created by Dean Malone, it consists of five lines: VBHigh and VBLow representing the Bollinger Bands trading channel, with a main yellow line indicating market trends. The RSI aspect provides insights into overbought or oversold conditions, while the crossover between the Fast (Green) and Slow (Red) RSI lines signals potential short-term trading opportunities. By utilizing this comprehensive indicator, traders can tailor strategies to individual instruments, leveraging both entry and exit signals to enhance their market approach.

Index Indicators for MT5

by Specialist 🫡 -

Disparity Index Indicator

Disparity Index Indicator for MT5

The Disparity Index Indicator identifies high and low price levels in the market, suggesting that candlestick reversal patterns should only be sought at these extremes. When the histogram displays blue bars exceeding a dynamic overbought threshold, traders should look for bearish reversal patterns, while red bars below the oversold threshold signal potential bullish reversals. These thresholds are dynamically calculated based on the percentage changes in price over a specified period, allowing traders to adjust to market behavior. Additionally, while the index can indicate trends (increasing for bullish, decreasing for bearish), it also facilitates divergence trading when price action contrasts with the index's movement.

Index Indicators for MT5

by Specialist 🫡 -

Traders Dynamic Index Indicator

Traders Dynamic Index Indicator for MT5

The Traders Dynamic Index (TDI) oscillator uses RSI calculations and volatility bands to identify trend direction, market strength, and volatility. The green RSI line crossing above the red signal line indicates a bullish market, while crossing below suggests a bearish market. The market base line, ideally traded within overbought/oversold levels, signals potential trend changes when nearing the borders. Expanding volatility bands indicate active markets, while narrowing bands suggest consolidation and a possible price spike. The indicator is customizable through 11 parameters including RSI periods, smoothing methods, and overbought/oversold levels.

Index Indicators for MT5

by Specialist 🫡 -

Choppy Market Index Indicator

Choppy Market Index Indicator for MT5

The Choppy Market Index (CMI) ranges from 0 to 100, with higher values indicating greater market stability and a higher likelihood of trends, while lower values suggest reduced trend potential. For unstable market conditions, traders should buy when the CMI's moving average is below 40 with a red histogram and sell when it’s below 40 with a green histogram, closing positions when the histogram exceeds 50. In trend markets, buying occurs when the moving average is above 60 with a green histogram, while selling occurs above 60 with a red histogram, with position closings triggered when the histogram drops below 50. Thus, the CMI can serve as an effective filter for trend trading strategies.

Index Indicators for MT5

by Specialist 🫡 -

Swing Index Indicator

Swing Index Indicator for MT5

The Swing Index is a mathematical tool used to assess market volatility by analyzing the price activity of the last two bars in a trading chart. The MT5 indicator synthesizes current and prior price data (Open, High, Low, Close), allowing for a clearer interpretation of price movements without the confusion of multiple price types, ultimately helping traders identify the strength and direction of market trends. This focus on short-term price ranges enhances decision-making in trading strategies.

Index Indicators for MT5

by Specialist 🫡 -

Smart Money Index Indicator

Smart Money Index Indicator for MT5

The Smart Money Index (SMI) is a powerful forex indicator used to gauge market sentiment and identify potential reversals by analyzing trading volumes and price movements indicative of institutional buying or selling. A common entry strategy involves looking for divergences between the SMI and price action; for example, if the price makes a new low while the SMI forms a higher low, it may signal a bullish reversal. Traders often wait for confirmation through additional indicators or price patterns before entering a trade, and it's essential to implement risk management strategies like stop-loss orders to protect against adverse market movements.

Index Indicators for MT5

by Specialist 🫡 -

Force Index Indicator

Force Index Indicator for MT5

The Force Index Indicator is a technical analysis tool that measures the strength behind price movements by combining price changes and volume. Developed by Dr. Alexander Elder, it is calculated by taking the difference between the current price and the previous price, then multiplying that by the current volume. The result can help traders identify the strength of a trend: positive values indicate bullish momentum, while negative values suggest bearish pressure. Traders often use the Force Index in conjunction with other indicators to confirm buy or sell signals and assess market sentiment.