Relative Spread Strength Indicator
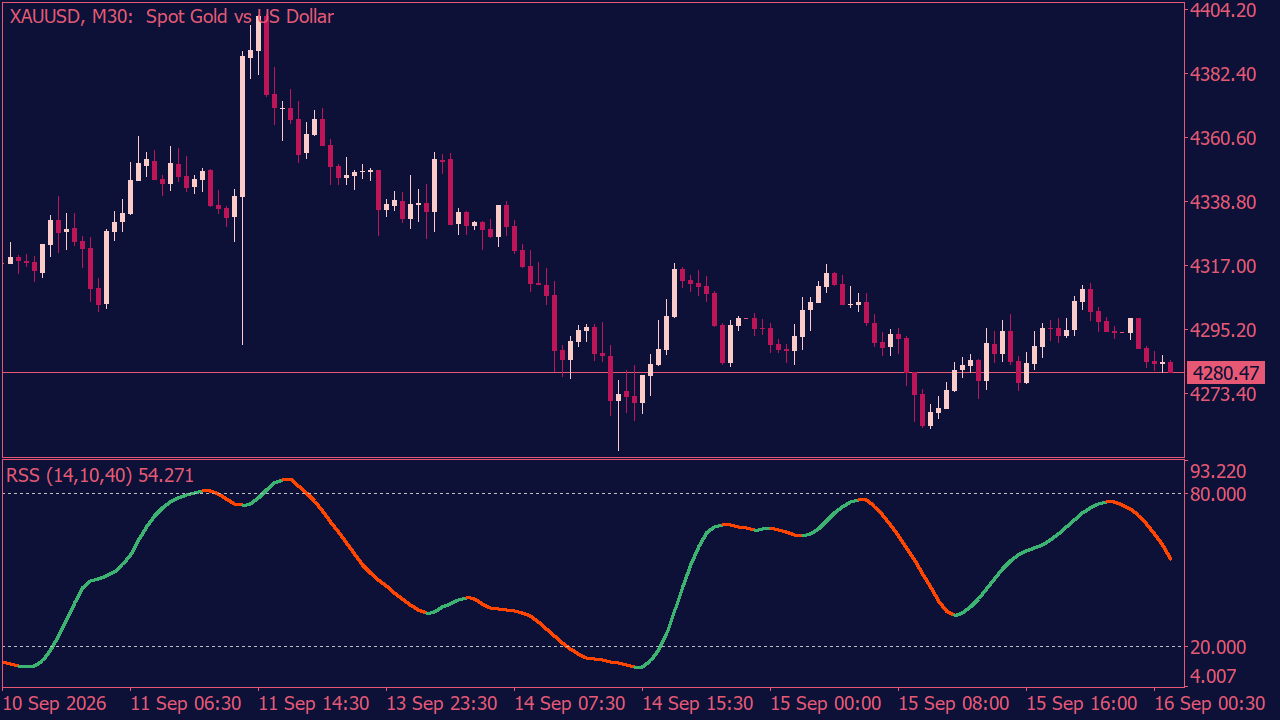
The Relative Spread Strength Indicator focuses on the relationship between a fast and a slow moving average. More specifically, it watches how the distance between them changes. That sounds simple, but it can reveal details about momentum that are easy to miss when you only look at price. The indicator turns these changes into a smooth strength reading. When the spread starts expanding, contracting, or changing direction, you can see how momentum is developing instead of only seeing the final move on the chart. Upper and lower zones also make it easier to notice when the reading reaches more unusual levels. What makes it useful is the timing of those small changes. Price can still look completely normal while the relationship between the two averages has already started to shift. It does not predict what happens next, but it gives you another way to notice when market behavior is starting to change.