i-Fractals Sig Indicator for Double Tops & Bottoms
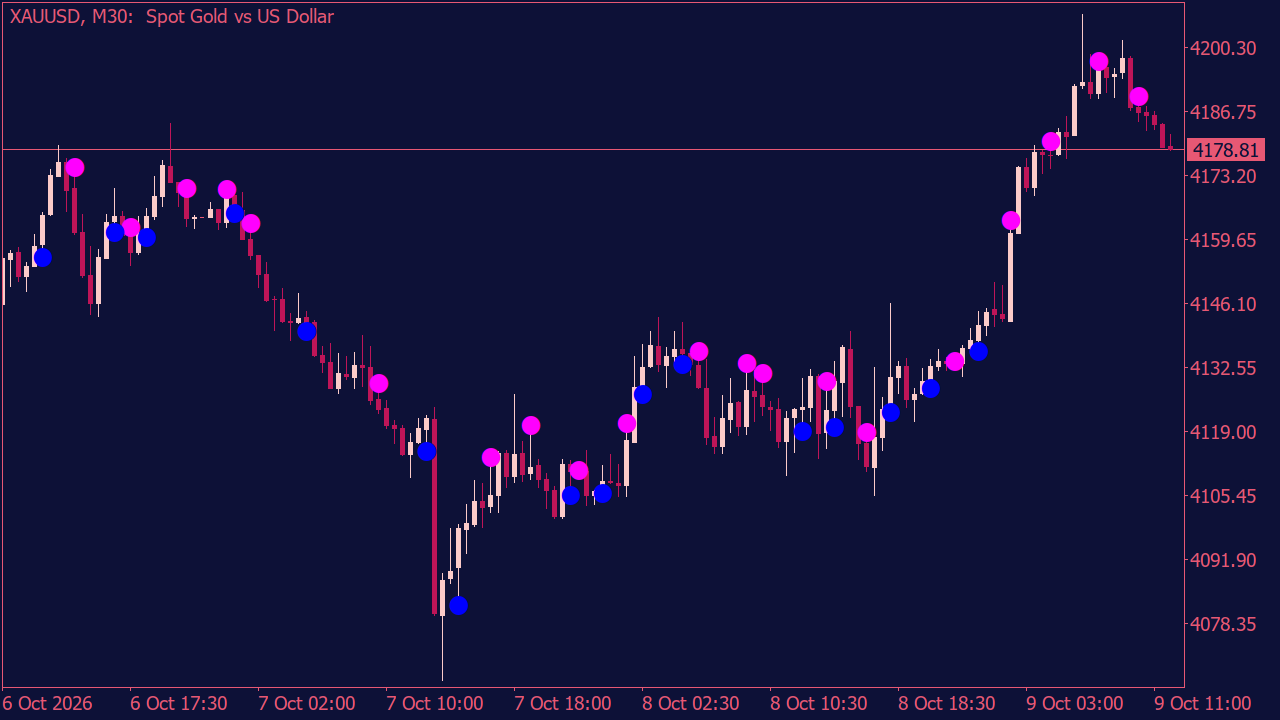
The i-Fractals Sig Indicator for Double Tops and Bottoms helps you spot those small price formations that are easy to miss when you're focused on the bigger moves. A market tests a previous high, pulls back, and returns to almost the same level. Nothing unusual at first glance, but sometimes that second attempt is exactly where things start to change. The indicator looks for double tops, double bottoms, and related fractal formations, using candle conditions to identify potential turning points. The two highs or lows don't have to match perfectly, which is useful because real charts rarely look like textbook examples. When the conditions line up, a signal appears directly on the chart. One thing worth watching is what happens after the signal, especially around previous swing levels. Does price move away from the area, or does it keep testing the same level? That reaction often tells you more than the pattern itself. The indicator helps you find these situations without having to inspect every candle manually.