Parkinson Historical Volatility Indicator
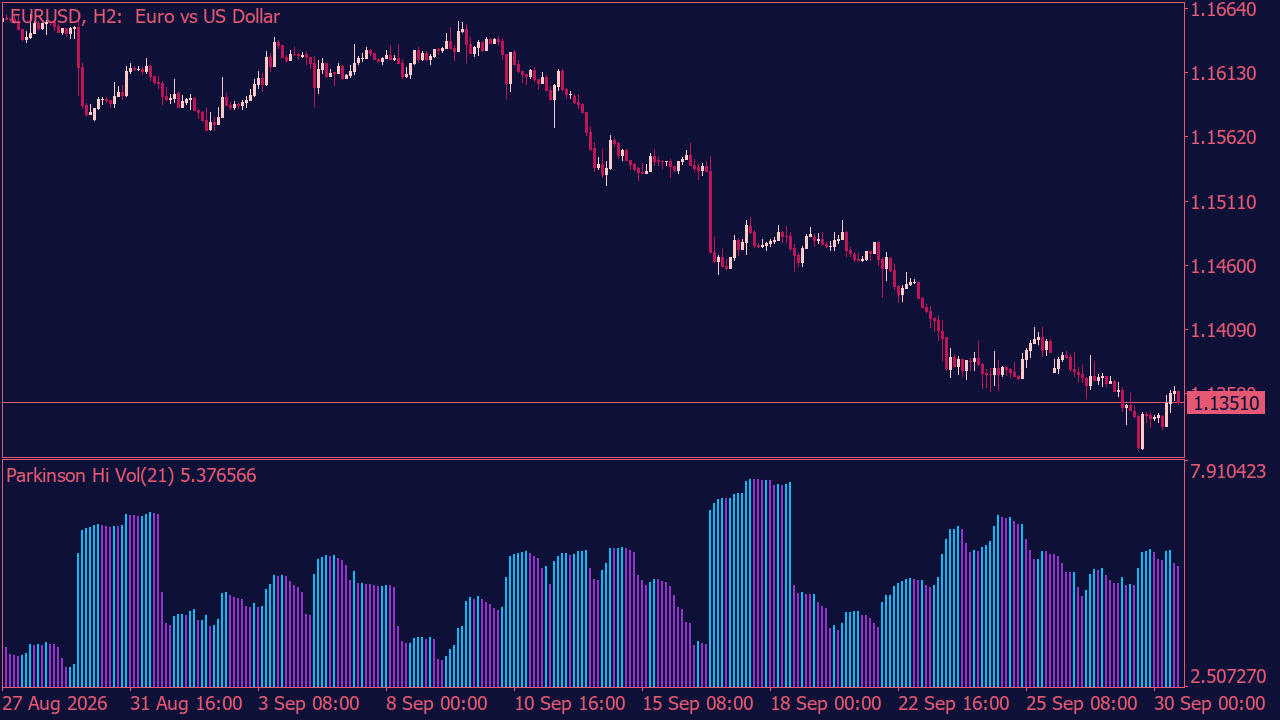
The Parkinson Historical Volatility Indicator gives you a different view of what is happening inside the market. Instead of focusing only on where price closes, it looks at the distance between the high and low of each period. That can reveal changes in activity that are easy to miss when you are only watching price direction. Sometimes the market looks completely normal, but volatility is already starting to shift. The histogram makes these changes easier to spot by showing when volatility is increasing and when it begins to fade. This can be useful during quiet phases, strong moves, or periods when price action suddenly feels different without an obvious reason. The interesting part is that volatility does not always move the way you expect. A strong price move can happen while volatility is weakening, and a quiet market can slowly become more active before anything dramatic happens on the chart. This indicator helps bring those changes into view and gives you one more way to understand what may be happening beneath the surface.