Balance of Power Indicator
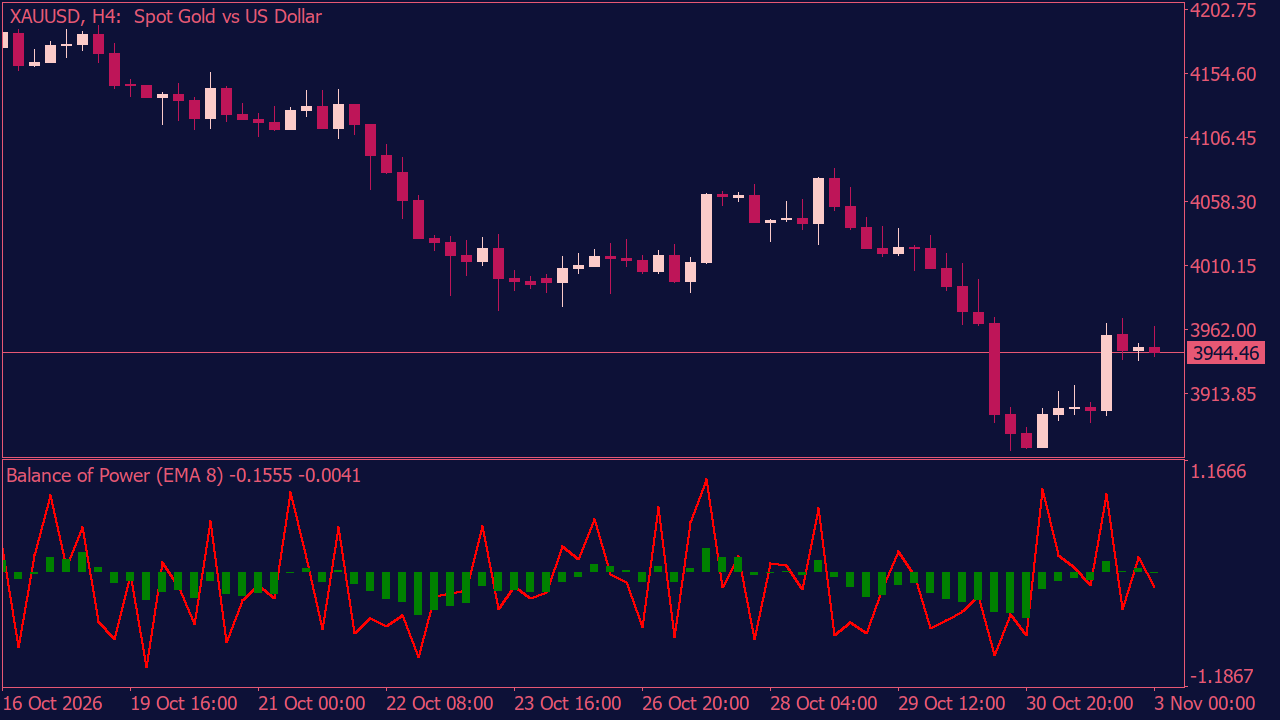
The Balance of Power indicator can make a strong-looking candle seem a lot less impressive. Price may have covered a wide range, but how much ground did buyers or sellers actually gain between the open and close? That difference is easy to miss, especially when a chart appears to be moving decisively in one direction. The indicator measures that relationship and displays the result alongside a smoothed signal. This makes it easier to follow changes in buying and selling pressure without getting distracted by every individual candle. Sometimes the readings confirm what price is doing. Other times, they raise a few interesting questions. Take a market that keeps making new highs while the Balance of Power gradually weakens. The uptrend is still there, but the candles are telling a slightly different story. Does it matter? Not always. Yet these are exactly the details worth watching, particularly when a move has already been running for some time.