Murrey Math Indicator
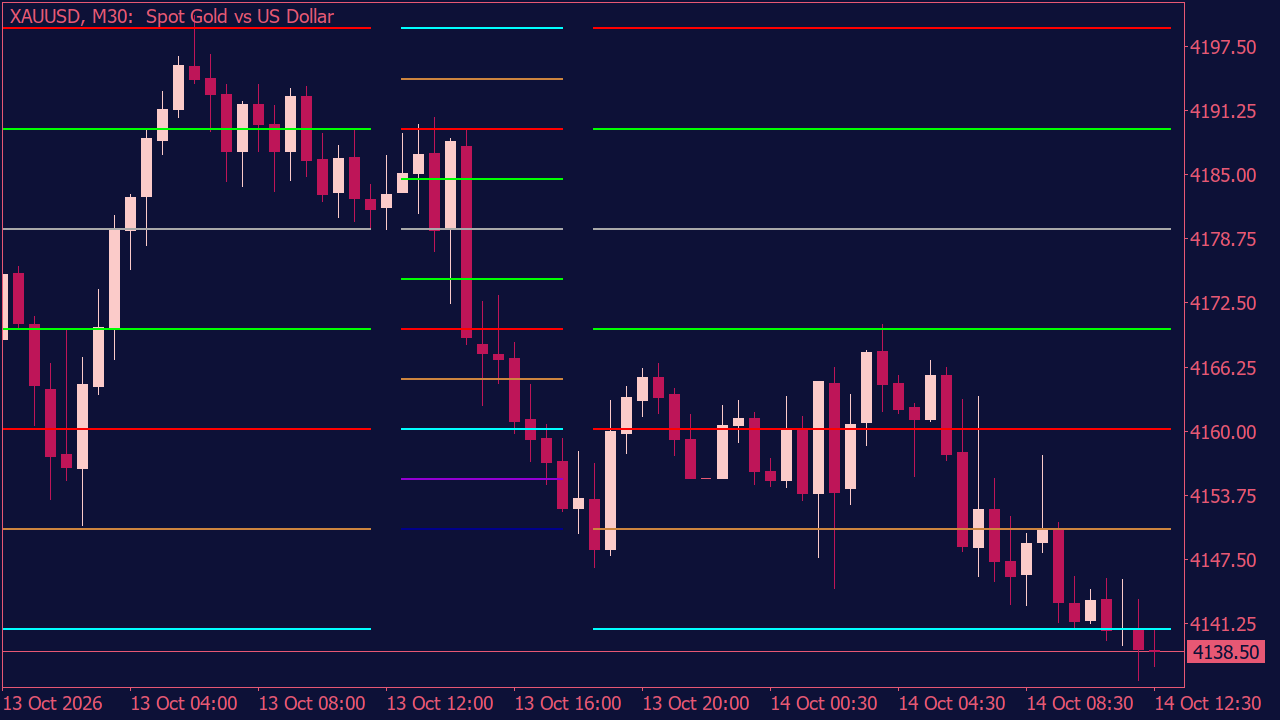
The Murrey Math Indicator shows you price levels you probably wouldn't think of drawing yourself. Ever watched the market reverse at a seemingly random spot, with no obvious support or resistance nearby? That's exactly the kind of price action that makes Murrey Math worth a closer look. The indicator plots 13 mathematically calculated levels, but you don't need to watch every single one. The 4/8 line is particularly interesting, while the 3/8 and 5/8 levels help define the market's trading range. Even the outer levels have a purpose, especially when price makes an unusually strong move. One thing worth watching is how price behaves after reaching these levels. Does it break straight through, hesitate for a few candles, or repeatedly fail to move any further? Those small details often tell you more about what's happening than the lines alone. And that's where this indicator gets interesting.