Better Volume Indicator
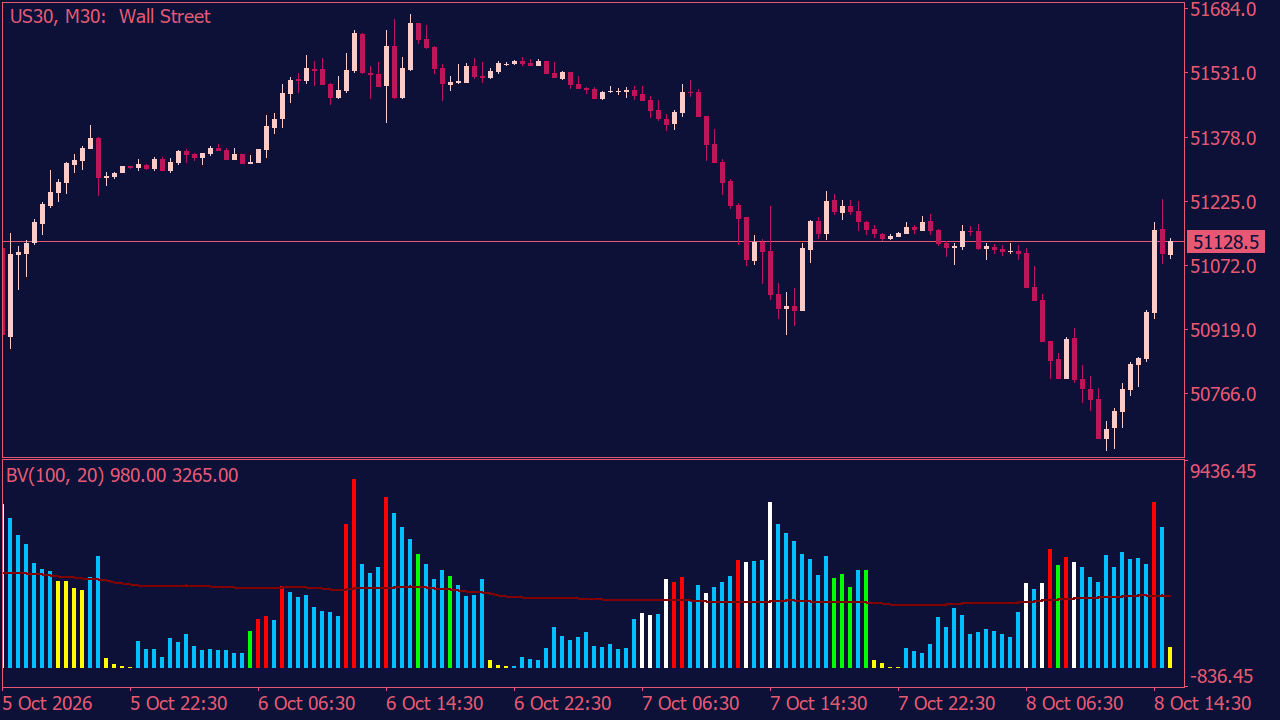
The Better Volume Indicator is worth a closer look if you've ever noticed price struggling to move despite unusually heavy trading activity. A small candle with a sudden volume spike can sometimes be more interesting than a strong breakout candle. The question is, what's actually happening behind that price movement? That's where this indicator comes in. Instead of showing the usual volume bars, it highlights different types of activity with separate colors. High volume, low volume, and unusual relationships between trading activity and candle ranges become much easier to recognize. It's particularly interesting around support and resistance levels, where price doesn't always react the way you'd expect. One thing worth watching is what happens when volume increases sharply, but price keeps closing within a relatively narrow range. It doesn't necessarily mean the market is about to reverse, but it's often a good reason to pay closer attention. Combined with basic price action, the indicator can reveal details you'd probably miss by looking at candles alone.