Hama Indicator
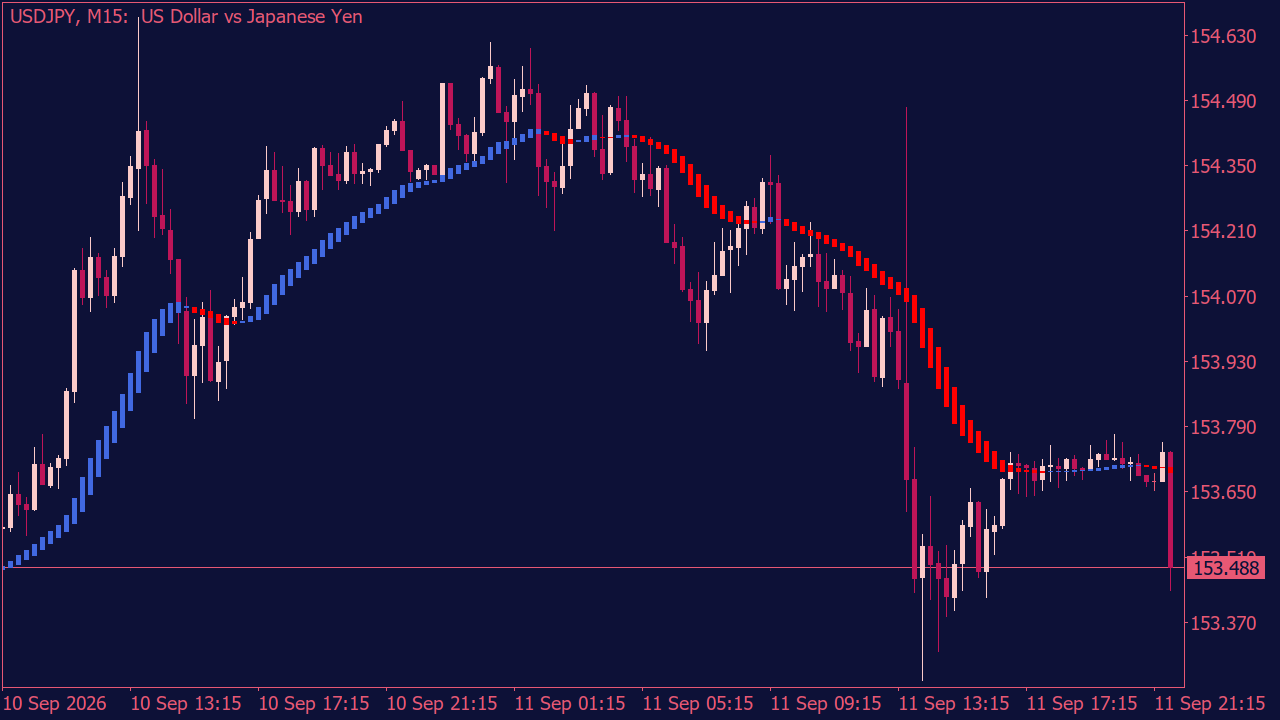
The Hama Indicator gives price action a cleaner look without turning the chart into something completely different. It smooths the candles, cuts down some of the small noise and makes bullish or bearish phases easier to follow. Simple idea, but the difference can be quite noticeable once you spend some time with it. The interesting part is not just the colors. It is how the whole move starts to look different. Trends can appear more organized, weak phases are easier to notice and some direction changes stand out much more than they do on a normal chart. You may even find yourself looking at an old setup and wondering why it suddenly seems so obvious. You can change the smoothing and use different calculation methods, so there is room to experiment. Some settings feel faster, others make the chart much calmer. There is no single setup that fits everything — and that is actually part of the fun. Try it on a few markets and timeframes and see what starts to stand out.