Relative Volatility Index Indicator
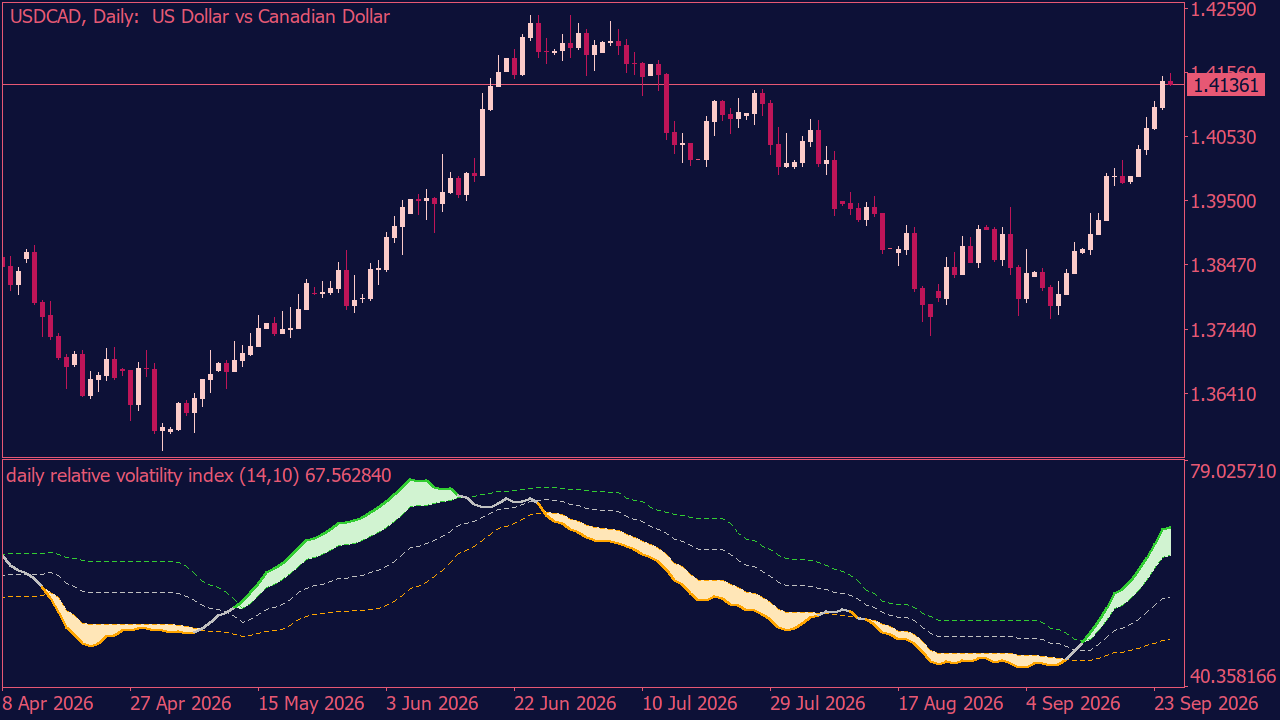
The Relative Volatility Index Indicator is one of those tools that becomes more useful once you stop watching only the line itself. The real value is in seeing how volatility changes while price is moving, especially when the chart looks obvious at first glance. Sometimes price keeps pushing higher or lower, but the indicator starts reacting in a completely different way. That does not automatically mean anything has to happen next, but it can be a good reason to look closer instead of just following the candles. The adaptive levels help because they move with recent conditions rather than staying fixed all the time. Add the different smoothing methods, price options, higher-timeframe calculations, colors, and alerts, and you get a pretty flexible way to watch volatility without overcomplicating the chart.