A crossover is easy to spot — but Ichimoku becomes powerful when the cloud, Chikou, and Kijun reveal the full setup.
☁️ Is the Ichimoku Cloud Confirming the Trade — or Warning You?
Many traders open Ichimoku, see the cloud, wait for a Tenkan/Kijun cross, and treat the signal as enough. The better clues are usually less obvious: price may be stretched and drifting back to Kijun, a flat Senkou B may be pointing to an old balance zone, or a clean-looking Kumo twist may be setting up a failed breakout.
This article looks at those overlooked details and shows how Ichimoku can help Forex traders read pressure, timing, congestion, and structure before committing to a trade. It also explains why Chikou Span deserves more attention, why some breakouts are better left alone, and why no trade can sometimes be the strongest decision. Before your next setup, ask yourself: is the cloud supporting the idea — or quietly warning you?
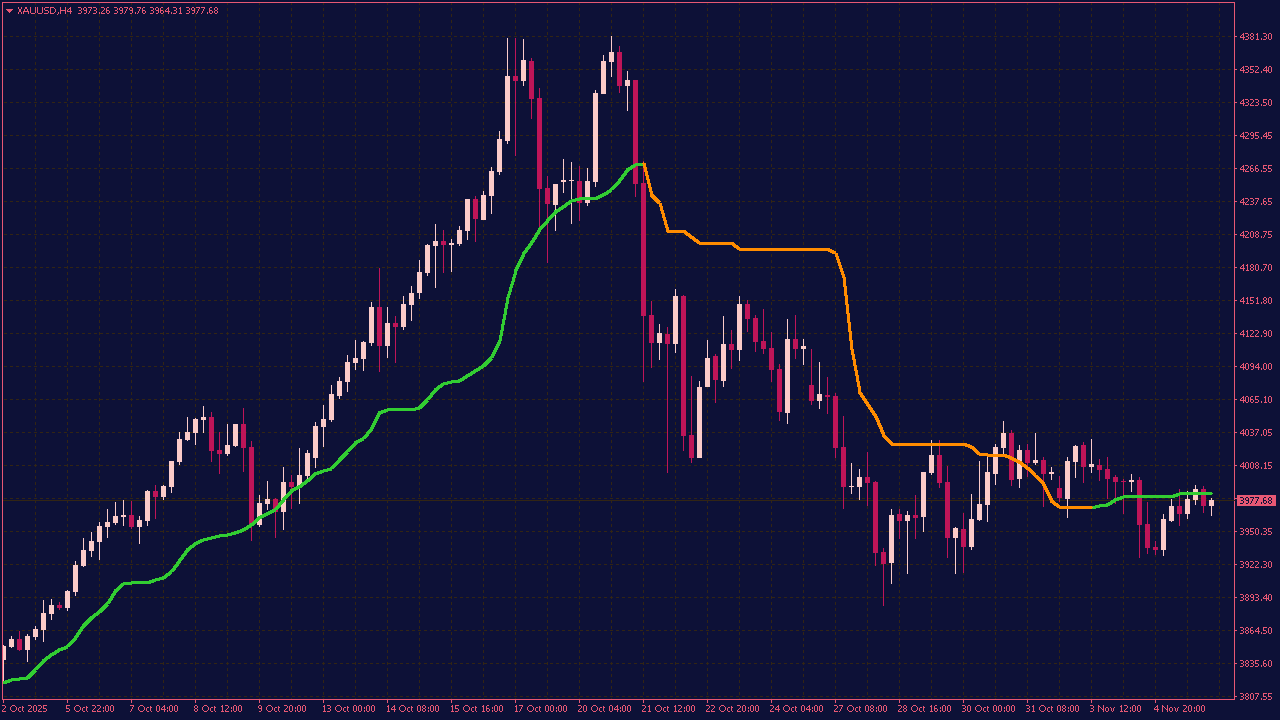
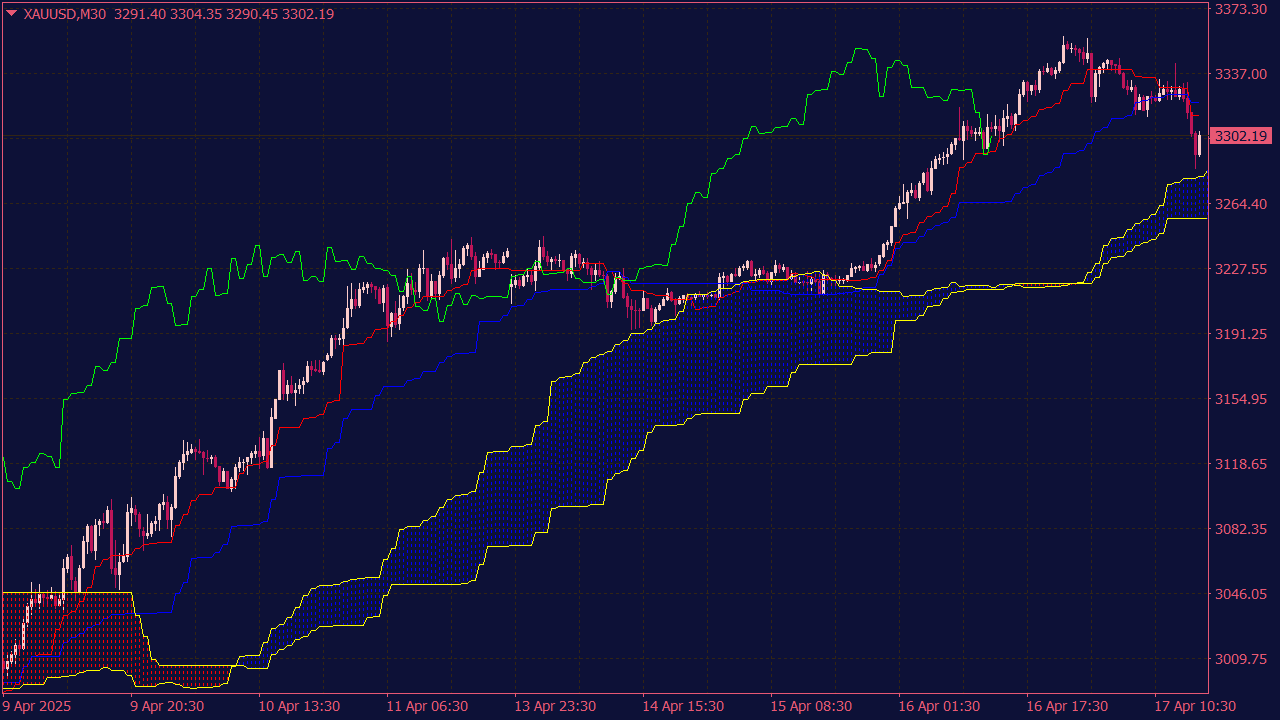
The Ichimoku MTF Smoothed Indicator gives you a simple way to see what is happening beyond the timeframe currently open on your chart. Instead of switching back and forth all the time, you can bring the Ichimoku structure from another timeframe into the same view and compare it with what price is doing right now. This can lead to some interesting situations. A move that looks strong on the current chart may suddenly look much less convincing when the larger cloud is sitting directly in its way. On the other hand, a messy sideways market can start to make more sense once Tenkan, Kijun and the higher-timeframe Kumo begin pointing in the same direction. The smoothing helps keep the chart readable without taking away the familiar Ichimoku structure. The interesting part usually starts when the two views do not agree. Price may already be moving, while the higher timeframe is telling a completely different story in the background. Sometimes it is only a small change in the cloud or a line beginning to cross — but that small detail can make you look at the entire setup differently. And every now and then, that is exactly where the chart gets interesting.
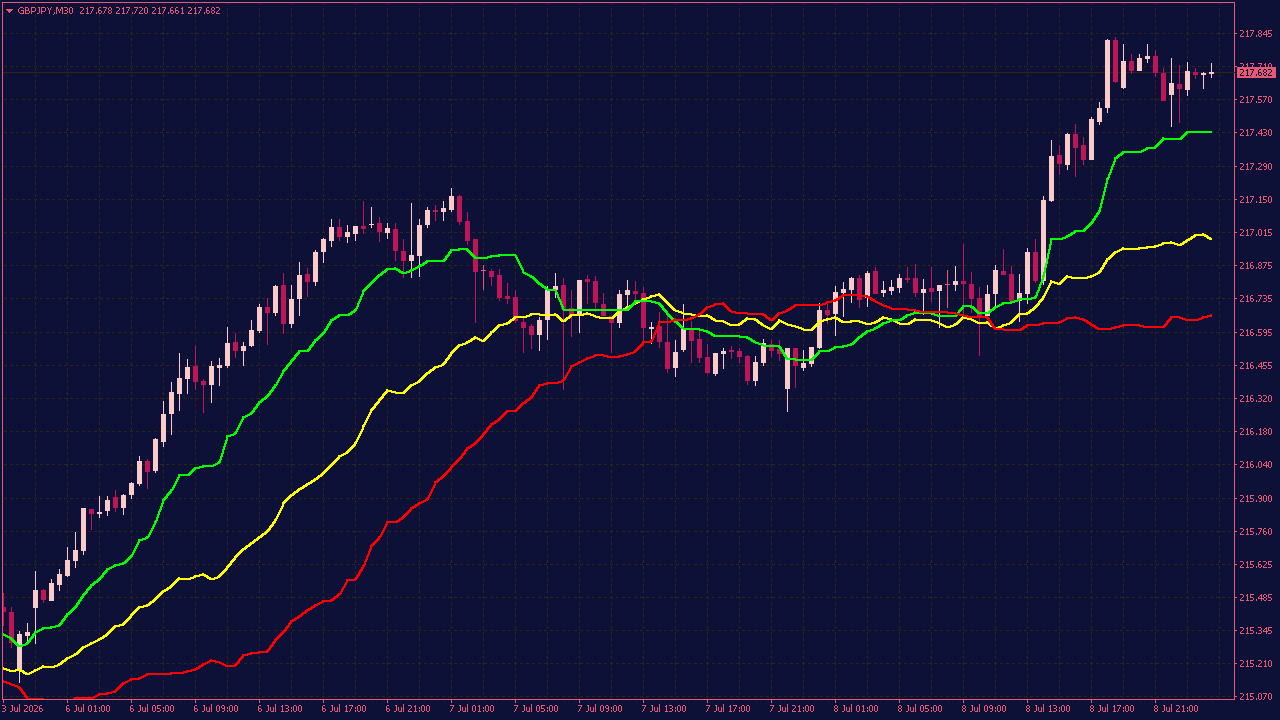
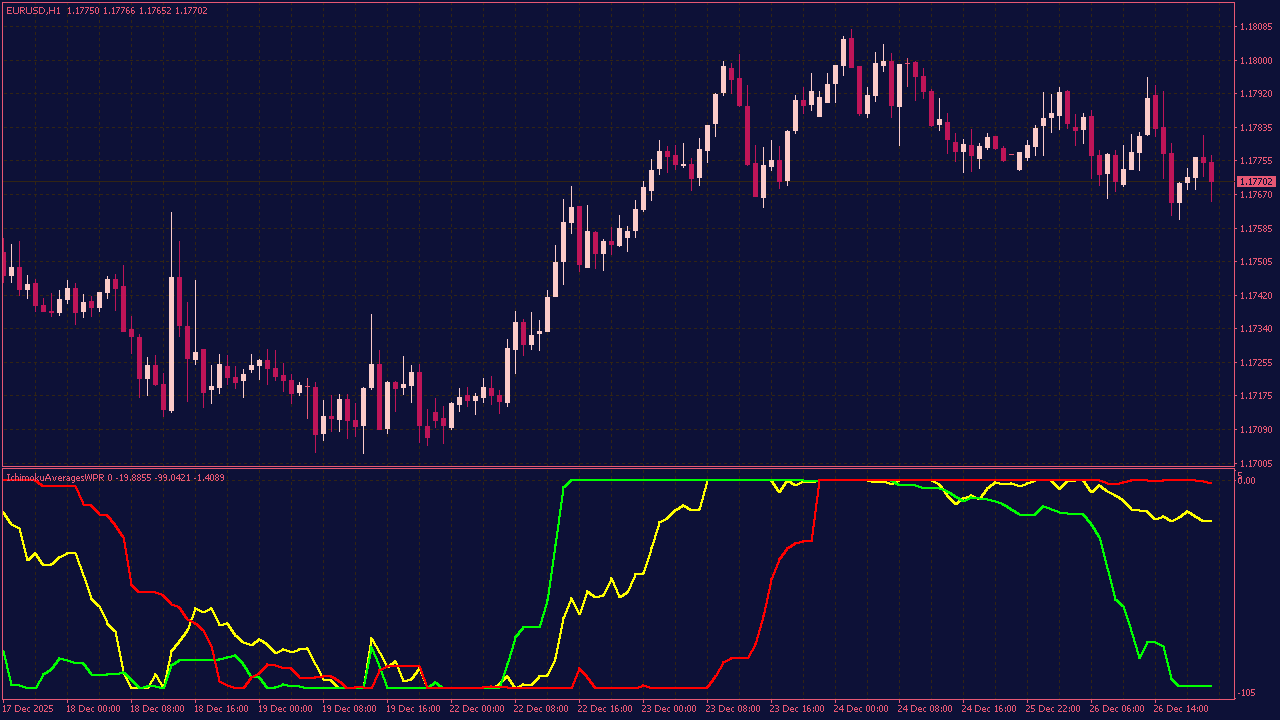
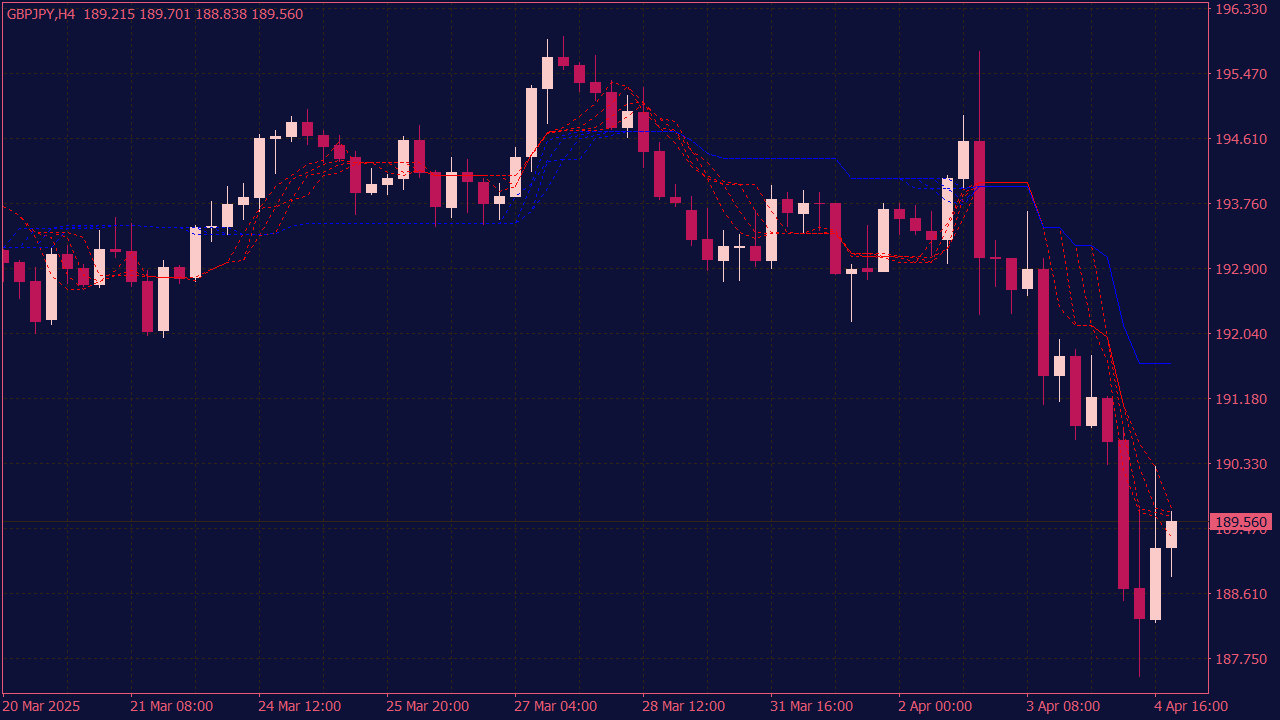
The Ichimoku Averages MTF Indicator is a practical chart tool for traders who like the logic behind Ichimoku analysis but prefer a cleaner way to read it. Instead of crowding the chart with too many separate elements, it turns selected Ichimoku values into smooth average lines that are easier to follow during live market movement. This can be useful when you want to understand whether price is still moving with the trend or starting to lose strength. The lines help show where the market may be balanced, where momentum is building, and where price could react again after a pullback or consolidation. What makes this indicator interesting is that it does not try to overload the chart with signals. It gives you a different way to look at structure, especially when the lines start to tighten, separate, or interact with price in key areas. Sometimes those small changes are exactly what makes a trader look twice.
The Ichimoku MTF Indicator with Alerts is a custom indicator that displays Ichimoku Cloud components (Tenkan-sen, Kijun-sen, Senkou Span A/B) from a higher timeframe (HTF) on a lower timeframe chart. It helps traders identify trend direction, support/resistance, and potential trade signals across multiple timeframes. Built-in alerts notify users of key events like Tenkan-Kijun crosses or price breaking above/below the cloud, enhancing decision-making in trend-following strategies.
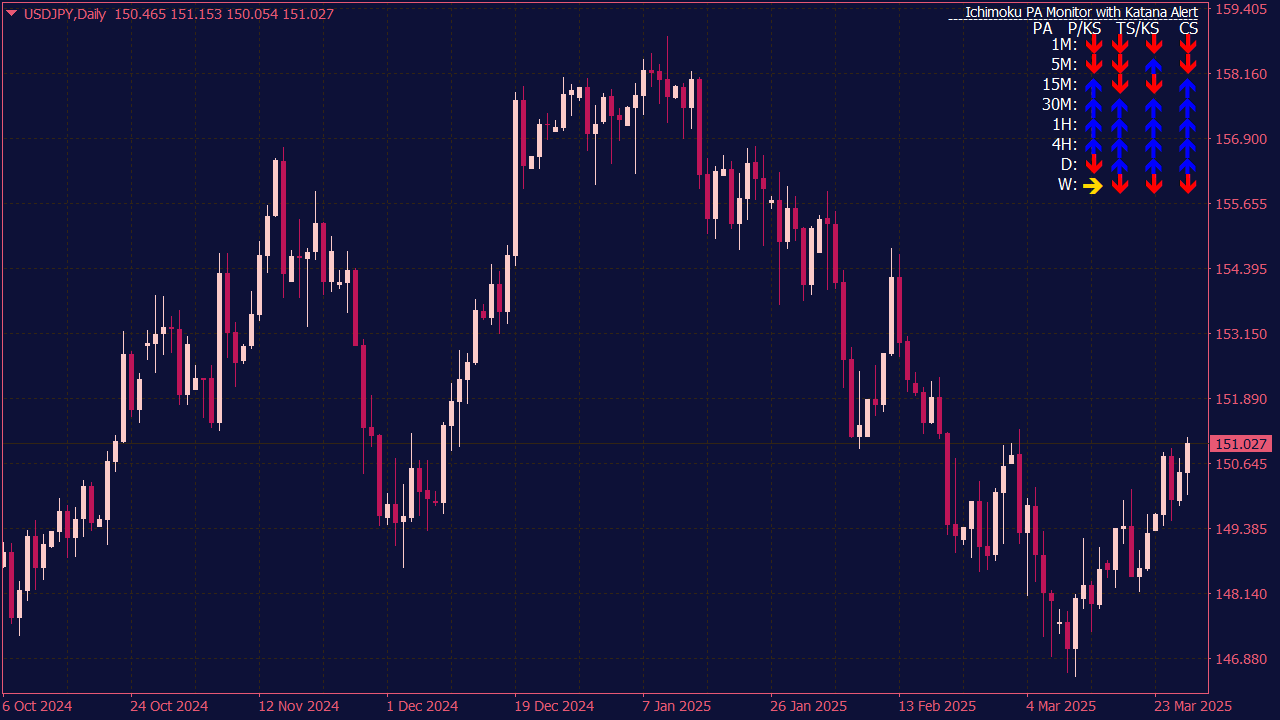
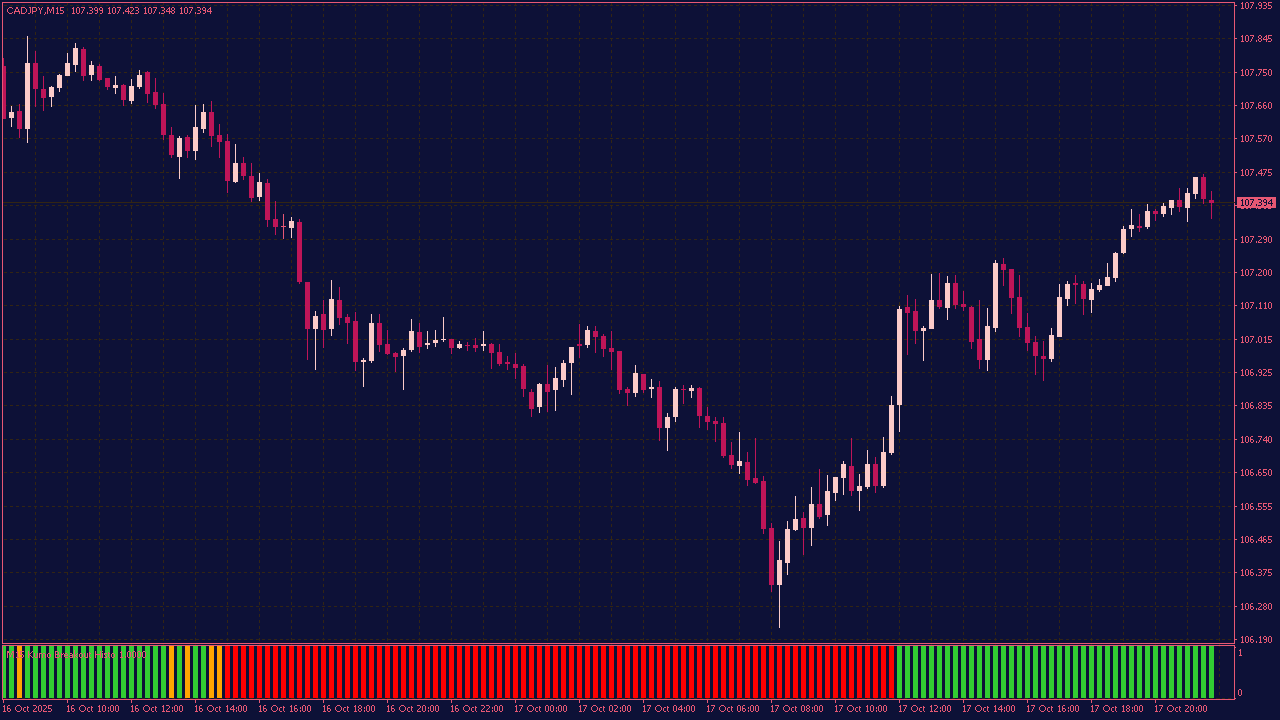
The Multi Ichimoku Monitor Indicator gives traders a simple way to read Ichimoku signals across multiple timeframes in one place. Instead of checking each chart manually, you can quickly see where the market bias looks stronger, weaker, or still mixed. The interesting part is not only the signal itself, but what may be forming behind it. Is the market really preparing for a move, or is it just noise? When price action, cloud position, Tenkan/Kijun direction, and Chikou confirmation begin to agree, the chart often becomes much more worth watching. The Multi Ichimoku Monitor Indicator is made for traders who prefer confirmation before making decisions. It helps you compare the bigger picture, avoid relying on one timeframe alone, and pay closer attention when the Ichimoku structure starts to show something more serious.
The Ichimoku Averages with RSI MTF Oscillator is a dual-indicator tool that combines smoothed Ichimoku averages for trend analysis with a higher-timeframe RSI oscillator for momentum confirmation. This setup helps traders align entries with both trend direction and broader market strength, enhancing signal reliability across multiple timeframes.
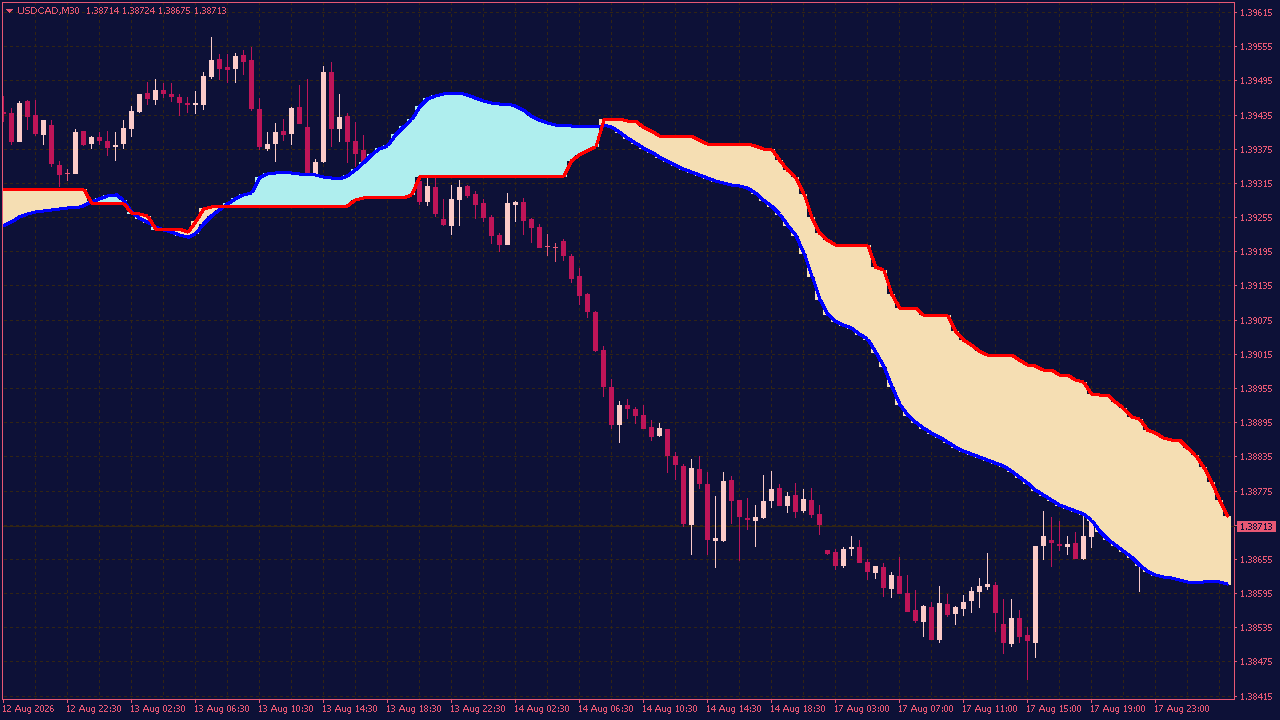
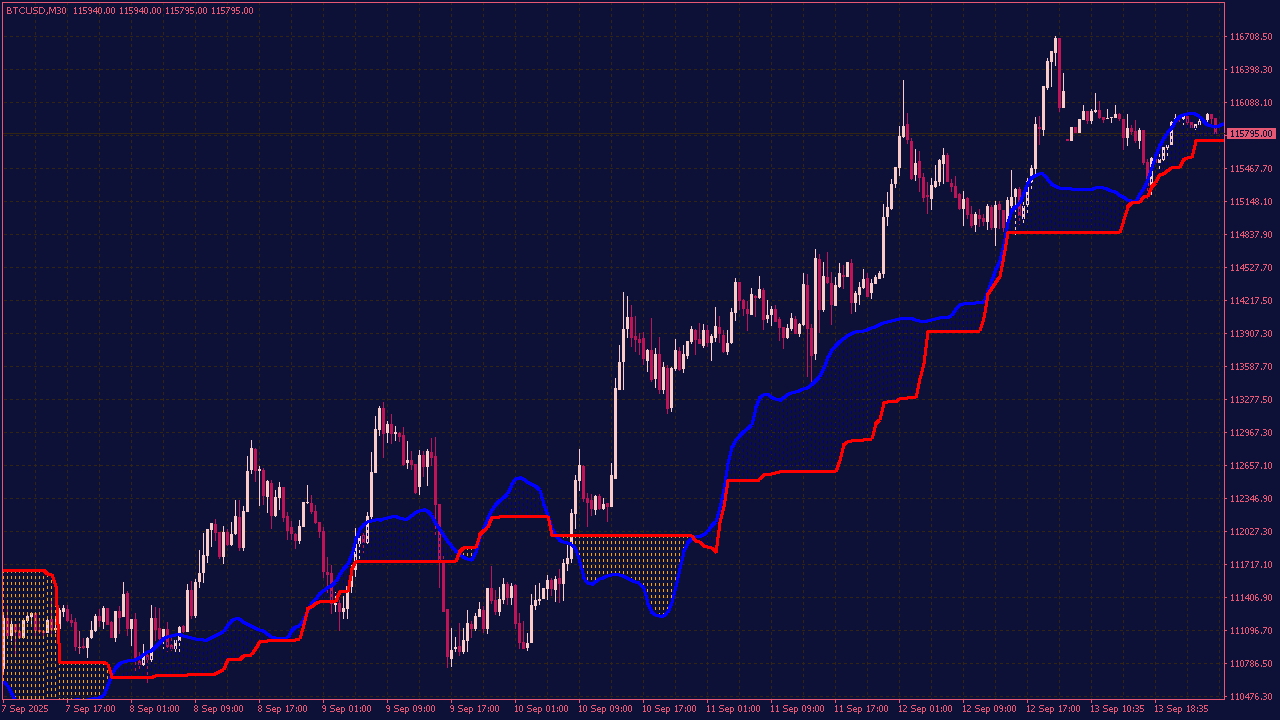
The Ichimoku Cloud (Kumo) Indicator focuses solely on the cloud component of the Ichimoku system, formed by Senkou Span A and Senkou Span B. It highlights dynamic support and resistance zones and helps identify trend direction. A price above the cloud suggests bullish conditions, below indicates bearishness, and inside the cloud signals consolidation or uncertainty.
The Ichimoku Scanner Indicator is a market-scanning tool that analyzes multiple symbols and timeframes to detect key Ichimoku-based signals. It identifies trends, crossovers, and cloud breakouts, helping traders quickly spot potential trading opportunities without manually checking each chart. Ideal for efficient, trend-focused decision-making.
The Dark MTF Ichimoku Indicator is a customized multi-timeframe version of the Ichimoku Cloud designed with a dark-themed visual style for improved clarity in low-light environments. It displays key Ichimoku components (such as Tenkan-sen, Kijun-sen, and the Kumo cloud) from higher timeframes on a lower timeframe chart. This allows traders to align short-term entries with long-term trends, enhancing accuracy and timing in trend-following strategies.
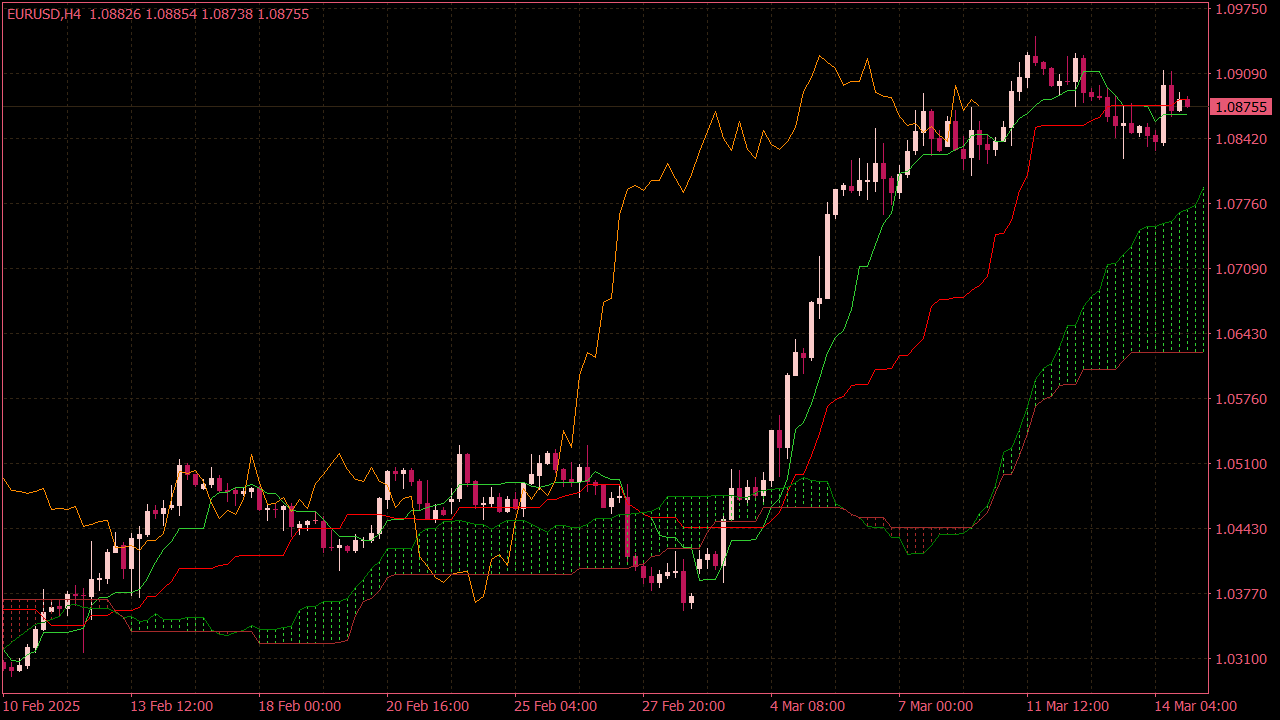
The Ichimoku Chinkou NRP MTF Indicator is a specialized version of the Ichimoku Cloud focusing on the Chinkou Span (the lagging line), combined with Non-Repainting (NRP) logic and Multi-Timeframe (MTF) functionality.
Chinkou Span: Plots the current closing price shifted back by 26 periods, helping confirm trend direction by comparing price action to past levels.
Non-Repainting (NRP): Ensures signals don’t change after they appear, increasing reliability for backtesting and live trading.
Multi-Timeframe (MTF): Displays the Chinkou Span data from a higher timeframe on a lower timeframe chart, giving a broader market perspective.
This indicator helps traders confirm trend strength and momentum across multiple timeframes with stable, reliable signals.
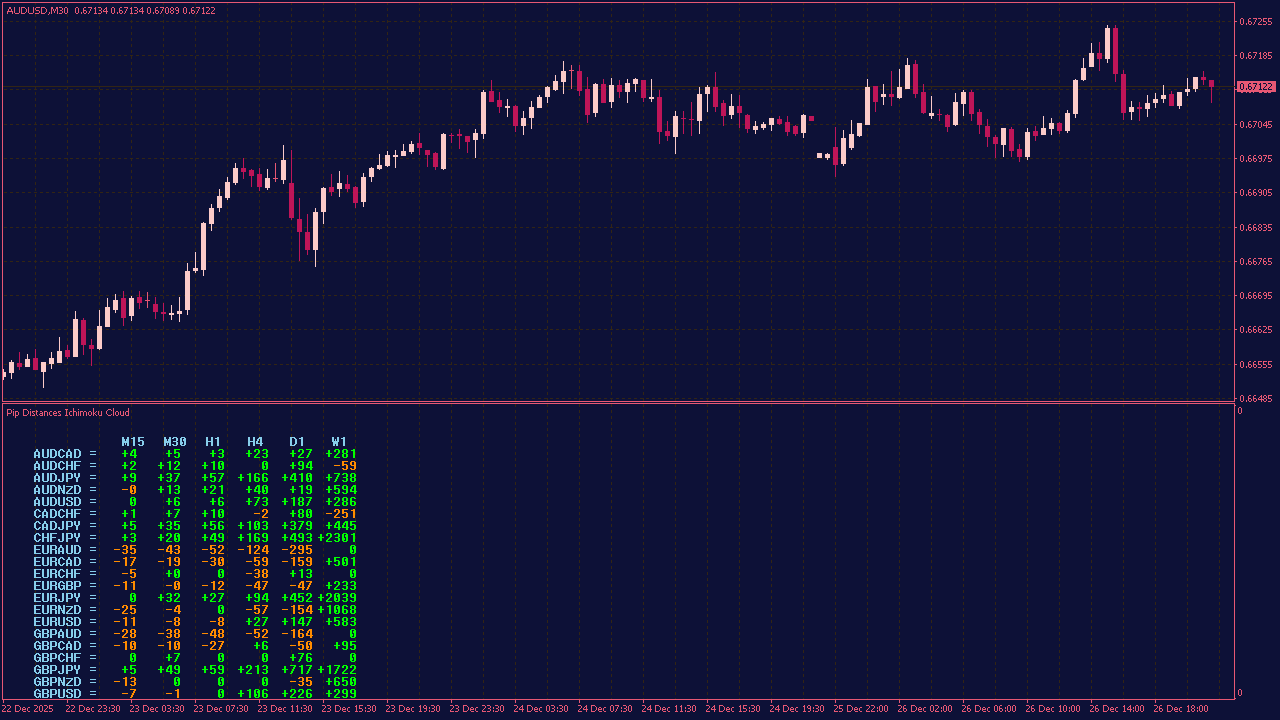
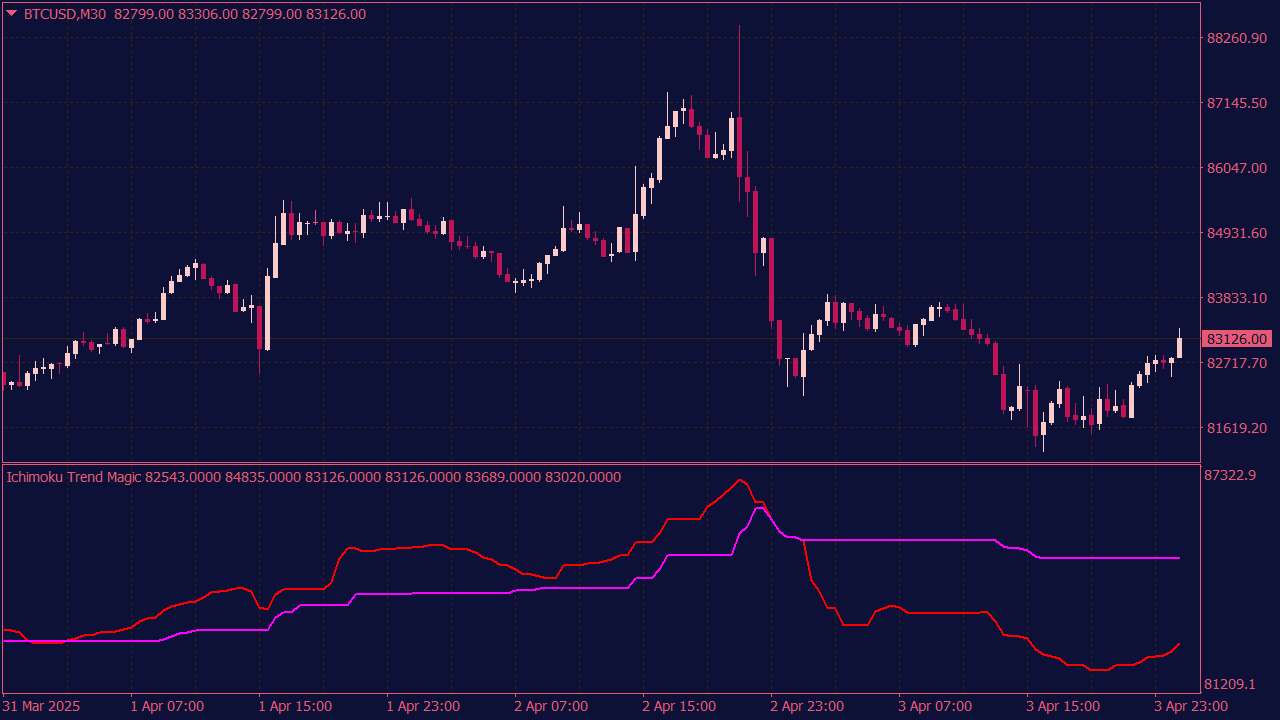
The Ichimoku Span Shift Indicator displays the Senkou Span A and Senkou Span B lines shifted forward or backward, but instead of overlaying them on the price chart, it plots them in a dedicated sub-window. This allows traders to observe future support and resistance levels clearly without cluttering the main chart, offering a more focused view on potential trend direction and market dynamics.
The Vinini MTF Ichimoku Indicator is a multi-timeframe (MTF) version of the standard Ichimoku Kinko Hyo system. It allows traders to view Ichimoku data from multiple timeframes simultaneously on a single chart. This helps provide a broader perspective on the market by highlighting trend direction, support, and resistance levels across different timeframes, enhancing decision-making and trade confirmation.
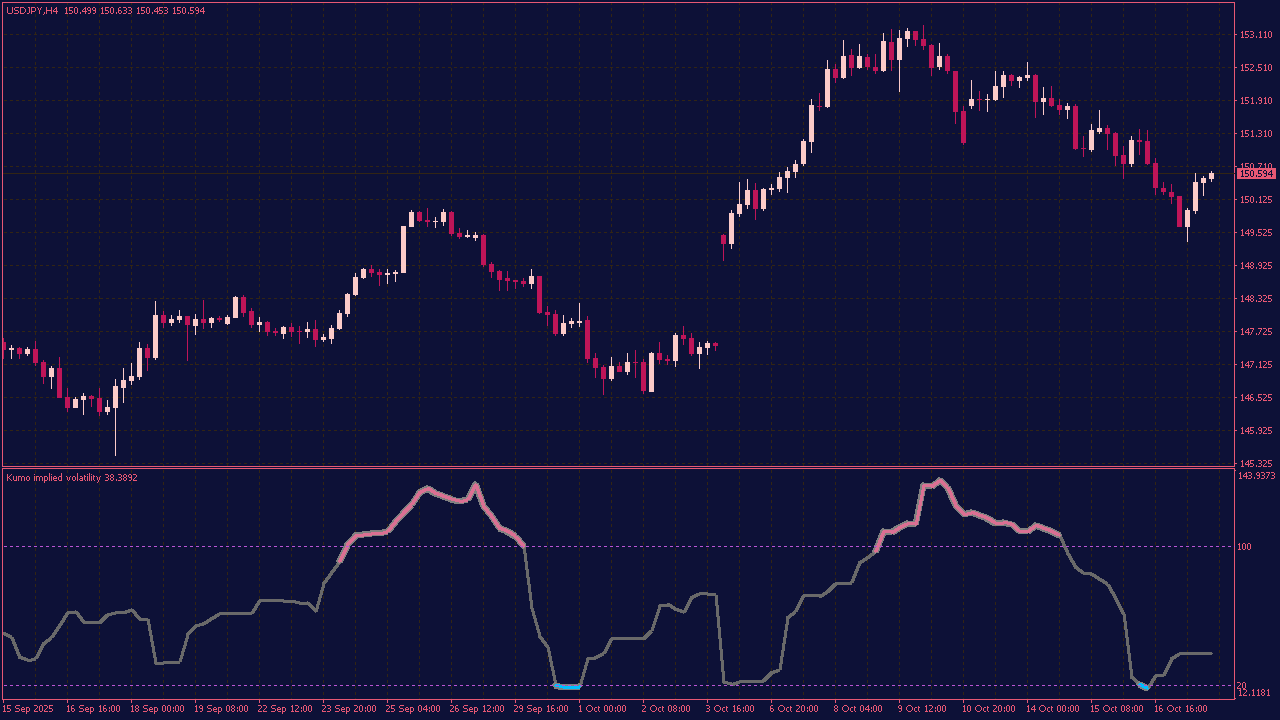
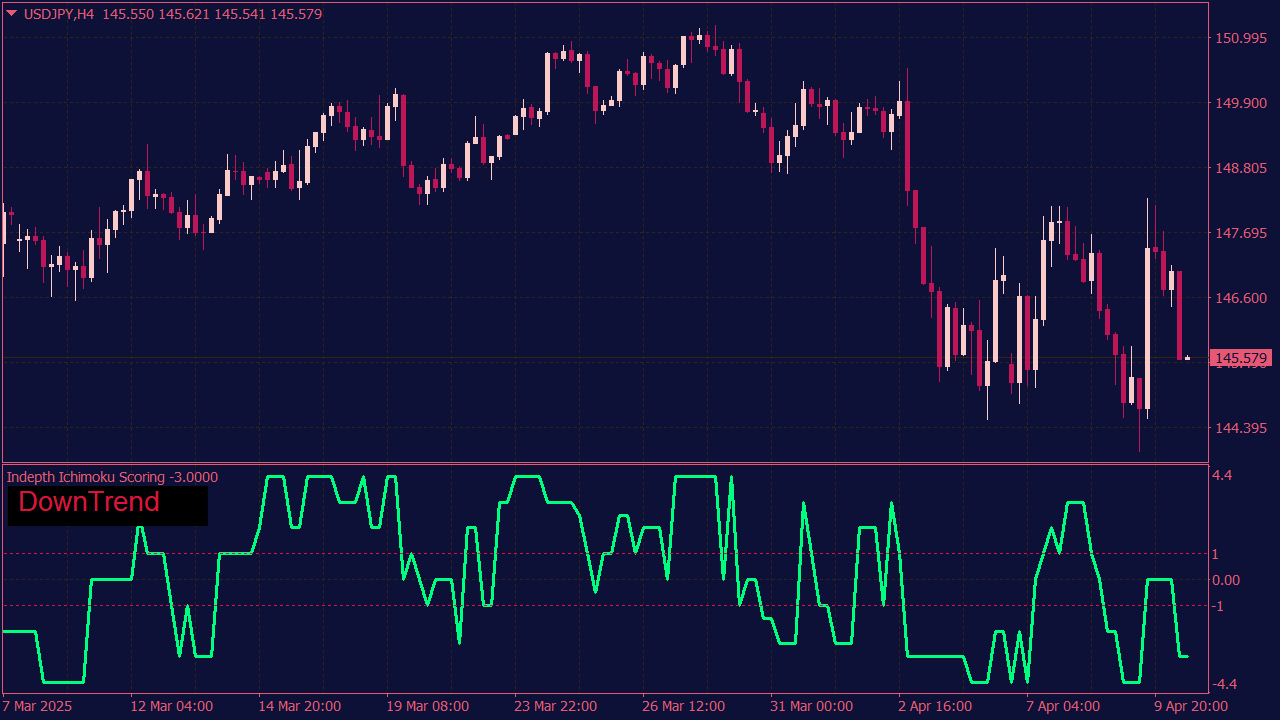
The Ichimoku Scoring Indicator is a simplified tool derived from the Ichimoku Cloud system that generates a numeric score based on key components (Tenkan-Sen, Kijun-Sen, Senkou Span A/B, and Chikou Span). The score reflects the strength, direction, and momentum of a trend: positive for bullish, negative for bearish, and near zero for neutral. It condenses complex Ichimoku signals into a single value, helping traders quickly assess market conditions and make informed decisions.
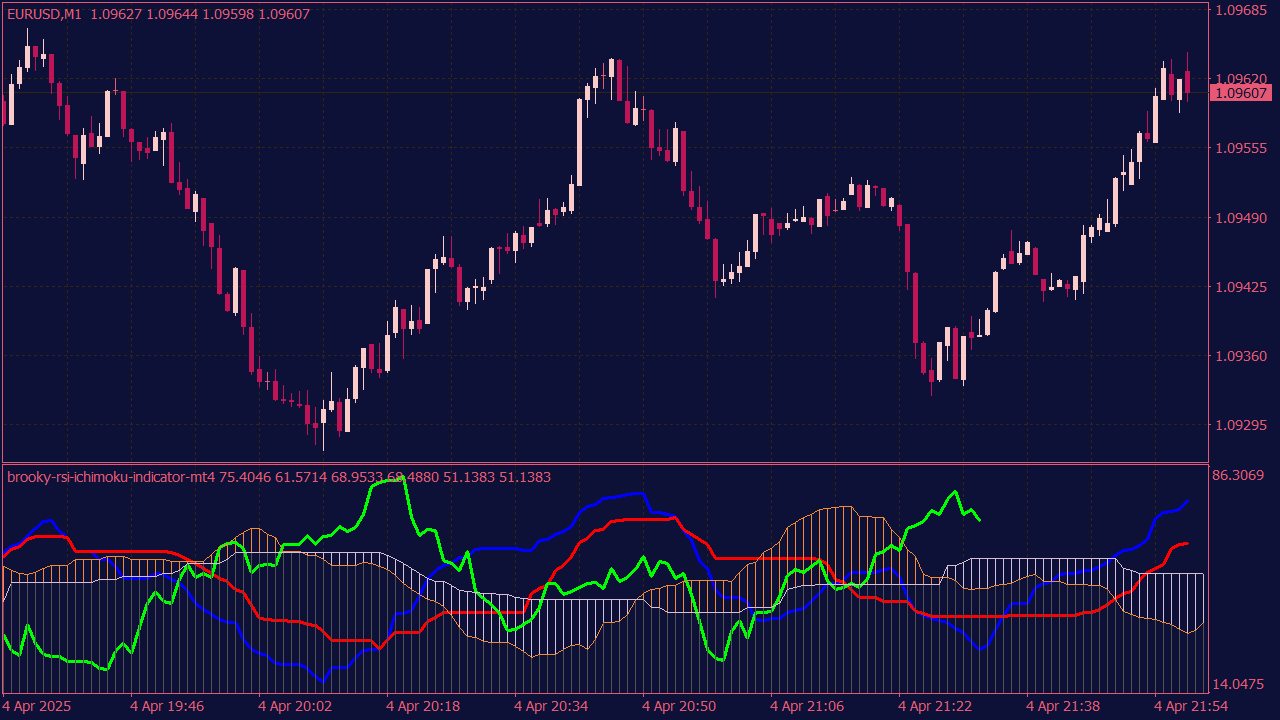
The Brooky RSI Ichimoku Indicator combines RSI and Ichimoku Cloud in a separate window to show momentum and trend signals. RSI highlights overbought/oversold conditions, while Ichimoku reveals trend direction and support/resistance levels. It helps traders spot entry/exit points more effectively.
☁️ Ichimoku Unlocked: Cloud Setups Forex Traders Often Overlook
Ichimoku Kinko Hyo can look intimidating at first. Five lines, a projected cloud, and a lagging span are enough to make many traders remove it from the chart before they ever understand what it is trying to show.
That is a mistake.
Ichimoku is not meant to be a noisy signal generator. Its real value is context. It helps traders judge whether price is trending, balanced, stretched, compressed, or stuck in uncertainty. In Forex, that context matters. Currency pairs move through liquidity cycles, session flows, macro expectations, central-bank repricing, and sudden news shocks. A simple crossover can look attractive and still be poorly positioned.
The question is not only whether Ichimoku gives a signal.
The real question is whether the market structure supports that signal.
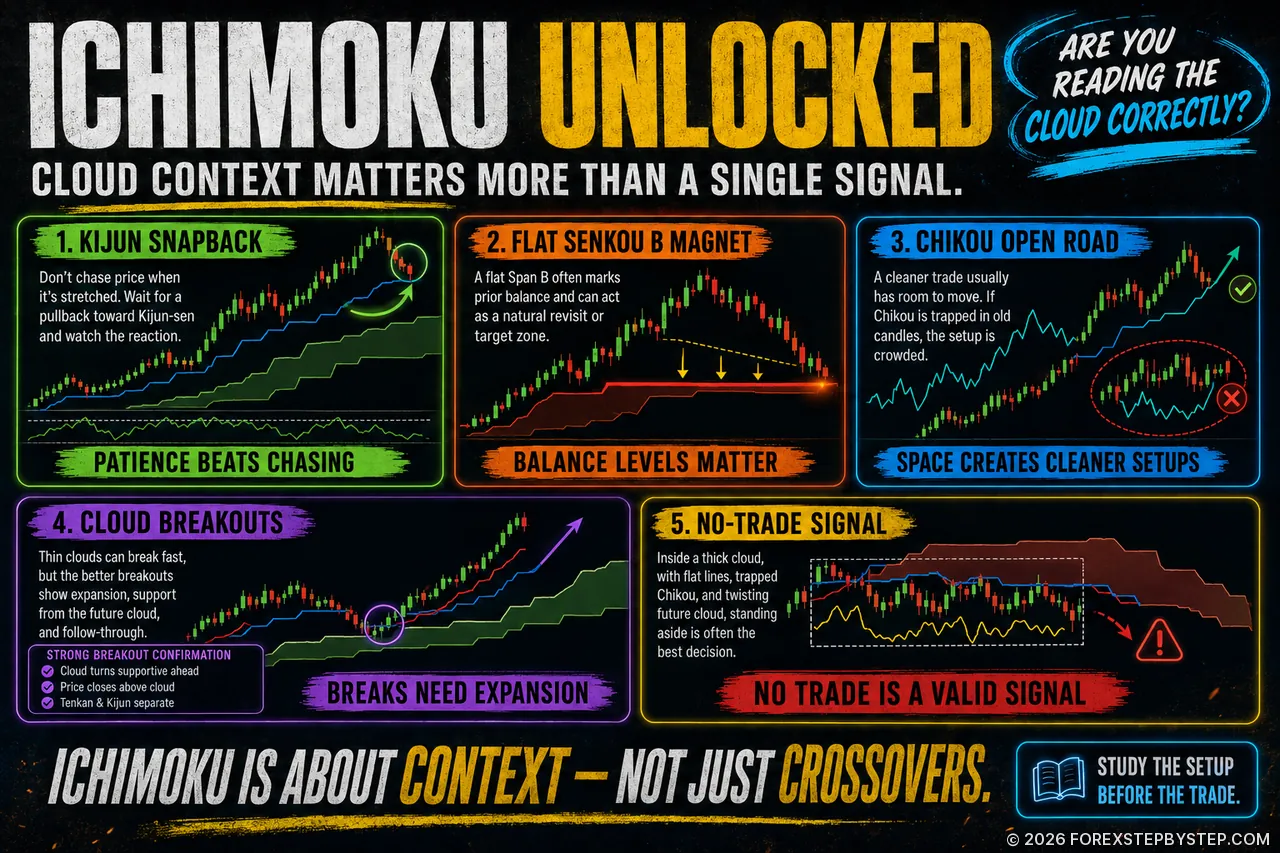
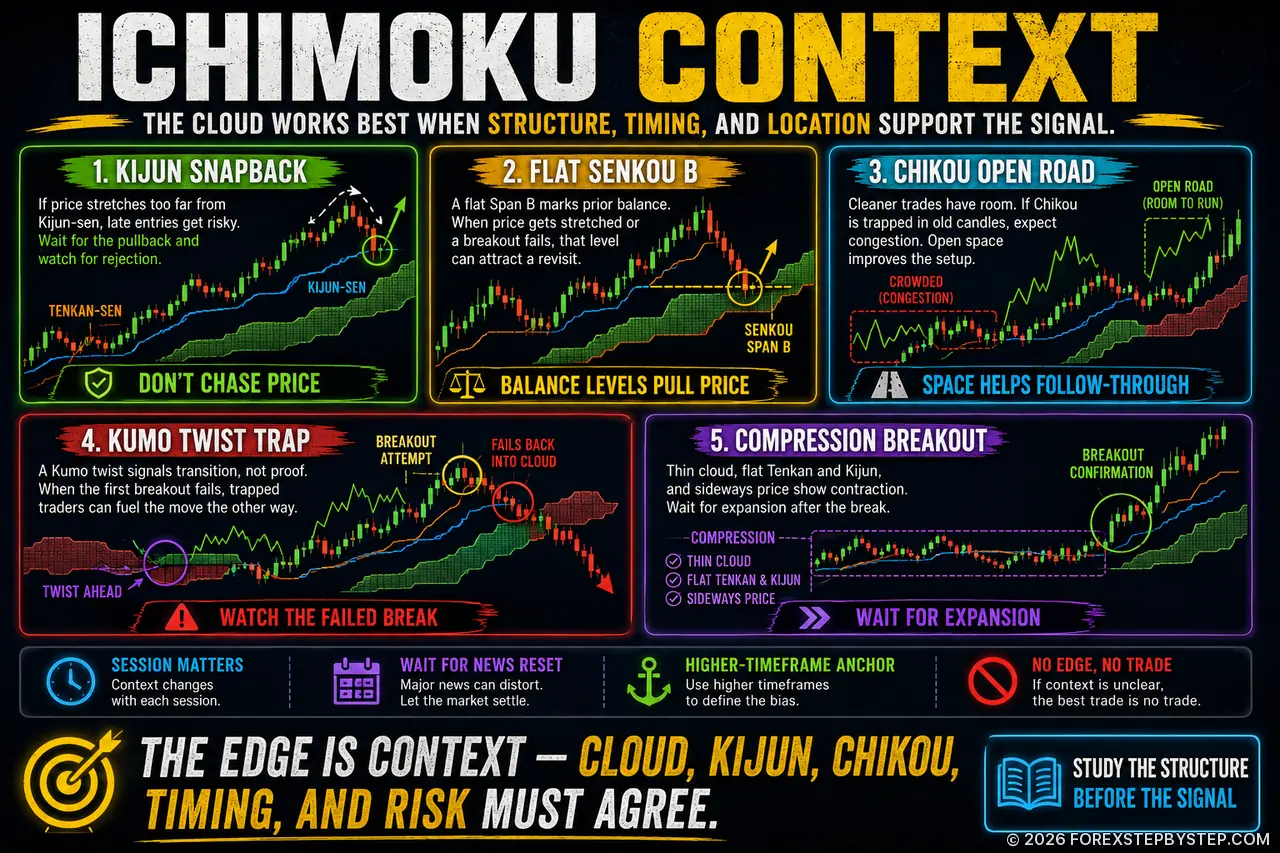
⚖️ 1. The Kijun Snapback
The Kijun-sen is one of the most important reference points in Ichimoku because it shows where price may be stretched away from equilibrium.
In a strong trend, price can travel far above or below the Kijun-sen. At first, that distance looks like strength. After a while, it can become a warning. If candles begin to shrink, wicks appear, and the Tenkan-sen starts to flatten, the move may be losing momentum.
This is where many late entries happen. Traders see a strong candle and enter after the market has already moved too far. Ichimoku offers a more patient approach: wait to see whether price returns toward the Kijun-sen and how it reacts there.
In practice:
In an uptrend, a pullback toward the Kijun-sen can offer a cleaner long setup if price rejects the level and remains above the cloud.
In a downtrend, a rally into the Kijun-sen can offer a cleaner short setup if sellers defend the level and price remains below the cloud.
The idea is simple: do not chase price when it is far from value. Let the market return to a level where the trade can be managed more clearly.
🧲 2. The Flat Senkou B Magnet
Flat Senkou Span B is easy to miss because it does not behave like a classic trading signal. It does not cross, flash, or react quickly. But that is exactly why it deserves attention.
A flat Senkou B often marks an area where the market previously found balance. Price spent time around that level, and the cloud preserves that information. Later, when price becomes stretched or a breakout fails, that level can act as a natural area for price to revisit.
This can be useful for trade management. A flat Senkou B may help identify a target, a partial-profit zone, or a level where momentum could slow.
The level becomes more relevant when several clues appear together:
Price is extended away from the Kijun-sen.
The Tenkan-sen begins to flatten.
The Chikou Span is blocked by previous price action.
A visible flat Senkou B level sits near the likely path of price.
Flat Senkou B is not a prediction. It is a reminder that markets often return to areas where balance was previously established.
🔄 3. The Kumo Twist Trap
A Kumo twist happens when the future cloud changes direction. Many traders treat it as an early trend-change signal. That can be dangerous.
A twist does not prove that a new trend has started. It shows transition. The market is moving from one condition to another, but control has not yet been clearly established.
That is why the reaction after the twist matters more than the twist itself.
If the future cloud turns bullish but price cannot hold above the current Kumo, the bullish case is weak. If the future cloud turns bearish but price quickly reclaims the cloud, the bearish case may be failing.
The better opportunity often appears after the first move fails. A failed bullish breakout can trap buyers. A failed bearish breakout can trap sellers. Once that happens, the opposite side may gain momentum.
The twist is a warning that conditions are changing. It is not, by itself, a reason to enter.
🛣️ 4. The Chikou Open-Road Setup
The Chikou Span is often ignored because it makes the chart look busier. That is unfortunate, because it can provide one of Ichimoku’s clearest filters.
The Chikou Span helps answer a practical question: does the trade have room to move?
When the Chikou Span is stuck inside previous price action, the market is moving through historical congestion. The trade may still work, but price is more likely to face pauses, reactions, and false starts.
A cleaner setup usually has more space:
For a long trade, the Chikou Span should ideally be above previous candles with open room ahead.
For a short trade, the Chikou Span should ideally be below previous candles with open room underneath.
This filter can save traders from many average setups. A Tenkan/Kijun cross may look good, but if the Chikou Span is trapped inside old candles, the trade may not have enough room to develop cleanly.
Good Ichimoku trades often look less crowded. The Chikou Span helps reveal that.
🎯 5. The Edge-to-Edge Cloud Move
Most of the time, trading inside the cloud is unnecessary. The Kumo represents uncertainty, and uncertainty often creates choppy price action.
There is one exception worth studying: the edge-to-edge cloud move.
This setup occurs when price enters the cloud with enough momentum to travel from one side of the Kumo toward the other. It is not a classic trend-following trade. It is more tactical. The trader is not trying to predict a major breakout; the trader is measuring whether price has a clean path through the cloud.
There are two common versions:
Bullish version: Price enters the cloud from below, the Tenkan-sen turns upward, the Kijun-sen stops falling, and the Chikou Span has enough room to move.
Bearish version: Price enters the cloud from above, the Tenkan-sen turns downward, the Kijun-sen stops rising, and the Chikou Span is not immediately blocked.
The opposite edge of the cloud becomes the natural target area. If the cloud is too thick, messy, or full of conflicting signals, the setup loses quality.
Inside the Kumo, guessing is dangerous. Measuring is essential.
📍 6. The Kijun Rejection Entry
The Kijun rejection is one of the cleaner Ichimoku continuation setups because it gives the trader a visible decision level.
The market is already trending. Price pulls back. Traders begin to question whether the move is over. Then price reaches the Kijun-sen, and the next reaction becomes important.
A touch of the Kijun-sen is not enough. Price can move through the Kijun-sen without hesitation. What matters is rejection.
A stronger Kijun rejection setup usually includes:
Price is above the cloud in a bullish trend or below the cloud in a bearish trend.
Price pulls back toward the Kijun-sen.
The market rejects the level with a clear candle close.
The Tenkan-sen confirms that momentum is recovering.
The invalidation level is clear before entry.
In a bullish setup, price should reject the Kijun-sen and hold above it. In a bearish setup, price should rally into the Kijun-sen and fail to break through with conviction.
The touch creates interest. The rejection creates the trade idea.
⚡ 7. The Thin Cloud Breakout
Thin clouds can be attractive because price appears to have less structure to break through. That is also the danger.
A thin Kumo can produce fast breakouts, but fast does not always mean reliable. In quiet market conditions, price can push through a thin cloud and quickly return inside it.
The better version of this setup needs expansion after the break.
Look for these conditions:
Price closes clearly outside the cloud.
The Tenkan-sen moves away from the Kijun-sen.
The future cloud supports the breakout direction.
The Chikou Span clears previous price action.
Candle bodies expand instead of shrinking.
A thin cloud gives price an opening. Expansion shows whether the market is accepting the breakout.
🪤 8. The Failed Cloud Breakout
Some of the most useful Ichimoku signals come from failure rather than confirmation.
A cloud breakout attracts traders. Price leaves the Kumo, and the market appears to have chosen direction. But if price quickly returns to the cloud, the breakout crowd may be trapped.
Two versions are worth watching:
Failed bullish breakout: Price breaks above the Kumo, fails to hold, and closes back inside or below the cloud.
Failed bearish breakout: Price breaks below the Kumo, sellers enter, but price recovers and closes back inside or above the cloud.
In both cases, the failed move can create pressure in the opposite direction. Traders who entered the breakout may need to exit, and that exit flow can add momentum to the reversal.
The useful question is not only whether price broke out. It is what happens if that breakout fails.
🇬🇧 9. The London Cloud Break
Forex trades around the clock, but not every hour offers the same quality of movement.
A cloud breakout during quiet liquidity is different from a cloud breakout during London or the London–New York overlap. Major pairs often behave more cleanly when participation is deeper and spreads are more stable.
One practical approach is to watch pairs that compress near the cloud before London. If price then breaks the Kumo with a clean close, Tenkan/Kijun alignment, and Chikou confirmation, the setup may have better follow-through than a signal that appears during a slow, illiquid period.
This is not a rule that works every time. It is a timing filter. Ichimoku provides the structure; the trading session can provide the fuel.
📰 10. The News Reset
High-impact news can make technical setups irrelevant within seconds.
Inflation data, employment reports, central-bank decisions, and policy comments can push price straight through the cloud, the Kijun-sen, and nearby support or resistance. Trying to predict the first reaction is usually closer to gambling than analysis.
A more disciplined approach is to wait for the reset.
A simple reset process looks like this:
Let the first news spike finish.
Watch how price behaves around the Kijun-sen.
Check whether price reclaims or rejects the cloud.
Use the Chikou Span to confirm whether the move has room.
Trade the market’s decision after the shock, not the shock itself.
The first move after news is often emotional. The second move can reveal whether the market accepts or rejects the new price level.
🧭 11. The Higher-Timeframe Kijun Anchor
A lower-timeframe Ichimoku signal can look excellent and still be badly positioned.
The reason is usually higher-timeframe structure.
For example, a one-hour chart may show a bullish signal, but if the four-hour Kijun-sen sits directly above price, the trade is moving into resistance. The signal may still work, but the setup is not as clean as it first appears.
A better structure appears when the timeframes support each other. For example, the daily trend is bullish, price pulls back toward the four-hour Kijun-sen, and the one-hour chart then gives a bullish recovery above the cloud.
In that case, the lower timeframe is not fighting the higher timeframe. It is helping refine the entry.
Use the higher-timeframe Kijun-sen as the anchor. Use the lower timeframe for timing.
💥 12. The Cloud Compression Breakout
Some of the strongest moves begin from conditions that look uninteresting.
The cloud becomes thin. The Tenkan-sen and Kijun-sen flatten. Price moves sideways. The Chikou Span gets tangled in previous candles. Many traders stop paying attention.
Then volatility returns.
This is the cloud compression breakout. The setup begins with contraction and becomes interesting only when price breaks the structure with confirmation.
The main signs are:
Price compresses around the cloud.
Volatility drops.
The Tenkan-sen and Kijun-sen move close together.
The future Kumo becomes thin.
Price breaks the structure with a strong close.
The Chikou Span clears congestion.
Patience is important here. Compression can last longer than expected. Entering too early often means sitting inside noise. The trade becomes more attractive only when expansion begins.
🛑 13. The No-Trade Signal
One of the most valuable Ichimoku signals is the one that tells the trader to stay out.
If price is inside a thick cloud, the Tenkan-sen and Kijun-sen are flat, the Chikou Span is trapped, and the future cloud keeps twisting, the market is not offering a clean edge. It is offering noise.
No trade is not a lack of discipline. It is discipline.
Warning signs include:
Price is trapped inside a thick Kumo.
The Tenkan-sen and Kijun-sen are flat and tangled.
The Chikou Span is buried inside previous price action.
The future cloud keeps changing direction.
A major news event is close.
The higher timeframe disagrees with the lower timeframe.
The reward-to-risk profile is weak.
A trader who avoids poor setups is already improving the quality of their decision-making before placing the next trade.
✅ Final Checklist Before Taking an Ichimoku Trade
Before entering an Ichimoku-based Forex trade, these questions are worth answering:
Is price clearly above or below the cloud?
Is the signal aligned with the higher timeframe?
Is the Chikou Span free, or is it blocked?
Is price near the Kijun-sen, or dangerously extended?
Does the future cloud support the trade direction?
Is the setup forming during a liquid trading session?
Is high-impact news close?
Is the invalidation level clear?
Does the potential reward justify the risk?
Is this trade necessary, or is it only activity?
🏁 Final Word
Ichimoku is often presented as a complicated indicator, but its real value is straightforward. It helps traders understand whether the market is trending, balanced, stretched, compressed, or transitioning.
The edge is not hidden in a single crossover. It comes from context.
A basic trader asks whether Ichimoku says buy or sell. A more selective trader asks whether the entire structure supports the idea.
Is price in the right location?
Is momentum clean?
Is the Chikou Span free?
Is the Kijun-sen acting as support or resistance?
Is the higher timeframe aligned?
Is the trade worth the risk?
Those questions matter more than the signal itself.
In Forex, better decisions usually matter more than more decisions. Ichimoku does not remove uncertainty, but it can help traders see the market with more structure. Sometimes, that structure is the difference between taking a trade and avoiding one.
📝 Editor’s Note
The strategies and market concepts discussed in our content are designed to help readers better understand market behavior. They are not trading recommendations. Financial markets are volatile, and every trader should test ideas carefully, manage risk and make independent decisions.