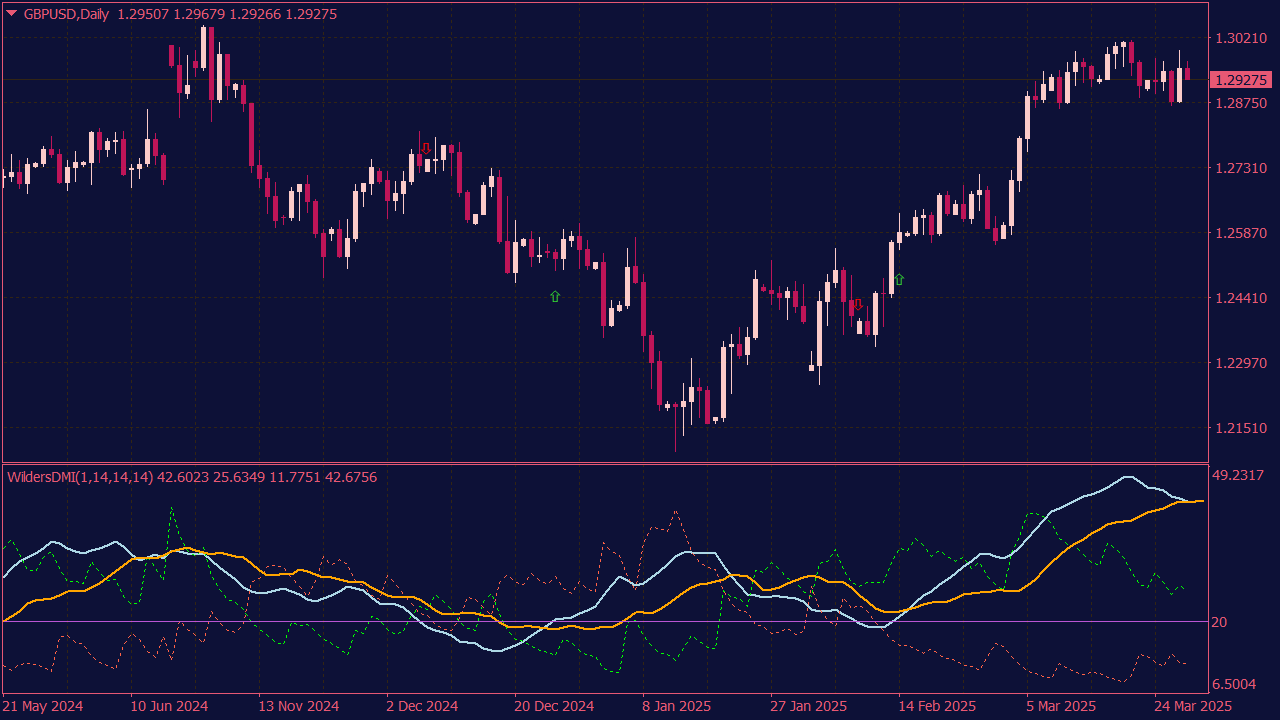
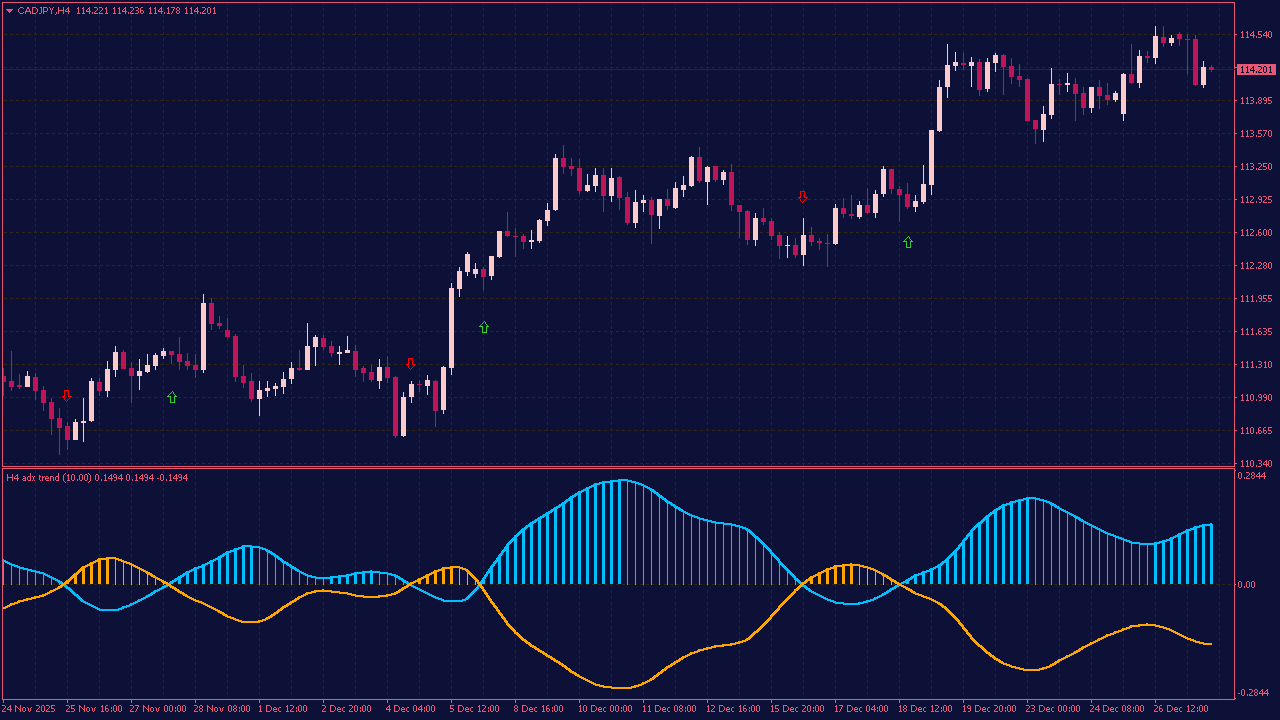
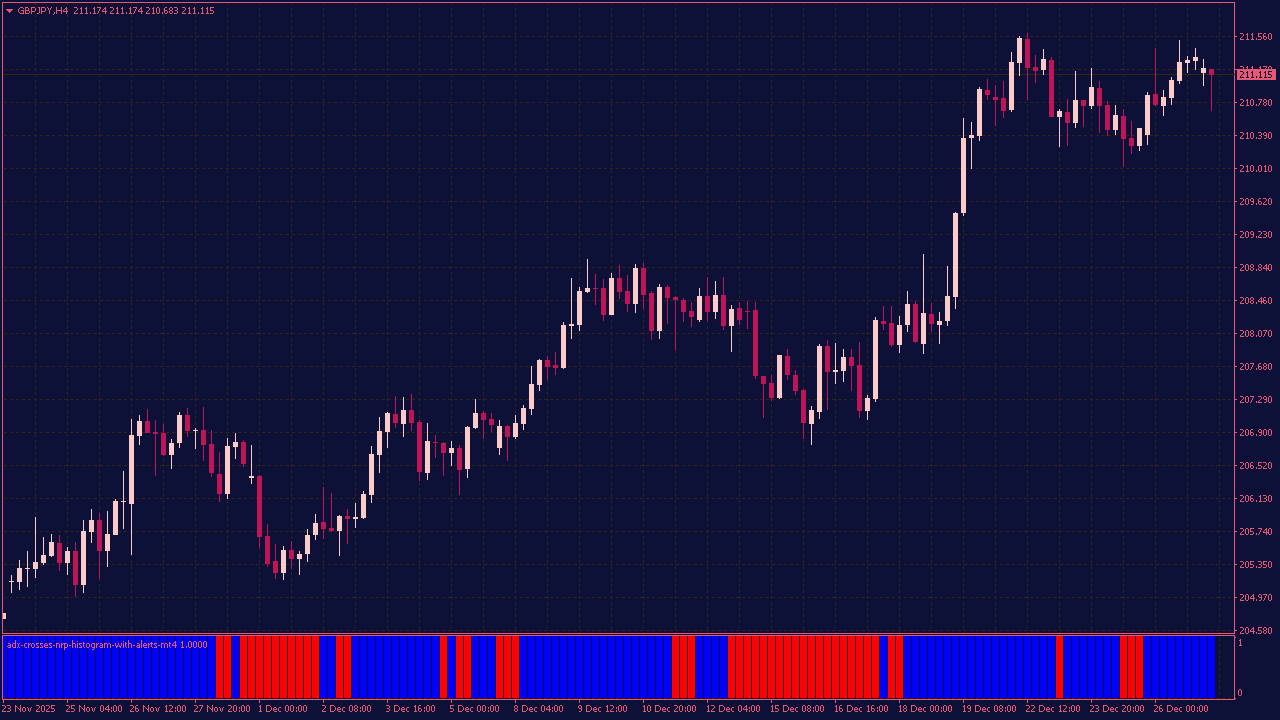
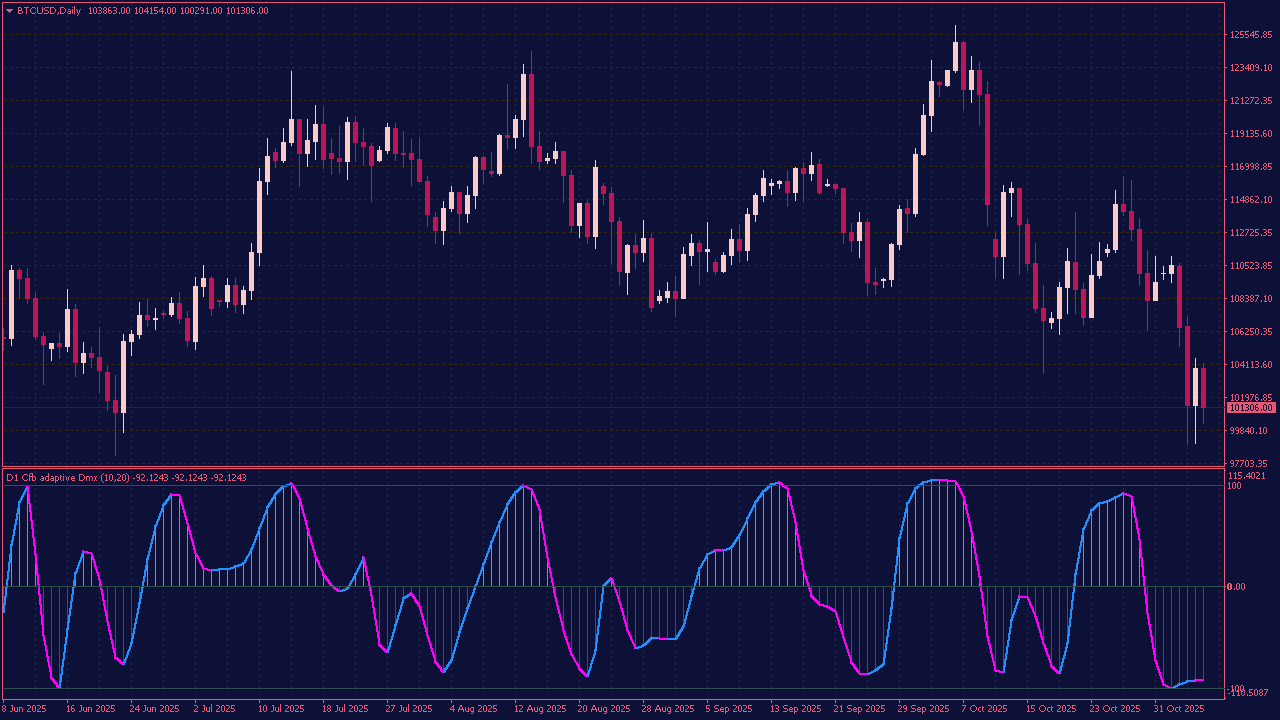
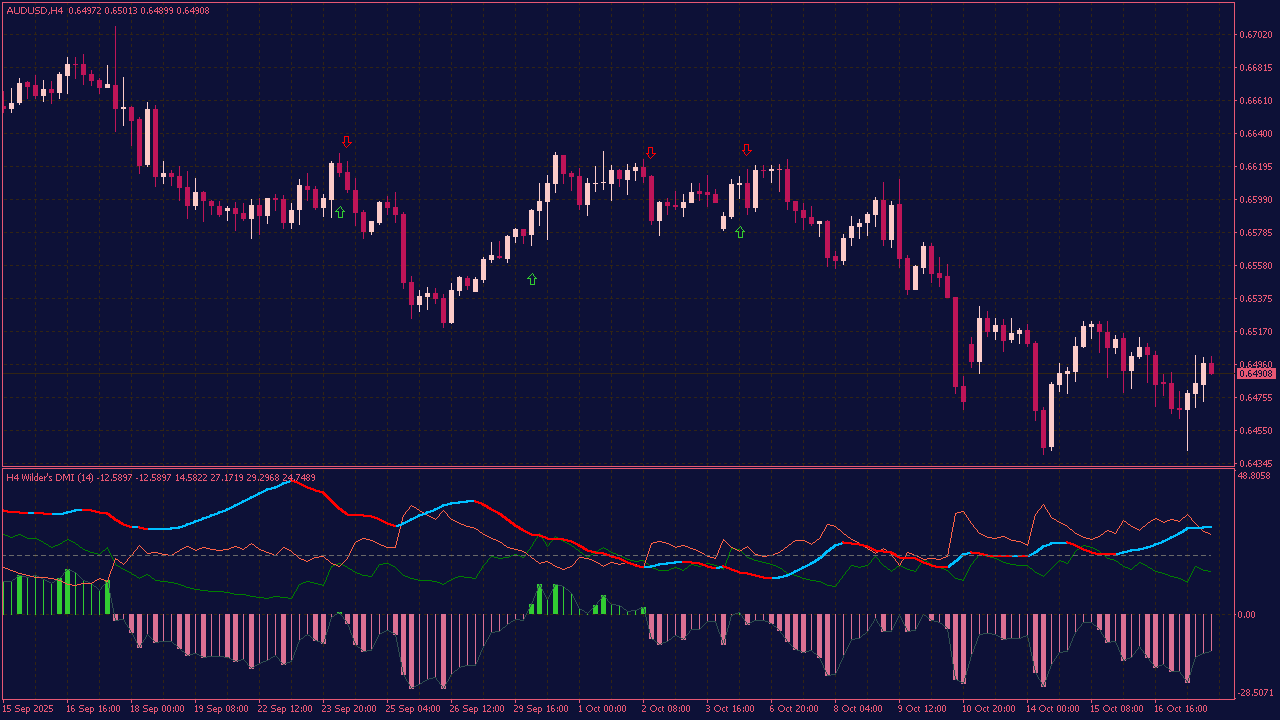
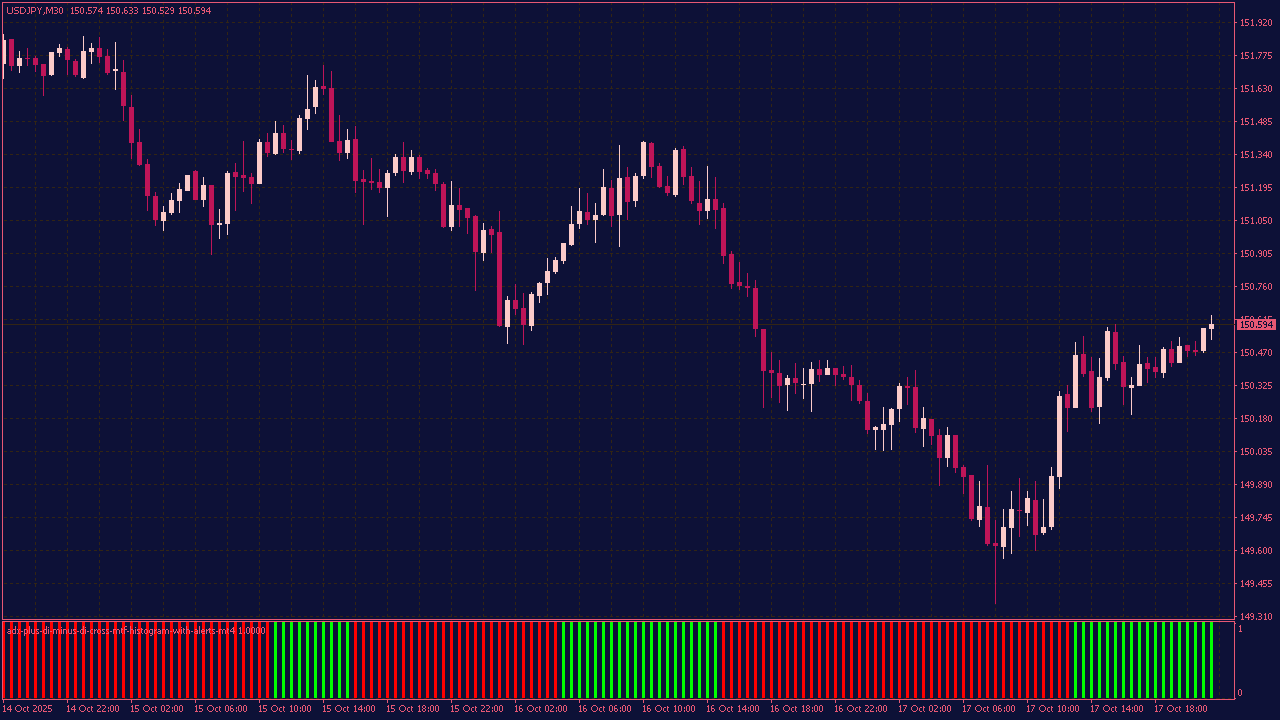
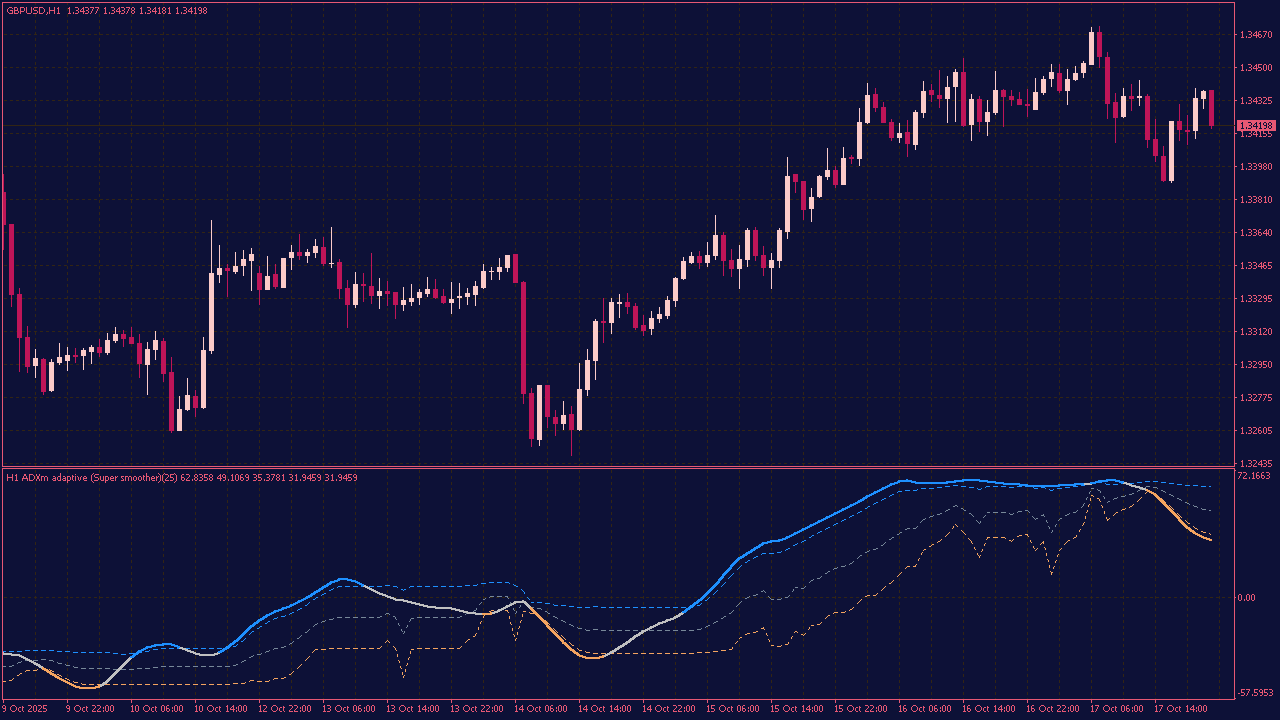
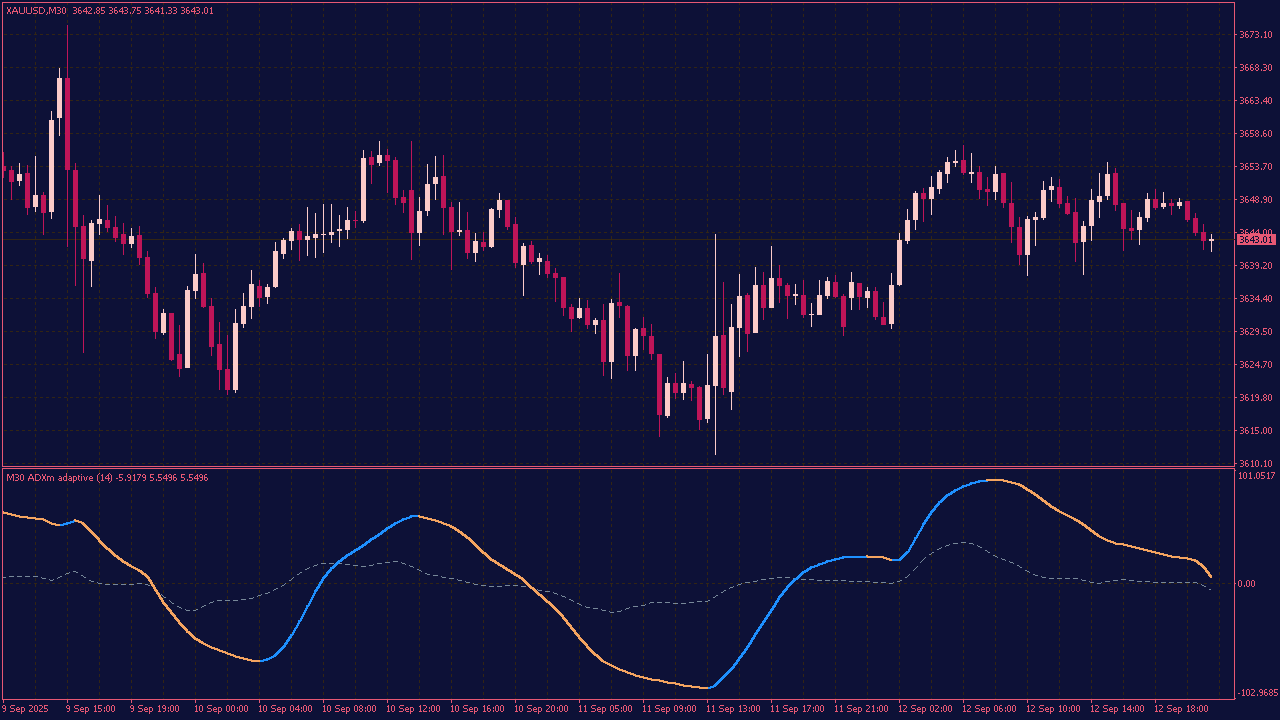
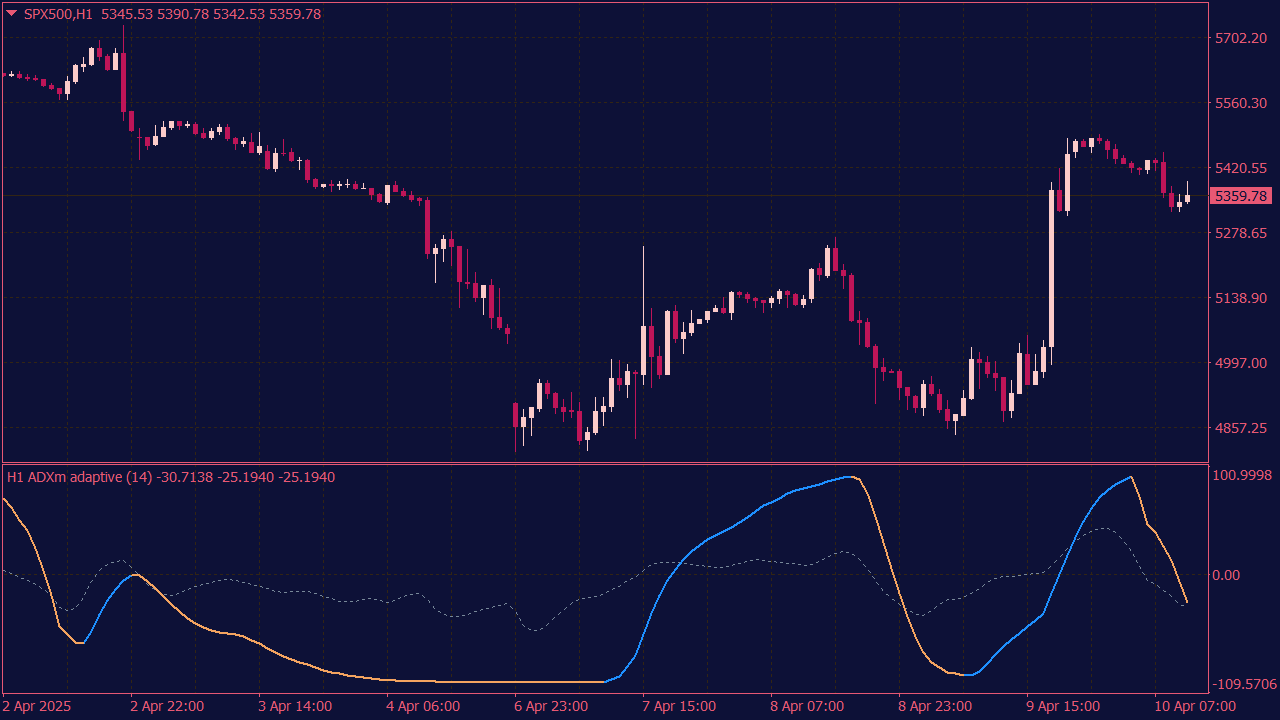
ADXm with Arrows and Floating Levels
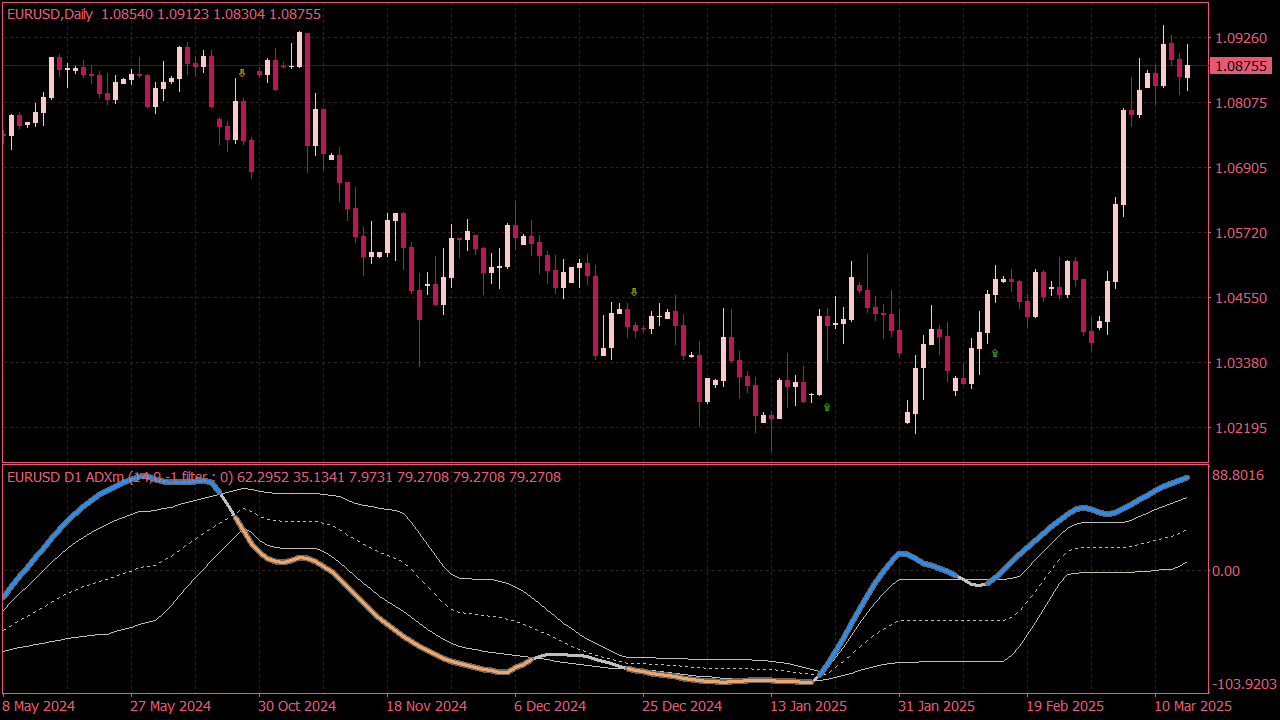
The ADXm with Arrows and Floating Levels is a technical indicator that enhances the Average Directional Index by adding visual arrows to signal potential trend direction changes and floating levels that dynamically adjust to market conditions. It helps traders easily identify trend strength and momentum shifts, making entry and exit decisions clearer.