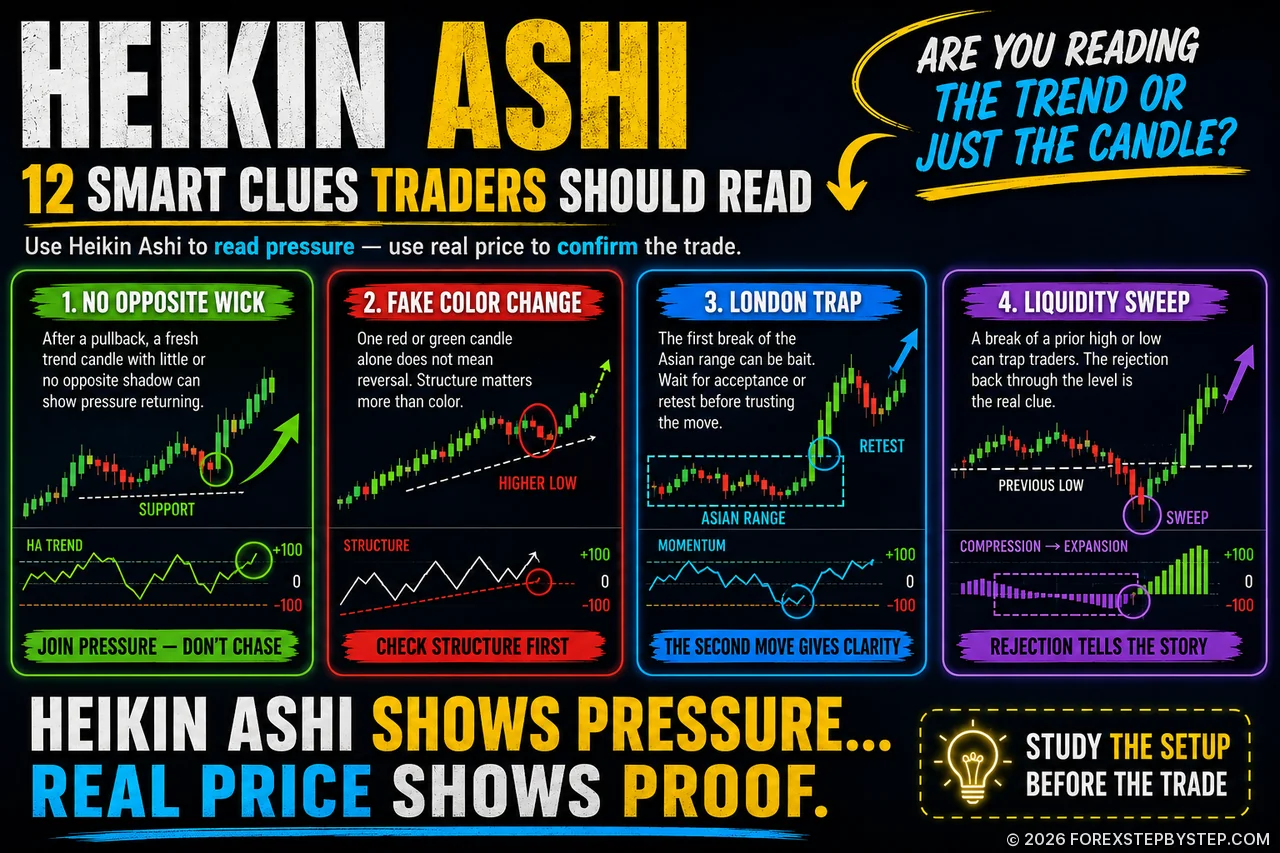
The chart looks clean — but the real Heikin Ashi clue appears only after pressure meets structure.
🧲 The Clean Candle Trap: What Heikin Ashi Really Reveals
Most traders like Heikin Ashi for one obvious reason: the chart looks cleaner. Fewer messy candles, fewer emotional spikes, fewer reasons to second-guess every move.
But that clean look can also be the trap. Heikin Ashi does not simply tell you when to buy or sell. It shows when pressure is building, when a pullback still looks harmless, and when a move that appears strong may already be losing energy.
Inside the full article, we look at the setups traders often recognize too late: fake color flips, wickless trend runs, London session traps, liquidity sweeps, exhaustion clusters, and the moments when doing nothing is the smarter trade.
Before trusting the next smooth candle, ask the harder question: is the market really moving, or is someone about to get caught on the wrong side?
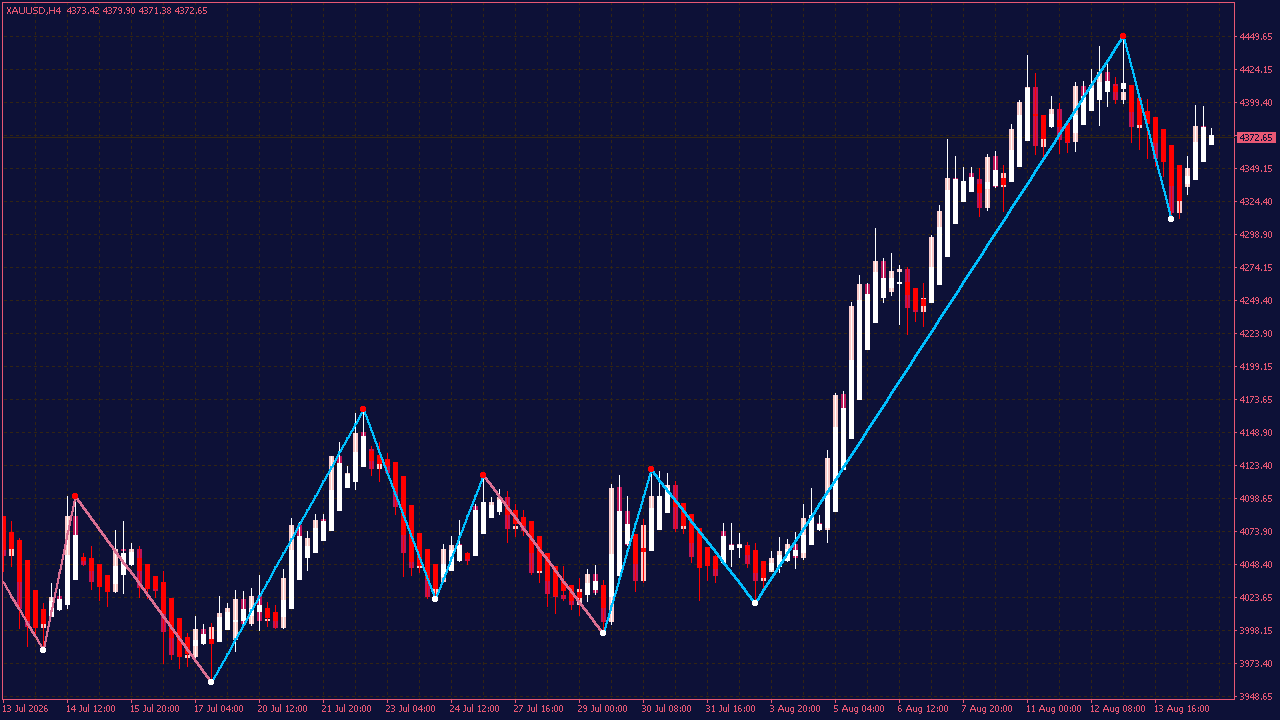
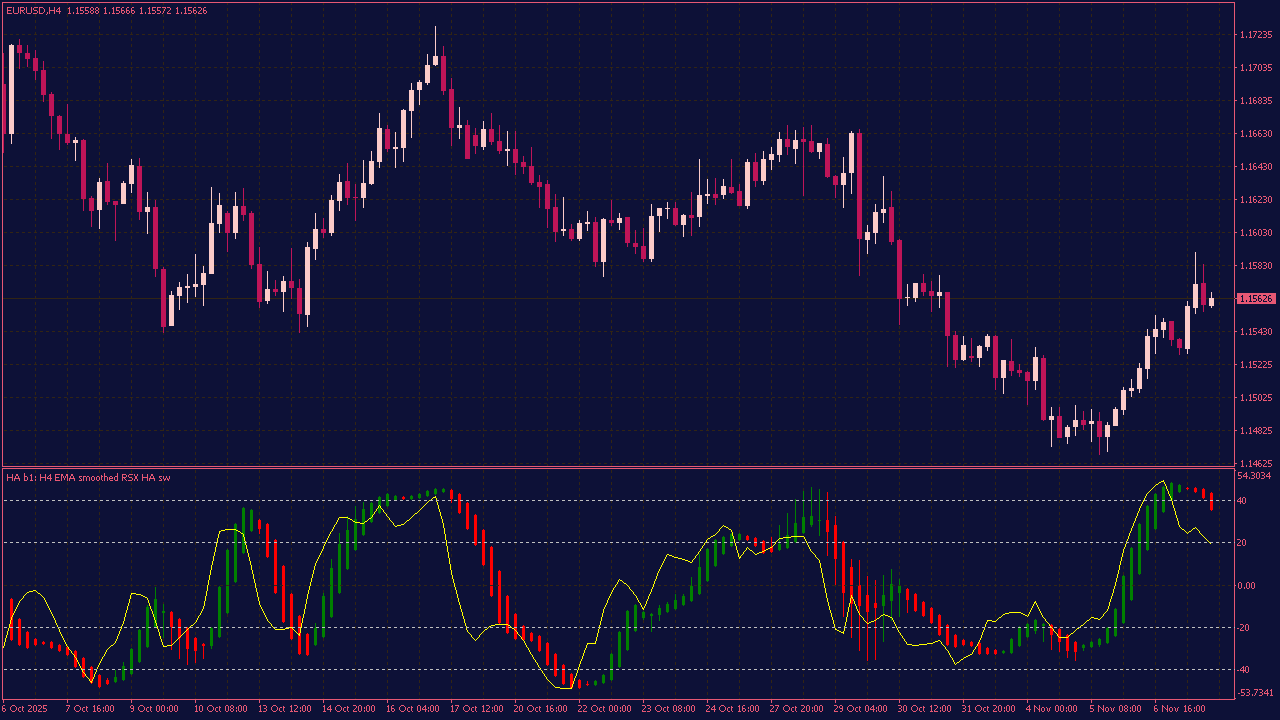
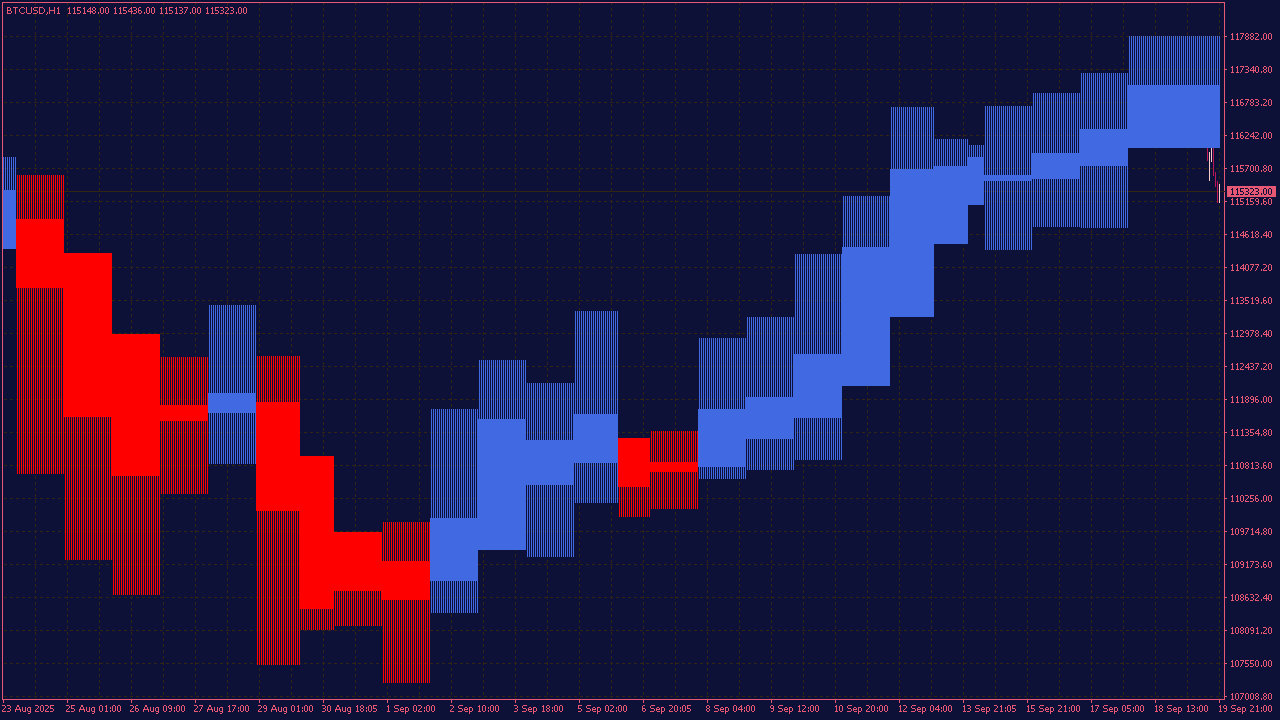
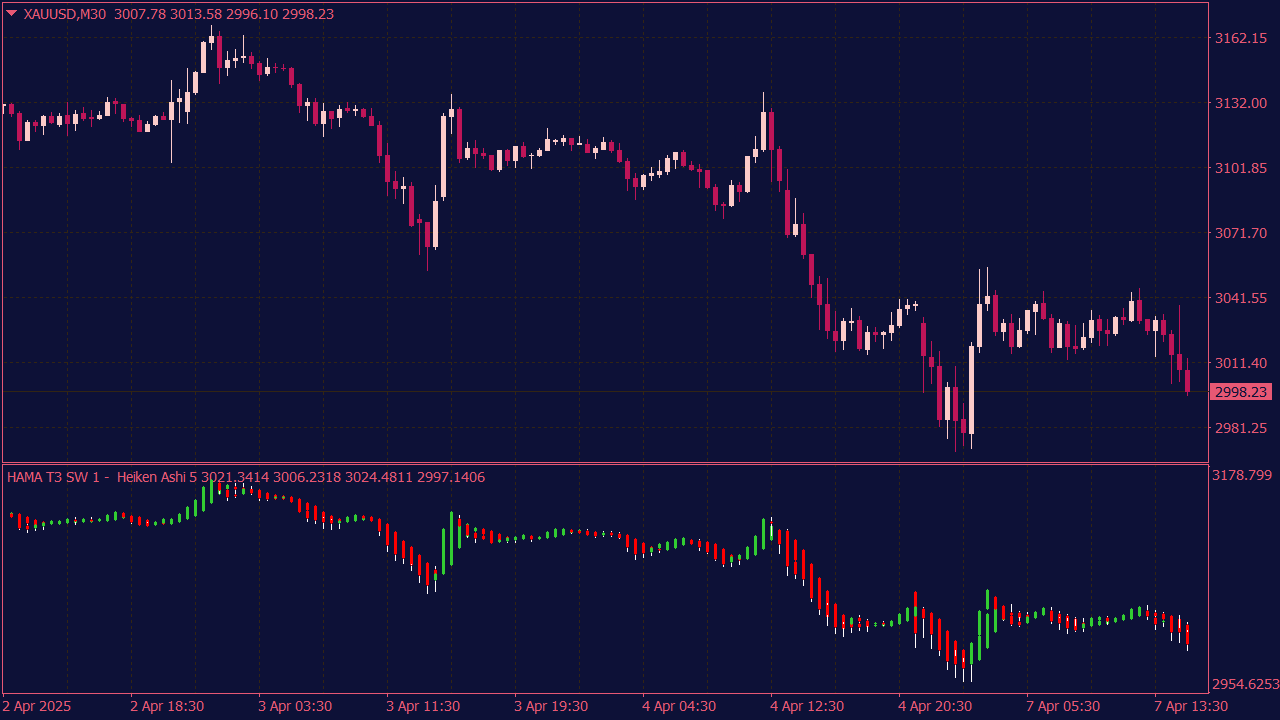
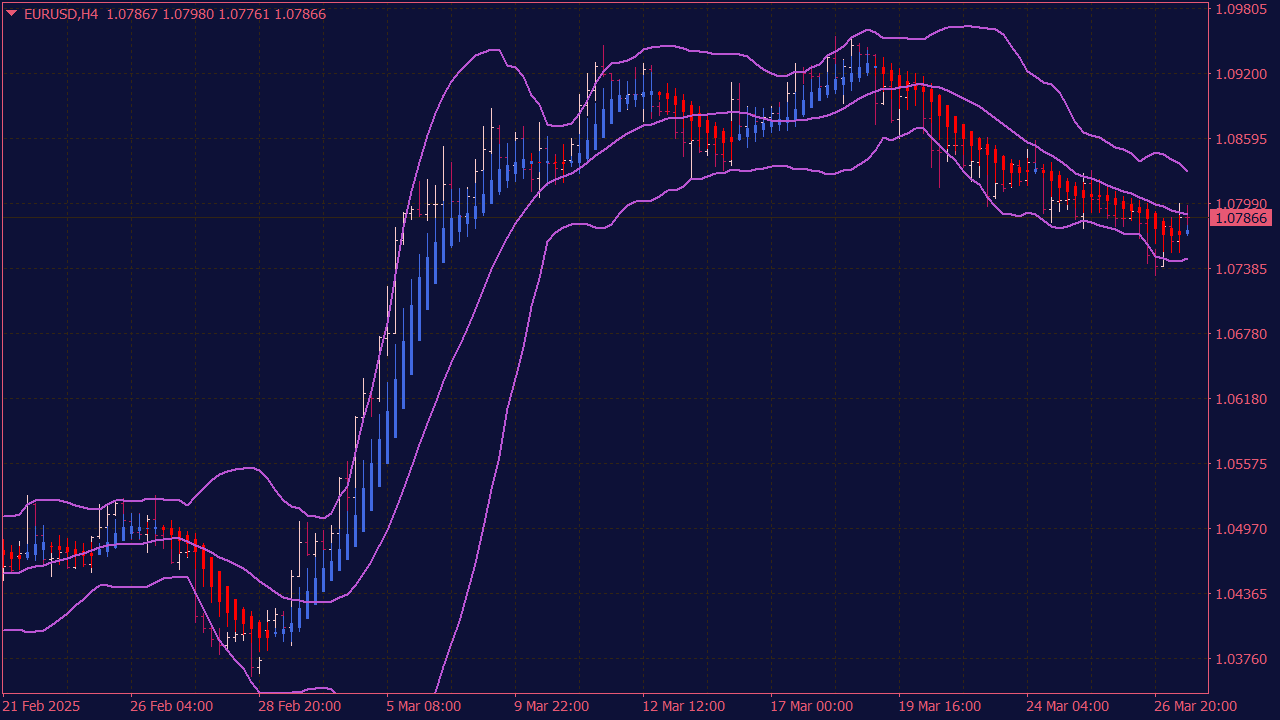
The Heikin Ashi with ZigZag Indicator gives you a cleaner way to see what price is really doing. Heikin Ashi candles smooth out some of the noise, while the ZigZag highlights the more important highs and lows. Instead of getting distracted by every small move, you can focus on the swings that actually shape the market. What makes this combination useful is the way both elements work together. The ZigZag shows where meaningful turning points have formed, while the Heikin Ashi candles help you follow momentum and direction more easily. Trends, pullbacks and changes in market structure can become much clearer without filling the chart with unnecessary signals. The interesting part begins when the candles start changing around an important swing point. Sometimes a small shift in structure can say more than a long sequence of ordinary candles. It won’t tell you exactly what happens next, but it can help you notice the moments that are worth watching more closely.
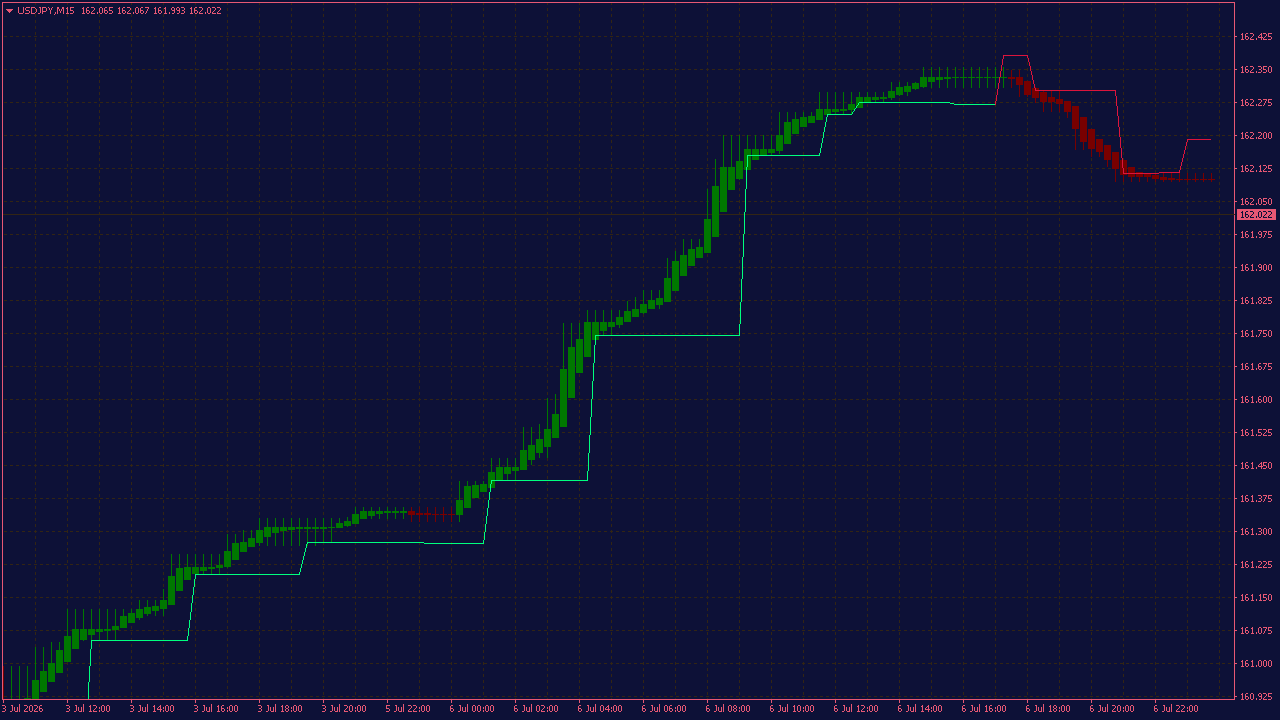
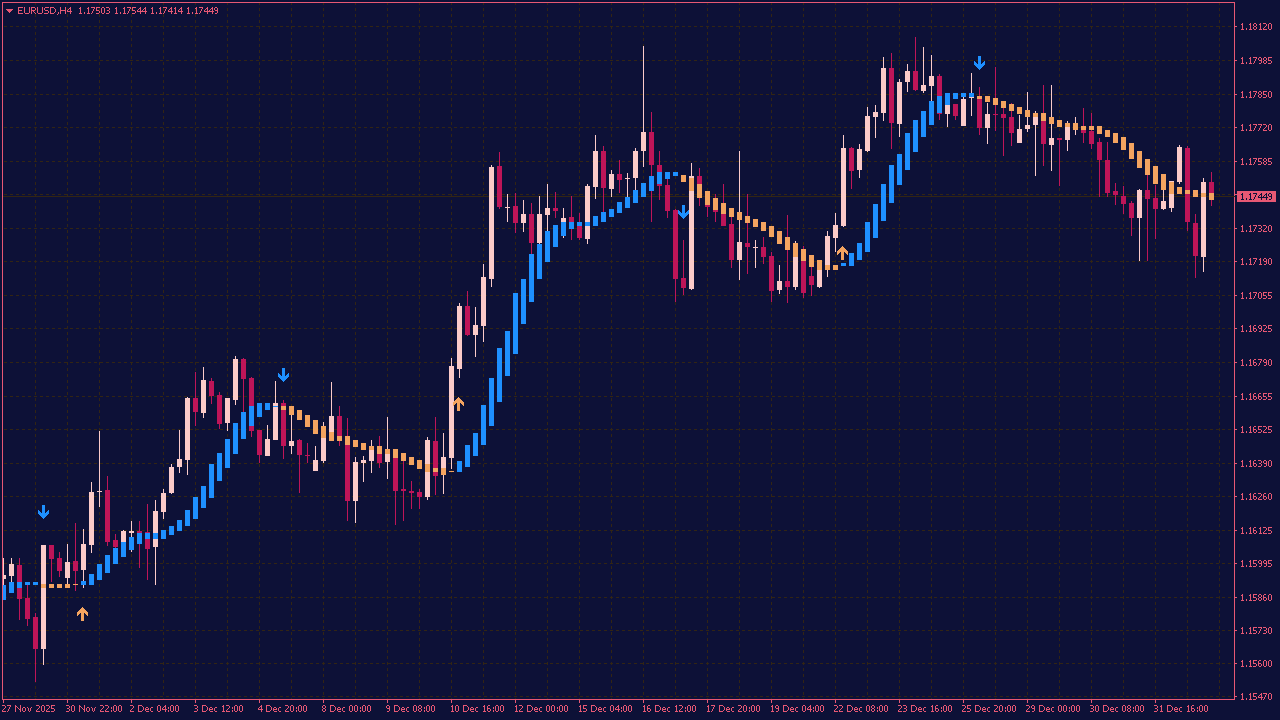
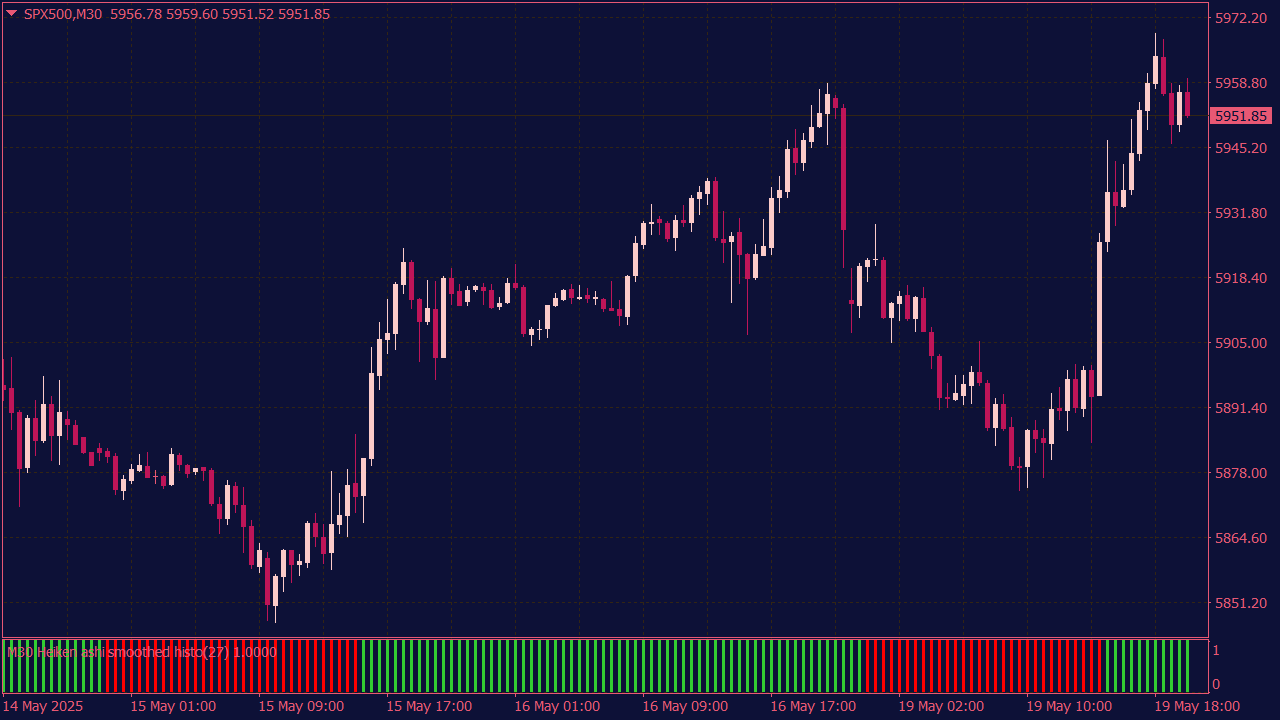
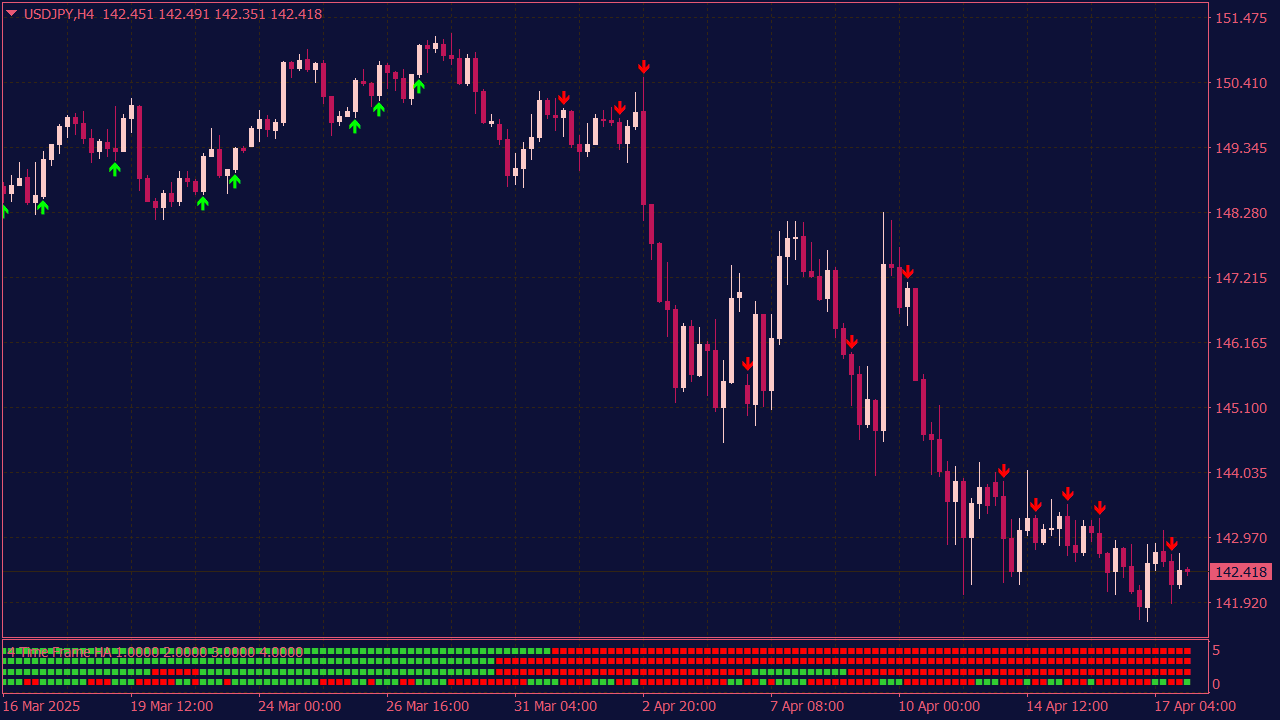
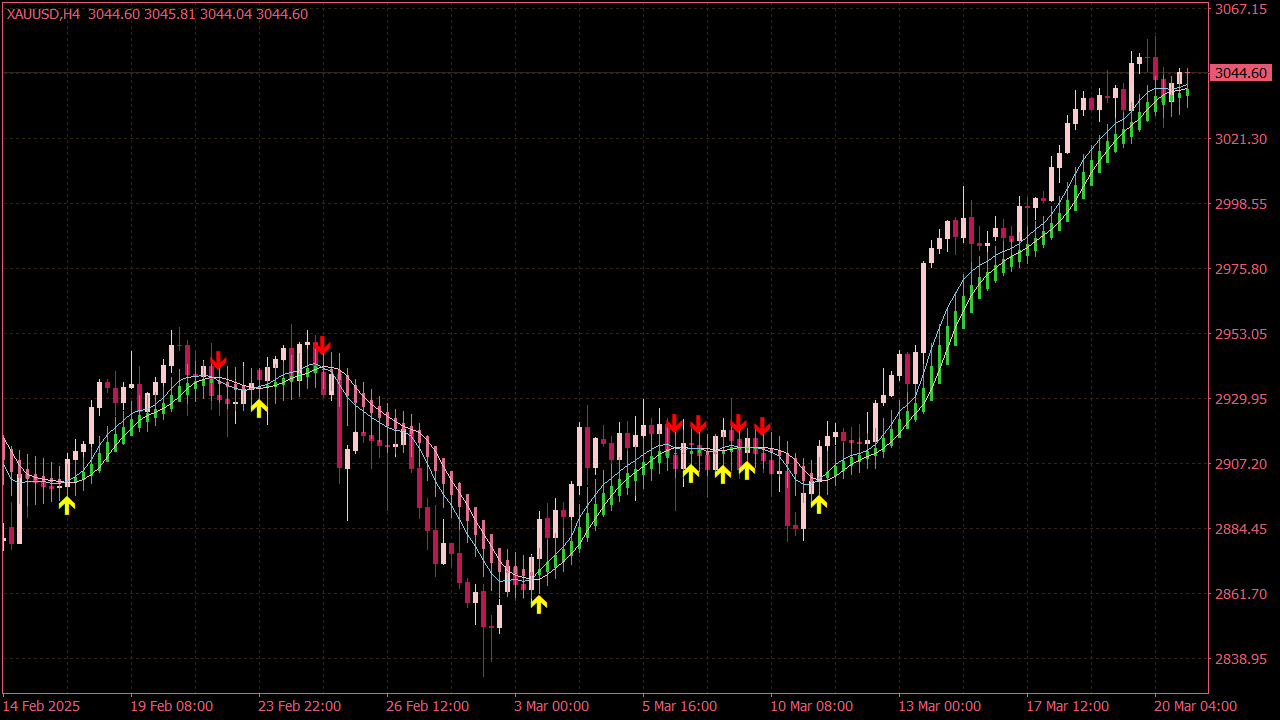
The Heikin Ashi Indicator with Halftrend is a simple but useful indicator for traders who want to read trend direction in a cleaner way. It combines the smooth look of Heiken Ashi candles with Half Trend signals and pivot-style levels. The main idea behind the indicator is to reduce some of the noise that often makes charts difficult to read. Instead of reacting to every small candle, traders can focus more on the overall market direction and the points where price behavior starts to change. This makes the indicator interesting for anyone who likes to spot trends early and follow how momentum develops. Sometimes the chart gives small clues before a larger move begins, and this tool can help make those moments easier to notice.
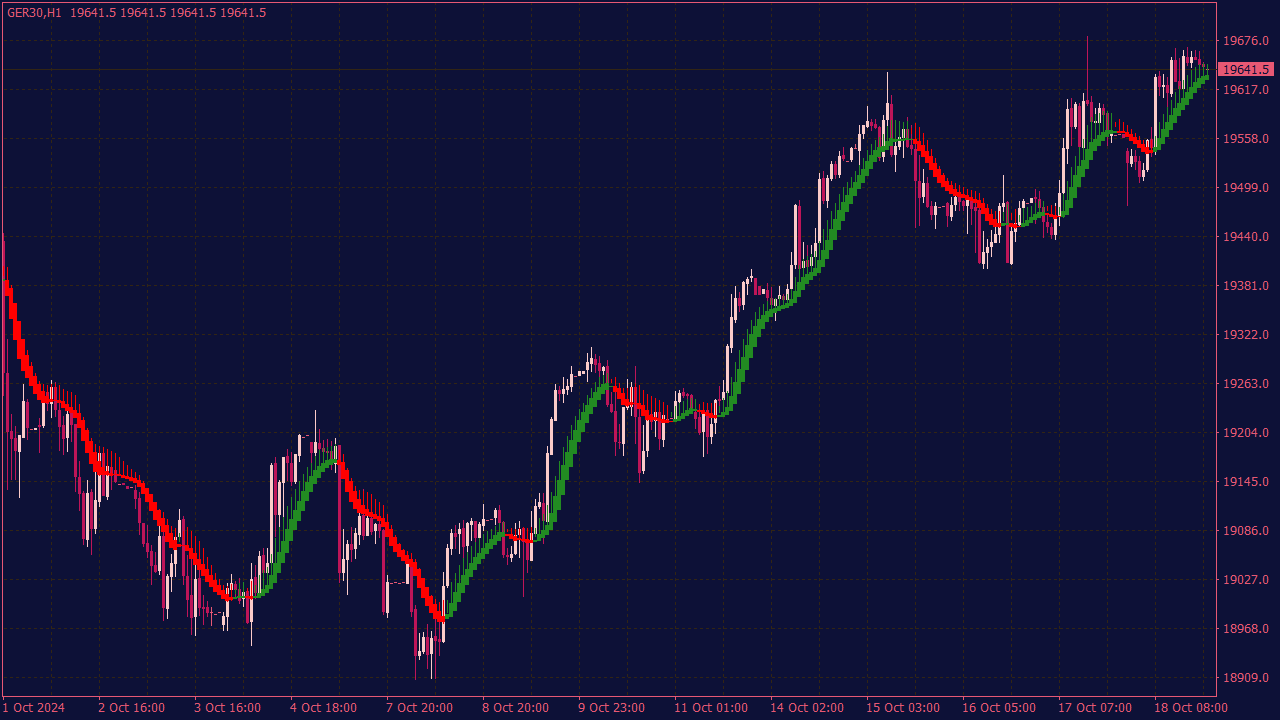
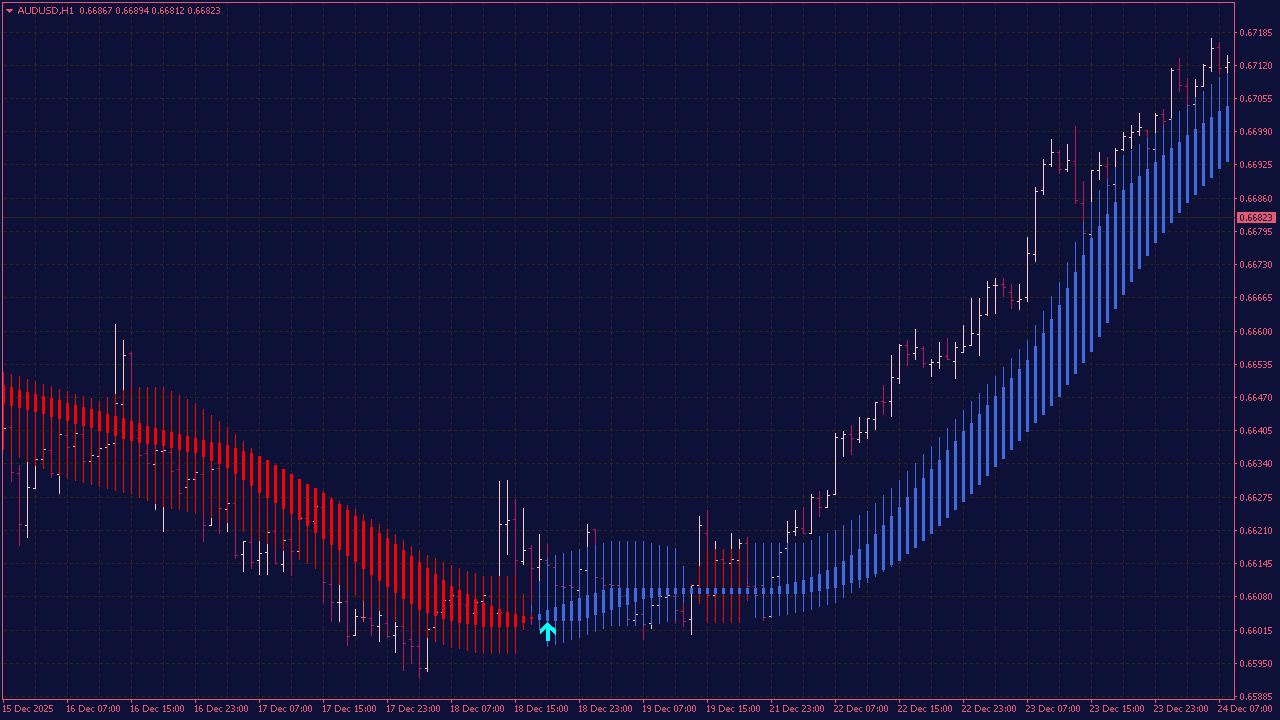
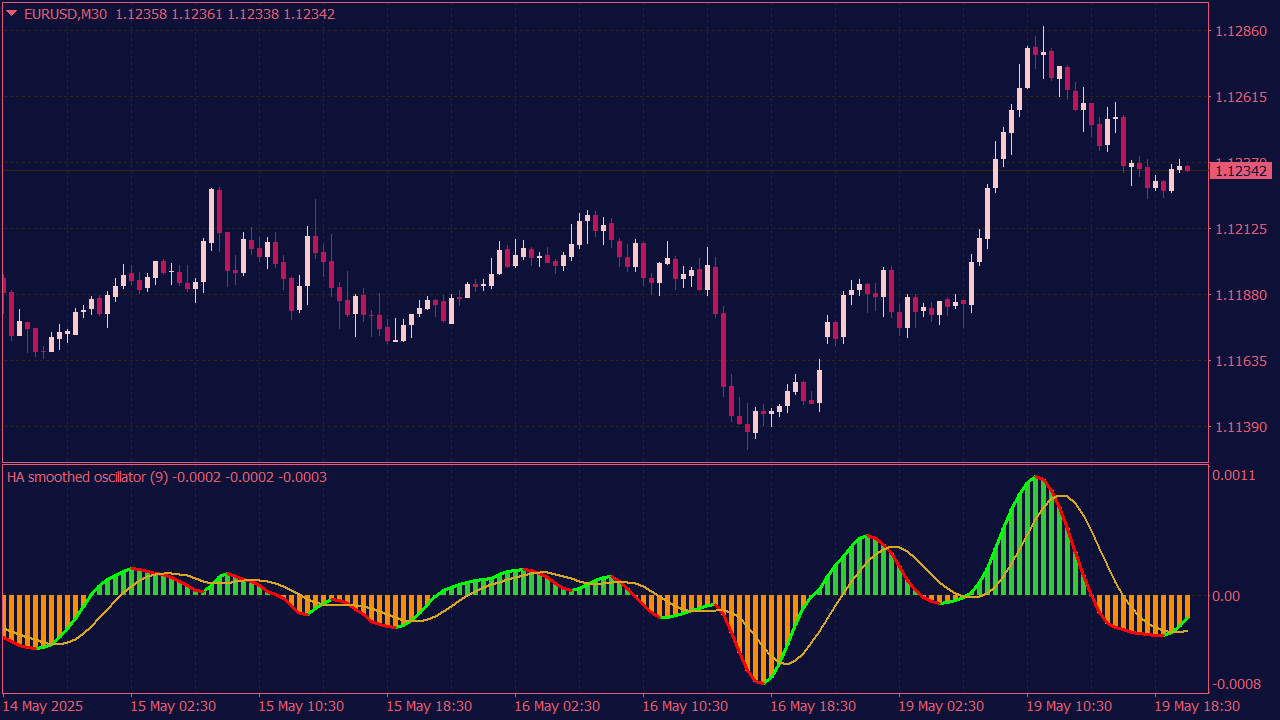
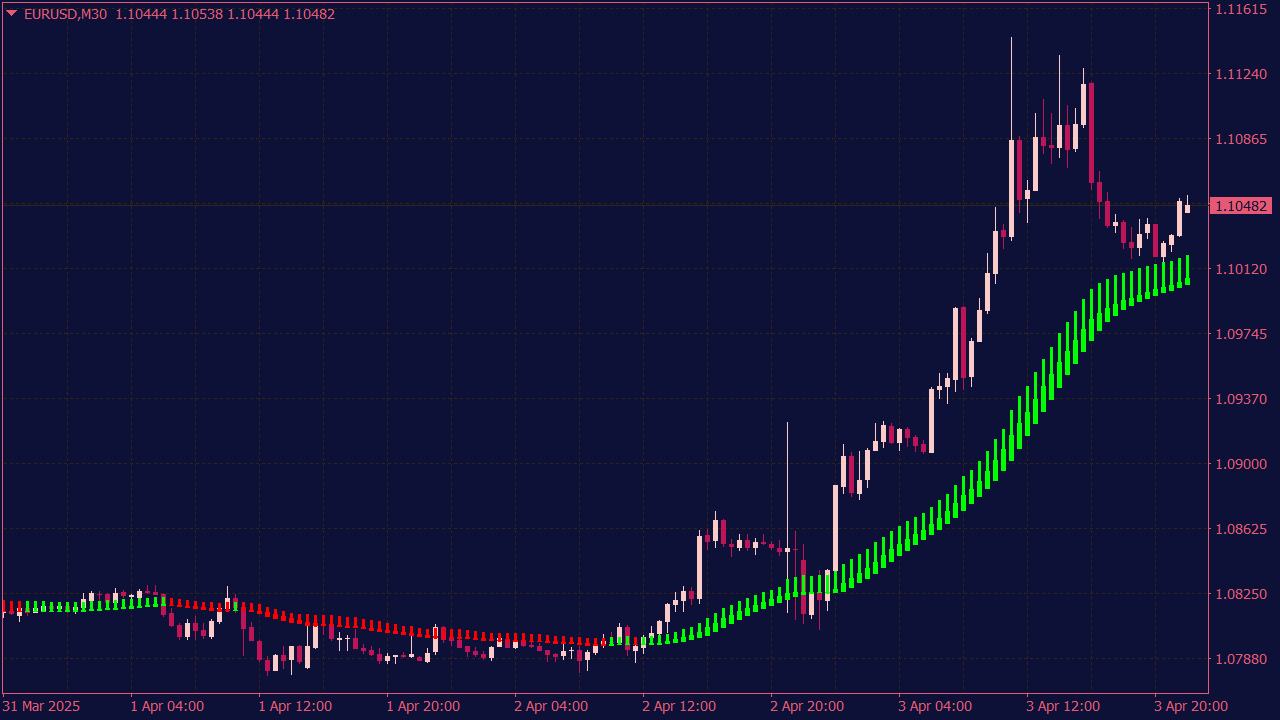
The Heikin Ashi Smoothed Indicator is a modified version of the traditional Heikin Ashi candles, designed to provide a clearer view of market trends by reducing noise and smoothing price action. Long signals typically arise when the Smoothed Heikin Ashi candles turn green, indicating bullish momentum, along with a rising trend in the smoothed moving average. Conversely, short signals are generated when candles turn red, suggesting bearish momentum, particularly when coupled with a declining trend in the moving average. This indicator is often used in conjunction with other technical analysis tools to validate entry and exit points in trades.
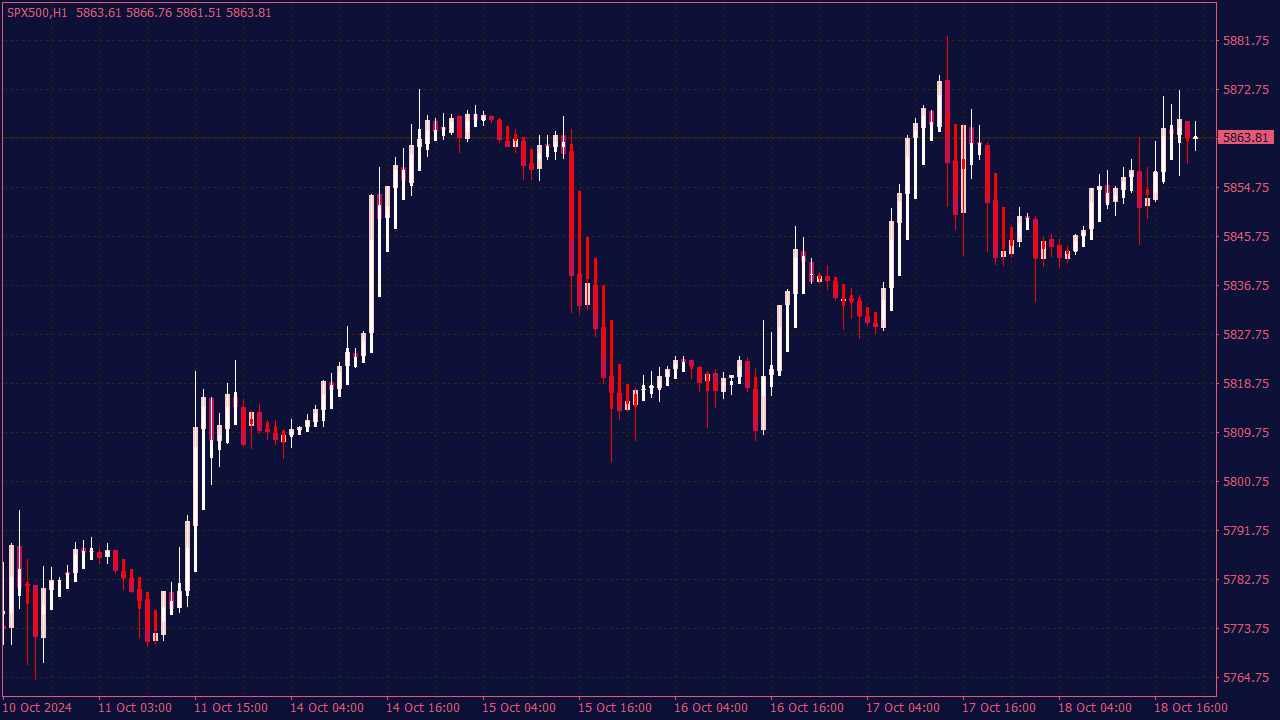
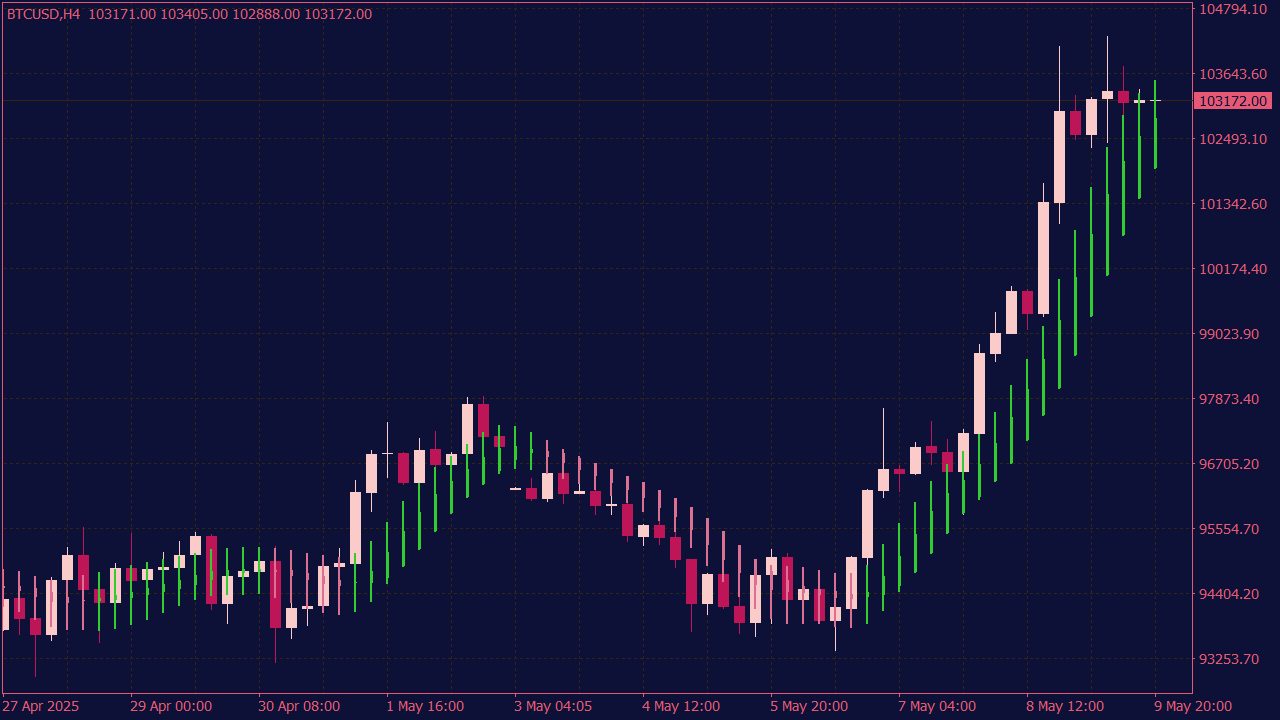
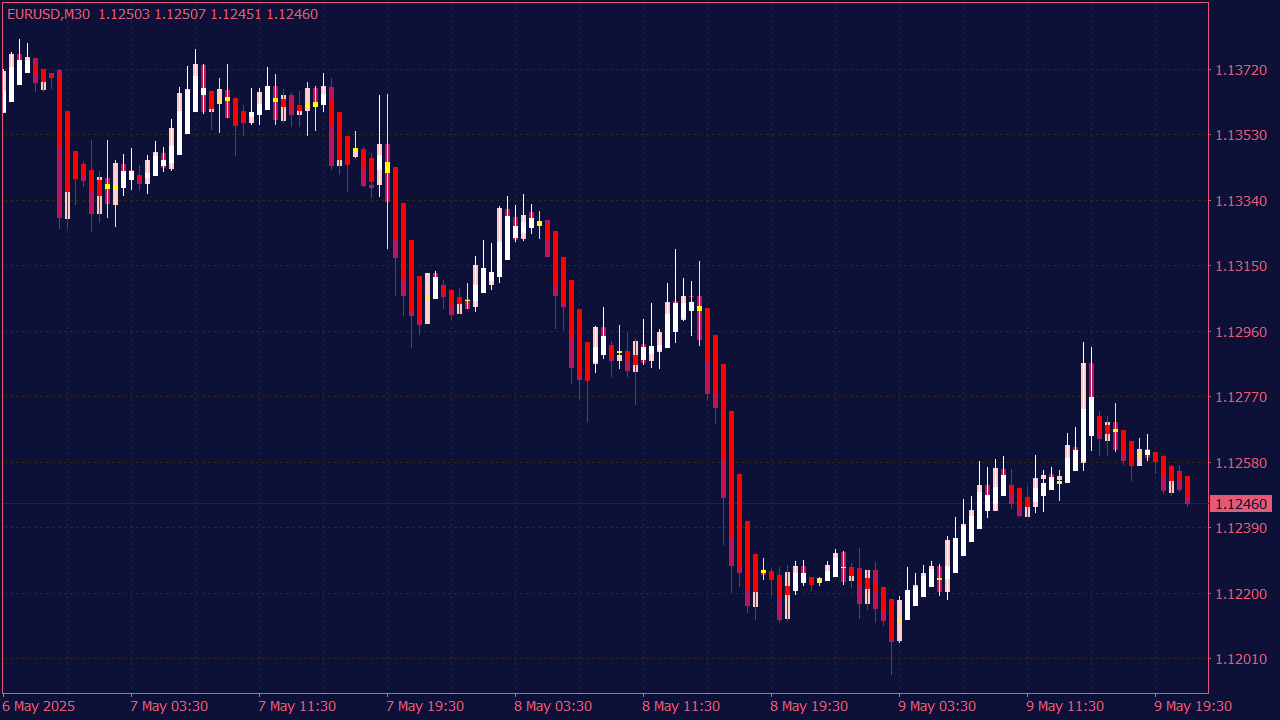
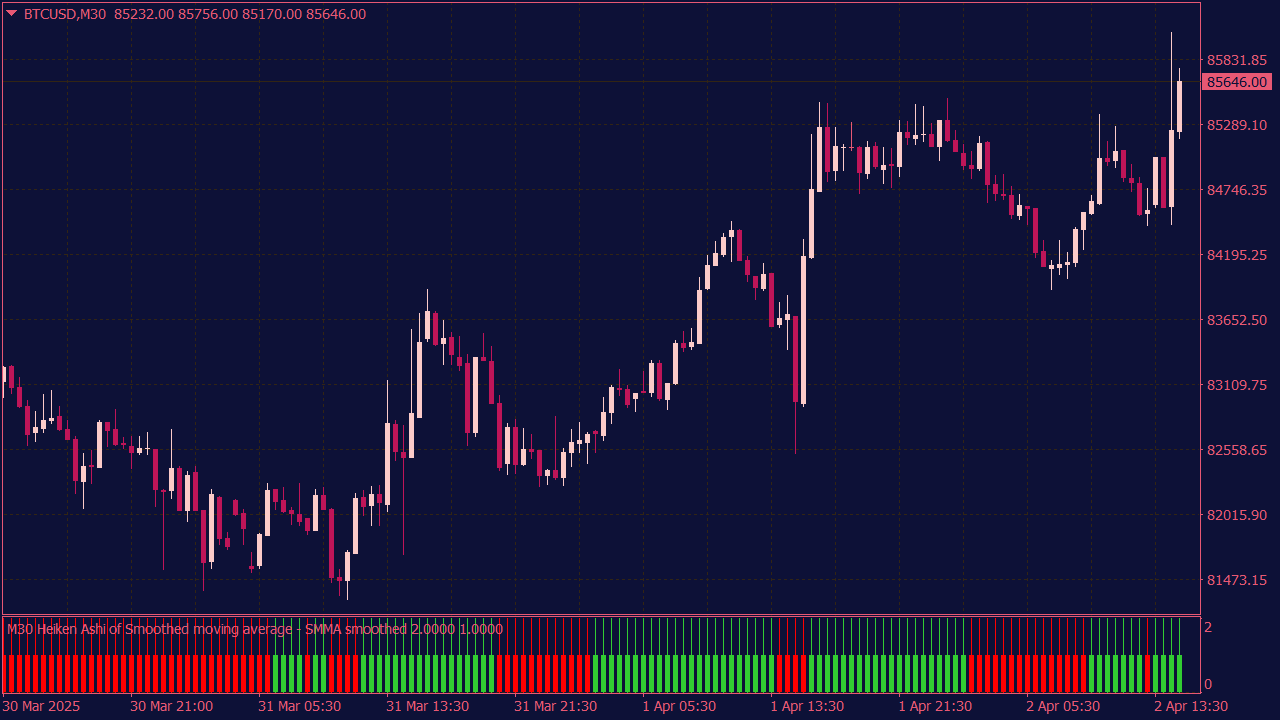
Heikin Ashi is a popular trading technique that uses modified candlestick charts to identify trends and potential trade setups. To generate trade signals, traders typically look for consecutive white (bullish) or red (bearish) candles indicating trend strength. A common strategy involves entering a long position when the Heikin Ashi candles transition from red to white, suggesting a potential uptrend, and exiting when the candles turn red again. Conversely, traders may enter short positions when candles change from white to red, indicating a downtrend. Additionally, incorporating support and resistance levels, as well as other indicators like moving averages, can enhance the reliability of Heikin Ashi trade setups.
📊 Heikin Ashi for Forex Traders: The Setups Most People Notice Too Late
There is something almost suspicious about how clean a Heikin Ashi chart looks.
After staring at normal candlesticks for years — the spikes, the false breaks, the ugly pullbacks, the candles that look bullish for 20 minutes and then close like a disaster — Heikin Ashi can feel like someone finally turned down the noise.
That is useful. But it is also dangerous.
A smooth chart can make a messy market look more controlled than it really is. And that is where many traders get into trouble. They see a row of green candles and think the market is safe. They see the first red candle and think the trend is over. Both reactions are too simple.
Heikin Ashi is not a signal machine. It is not an entry button. It is not a shortcut around experience.
Its real value is different: it helps a trader read pressure. It shows when a trend is still breathing, when a pullback is weak, when momentum is fading, and when the chart is simply not clean enough to trade.
⚠️ First, the Rule Most Traders Skip
Before looking at any Heikin Ashi setup, one thing has to be clear: Heikin Ashi candles are not normal price candles.
They are calculated from averaged price data. That is why they look smoother. But it also means the candle you see may not represent the exact price where you can enter, exit, or place a stop.
In Forex, that detail matters. Spread, slippage, session liquidity, and news volatility can turn a good-looking chart setup into a poor real trade.
The basic rule is simple:
Use Heikin Ashi to read market pressure.
Use normal candlesticks to confirm real price structure.
Use the bid/ask price before placing any order.
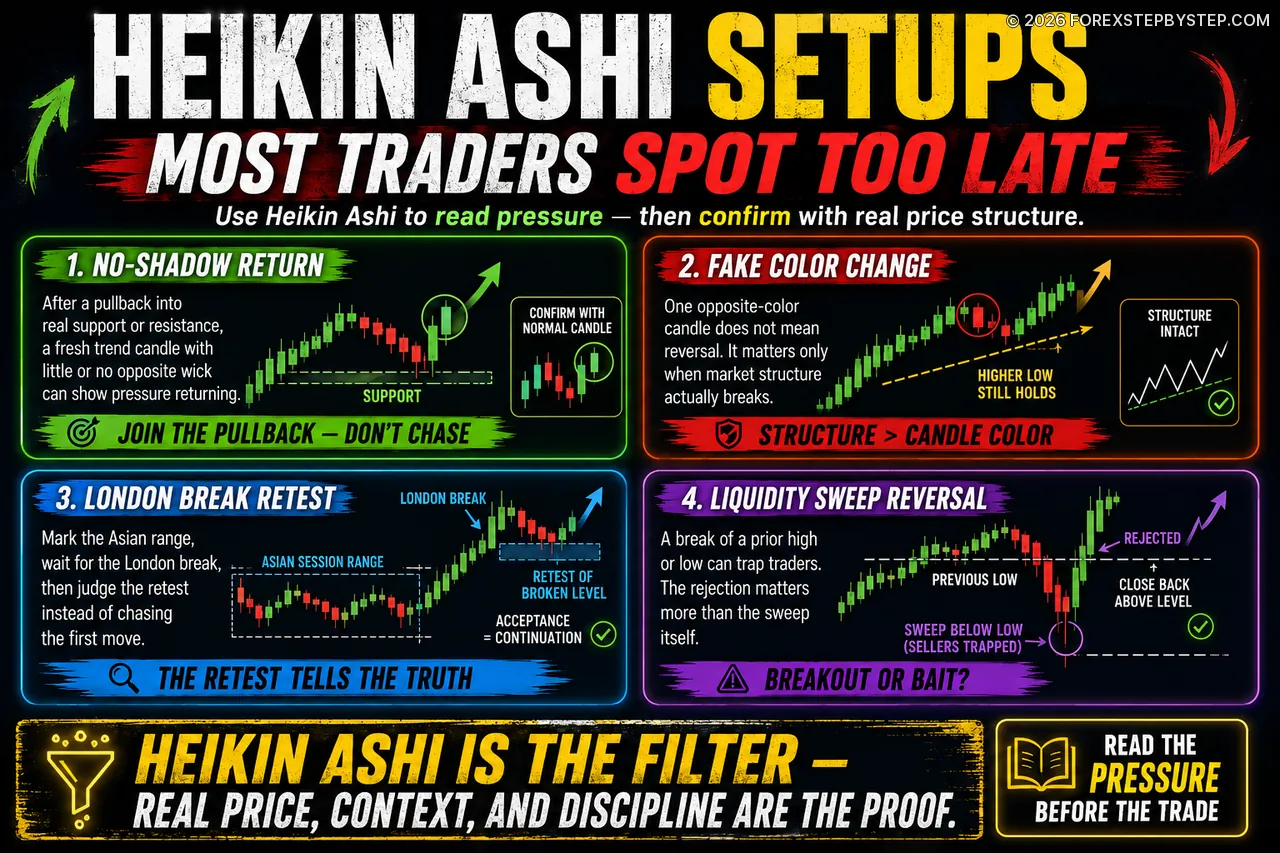
Heikin Ashi is the filter. Real price is the evidence.
🕯️ 1. The Candle That Has No Shadow
One of the strongest Heikin Ashi clues is not the candle color. It is what the candle is missing.
In a strong bullish move, Heikin Ashi candles often appear with little or no lower wick. In a strong bearish move, they often appear with little or no upper wick. That missing shadow tells you the opposite side is barely making an impact.
Most traders spot this too late. They see five strong candles in a row and jump in just as the move is becoming stretched.
The better opportunity often comes after the market pulls back.
The higher timeframe shows a clear trend.
Price pulls back into a real support or resistance area.
Heikin Ashi candles shrink during the pullback.
A fresh candle appears in the trend direction with little or no opposite wick.
The normal candlestick chart confirms that structure is still holding.
That is the difference between chasing and joining.
A strong candle after a pullback carries more information than a strong candle after an extended run. The first may signal renewed pressure. The second may simply be late traders arriving at the worst possible place.
🔄 2. The Fake Color Change
This is where Heikin Ashi tricks impatient traders.
A bullish trend prints a red candle, and suddenly everyone becomes nervous. A bearish trend prints one green candle, and traders start calling a reversal. But a color change by itself means very little.
The real question is not: Did the candle change color?
The real question is: Did the market actually change behavior?
In an uptrend, one or two red Heikin Ashi candles may simply show a pullback. If the normal chart is still holding higher lows, buyers may still be in control. In a downtrend, a few green candles may only be short covering or a weak bounce into resistance.
A color change becomes more serious only when price breaks structure.
In a bullish trend, watch whether the previous higher low breaks.
In a bearish trend, watch whether the previous lower high breaks.
If structure holds, the color change may be noise.
This is why many traders exit good positions too early. They react to the candle, not to the market.
💤 3. The Dead Candle
Some candles look boring. They are not.
A small Heikin Ashi candle with wicks on both sides after a strong move can be one of the most important candles on the chart. It tells you the move is no longer clean. Buyers and sellers are starting to fight. Momentum is no longer one-sided.
This does not mean you should instantly reverse the trade. That is a common mistake.
The Dead Candle is not an entry signal. It is a warning light.
If you are already in profit, it may be time to protect something. Take partial profit, tighten the stop, or stop adding to the position. If you are not yet in the trade, it may be better to wait.
A clean trend has rhythm. A Dead Candle interrupts that rhythm.
Sometimes the most professional thing a trader can do is nothing.
🇬🇧 4. The London Trap
Forex traders love the London open for a reason. Liquidity returns, spreads often become more attractive on major pairs, and the market starts moving with more intent.
But London also creates traps.
During the Asian session, many pairs form a range. Then London opens, price breaks above the Asian high or below the Asian low, and traders rush in. Sometimes the break continues. Other times, it is only a liquidity grab before price snaps back.
The sharper version is not to trade the first break blindly. Wait for the market to prove whether the break is accepted.
Mark the Asian session high and low.
Wait for London to break one side of the range.
Do not chase the first candle.
Watch for a retest of the broken level.
Use Heikin Ashi to judge whether pressure remains in the breakout direction.
The retest is where the story becomes more interesting.
If price breaks higher, retests the old Asian high, and Heikin Ashi turns bullish again, the move has more credibility. If price breaks higher and immediately falls back inside the range, the breakout may have been bait.
In Forex, the first move often gets attention. The second move often gives information.
🧲 5. The Liquidity Sweep Reversal
A new high is not always strength. A new low is not always weakness.
That sentence alone can save traders from many bad breakout entries.
Forex markets often move toward obvious liquidity. Previous highs, previous lows, round numbers, session levels, and yesterday’s high or low are places where stop orders and breakout orders tend to gather.
Sometimes price breaks those levels only to reject them almost immediately.
A bullish liquidity sweep may look like this:
Price breaks below a visible previous low.
Sellers enter late, expecting continuation.
Stops below the low are triggered.
Price fails to continue lower.
Heikin Ashi begins to lose bearish strength.
The normal candlestick chart closes back above the broken level.
The sweep alone is not the trade. The rejection is the important part.
A bearish version works the other way around: price breaks above a previous high, fails to hold, and then closes back below the level. Heikin Ashi may begin printing smaller candles, opposite wicks, or a color shift.
The crowd sees a breakout. The prepared trader asks who just got trapped.
👀 6. The Two-Chart Rule
Heikin Ashi makes charts look calm. Sometimes too calm.
That is why every serious Heikin Ashi idea should pass the Two-Chart Rule.
The Heikin Ashi chart must show pressure.
The normal candlestick chart must show proof.
If Heikin Ashi looks bullish but the normal chart is rejecting a major resistance zone, the setup is not clean. If Heikin Ashi turns bearish but normal candles are still holding higher lows, the bearish signal may be weak.
This rule removes many attractive but low-quality trades.
Heikin Ashi can help you see the direction more clearly. It cannot replace price structure. The normal chart still tells you where the market actually traded, where buyers defended, where sellers reacted, and where stops logically belong.
The filter is useful. The evidence is essential.
🎵 7. The Three-Candle Rhythm
One candle can lie. Two candles can tease. Three candles start to show rhythm.
The Three-Candle Rhythm is not a mechanical rule. It is a discipline tool. It keeps traders from entering just because one candle looks good.
The best version appears after a pullback into an area that already matters: support, resistance, a previous breakout zone, a moving average, a session level, or somewhere with context.
Then the rhythm builds:
The first candle suggests direction is returning.
The second candle shows follow-through.
The third candle confirms pressure, ideally with a stronger body or reduced opposite wick.
This is not about waiting forever. Wait too long, and the trade becomes late. But one strong candle in the middle of nowhere is not enough.
A good setup should make sense from more than one angle. Heikin Ashi gives the rhythm. Structure gives the location.
🔥 8. The Exhaustion Cluster
Trends rarely die in one candle. Most of them start to look tired first.
Heikin Ashi makes that fatigue easier to see. After a long move, candles may become smaller. Opposite wicks may appear more often. Colors may start alternating. Price may still be moving in the same direction, but the quality of the move changes.
That change matters.
An exhaustion cluster does not automatically mean “reverse now.” Calling tops and bottoms too early is one of the fastest ways to give back profits.
Use exhaustion differently:
If you are already in the trade, protect profit.
If you are looking for a fresh entry, stop chasing.
If you want a reversal, wait for real structure to break.
The Exhaustion Cluster is not the trade. It is the warning before the trade.
It tells you the easy part of the move may already be over.
📰 9. The News Reset
Heikin Ashi is useful when the market has rhythm. Major news often destroys rhythm.
Interest rate decisions, inflation data, employment reports, central bank press conferences, and unexpected geopolitical headlines can make Forex pairs move violently in both directions. During those moments, technical signals can become unreliable, and spreads can widen.
The beginner tries to predict the first news candle.
The better trader waits for the News Reset.
Avoid fresh entries right before high-impact news.
Let the first violent reaction happen.
Mark the post-news high and low.
Wait for the spread and volatility to calm down.
Use Heikin Ashi only after cleaner directional candles return.
The first move after news is often emotion. The second phase is usually more readable.
There is no shame in missing the first spike. Many of those spikes are not trades; they are traps wearing a nice candle.
🚪 10. The ATR Escape Door
Entries are exciting. Exits pay the bill.
Heikin Ashi can help traders stay in trends longer, but that same strength can become a weakness. Because the candles are smoothed, a reversal may appear late. By the time the color changes clearly, part of the profit may already be gone.
That is why a volatility-based exit plan can help.
ATR is not magic, but it gives a rough sense of how much a pair normally moves. A stop that is too tight gets hit by normal noise. A stop that is too wide turns a controlled trade into a hope-based position.
The idea is simple:
Let Heikin Ashi help you stay with clean trend pressure.
Use real swing highs and lows for stop placement.
Use volatility to avoid obvious noise zones.
Reduce risk when Heikin Ashi shows exhaustion and price moves against the trade.
A trader without an exit plan is not trading a setup. They are waiting to see how they feel later.
That rarely ends well.
🧭 11. The Higher-Timeframe Permission Slip
A lower-timeframe Heikin Ashi signal can look perfect and still be a bad trade.
Usually, the reason is simple: it is fighting the bigger move.
Before taking a 15-minute setup, look at the one-hour and four-hour charts. Before taking a one-hour setup, look at the four-hour and daily charts. The higher timeframe does not need to agree perfectly, but it should not be clearly against you.
A bullish lower-timeframe setup is stronger when the higher timeframe is already bullish or pulling back inside a larger uptrend. A bearish lower-timeframe setup is stronger when the higher timeframe is bearish or rejecting resistance.
This filter will reduce the number of trades.
Good.
Most traders do not need more trades. They need fewer average ones.
🚫 12. The No-Trade Setup
This may be the most underrated Heikin Ashi setup: no trade.
It sounds boring, but it is one of the clearest signs of maturity. The market does not pay traders for being active. It rewards traders for taking risk only when the situation is worth it.
Skip the trade when:
Heikin Ashi candles keep changing color every few bars.
Candle bodies are small, messy, and inconsistent.
Price is trapped in the middle of a range.
A major news event is about to be released.
The spread is wider than usual.
There is no logical place for a stop-loss.
The higher timeframe is unclear.
This is not hesitation. This is selectivity.
Heikin Ashi is useful because it can show when a market is clean. But it is just as useful when it tells you the market is not worth touching.
🧠 Final Thought
The worst way to use Heikin Ashi is to ask: Is the candle green or red?
That question is too small.
Better traders ask different questions:
Where is this signal happening?
Is the higher timeframe supporting it?
Is this a real breakout or a liquidity trap?
Is momentum expanding or fading?
Does the normal candlestick chart confirm it?
Is the risk clean enough to justify the trade?
Heikin Ashi will not make Forex trading easy. Nothing does.
But it can slow the chart down. It can reduce emotional reactions. It can help traders stay with clean trends and step away from ugly ones. In a market where leverage, speed, and noise can punish impatience quickly, that is already valuable.
The candle is not the edge. The edge is reading the candle in the right place, at the right time, with enough discipline to do nothing when the market is not clear.
📝 Editor’s Note
The strategies and market concepts discussed in our content are designed to help readers better understand market behavior. They are not trading recommendations. Financial markets are volatile, and every trader should test ideas carefully, manage risk and make independent decisions.