Market Structure Break Indicator
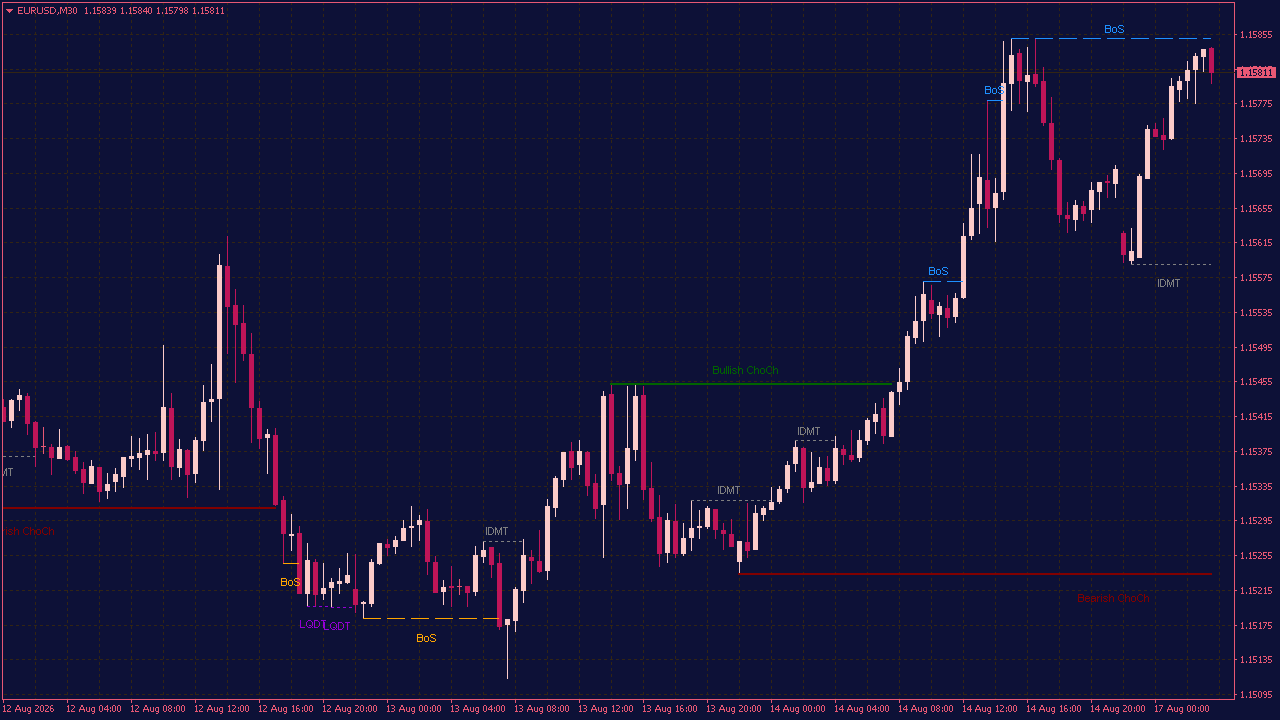
The Market Structure Indicator gives you a clearer view of what is actually happening behind the candles. Instead of marking every swing high, swing low, and structural break by hand, it organizes the important levels directly on the chart. This makes it easier to see whether price is still respecting the current trend or whether the character of the market is beginning to change. The indicator tracks events such as Break of Structure (BOS), Change of Character (CHoCH), Equal Highs, Equal Lows, inducement, and relevant liquidity areas.
Used together, these markings can provide useful context around continuation moves, possible reversals, and locations where price may first reach for liquidity before choosing a clearer direction. The goal is not to fill the chart with signals, but to make market structure easier to read at a glance. What becomes interesting is the order in which these events appear. A breakout on its own can be misleading. A liquidity sweep can look insignificant. But when price takes a key level, reacts, and then changes structure, the situation suddenly deserves more attention. The Market Structure Indicator brings these pieces together so you can focus less on drawing lines and more on understanding what price is doing.