OBV Bands Indicator with Arrows
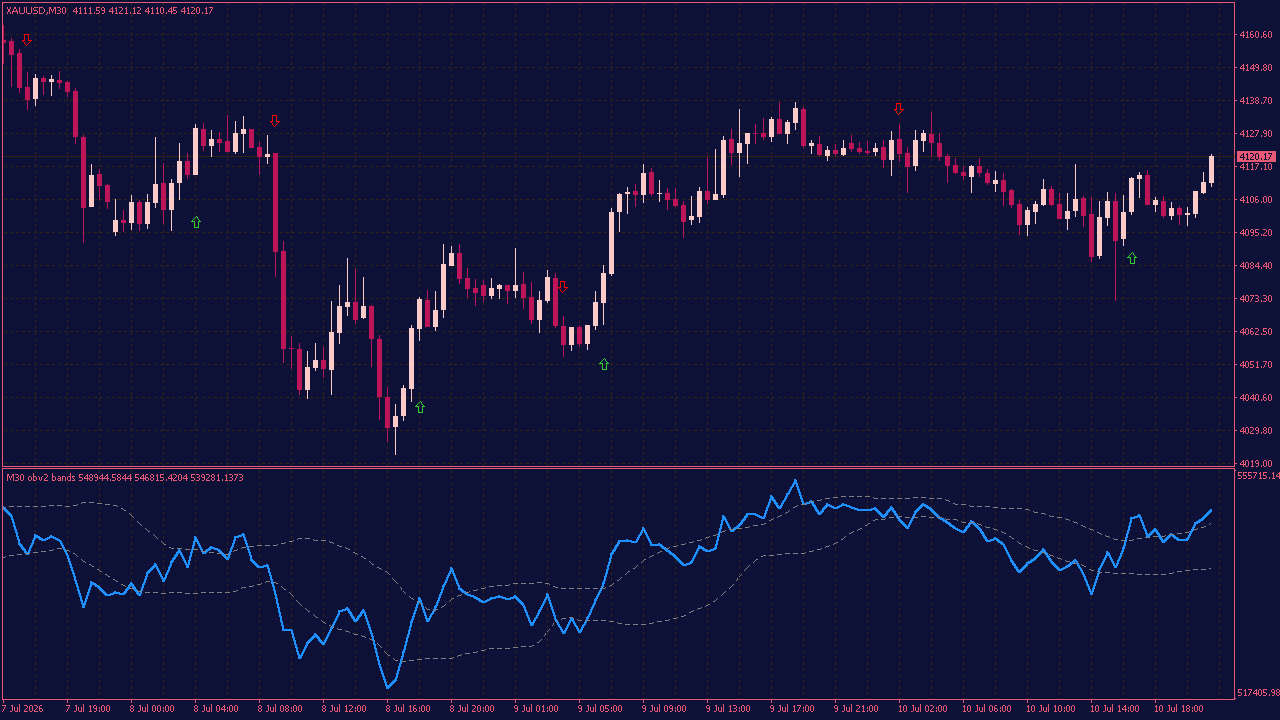
The OBV Bands Indicator with Arrows helps uncover activity that may not be obvious from the price chart at first glance. It tracks volume momentum and compares it with dynamic upper and lower bands. When the OBV moves beyond one of these levels, a directional arrow appears. This can highlight moments when buyers or sellers are becoming more active than usual, without adding unnecessary clutter to the chart. The interesting part is what happens next. Will price follow the shift in volume, or will the signal fade? The indicator does not predict the outcome, but it helps you see where something worth watching may be developing.