SonicR PVA Volumes Indicator
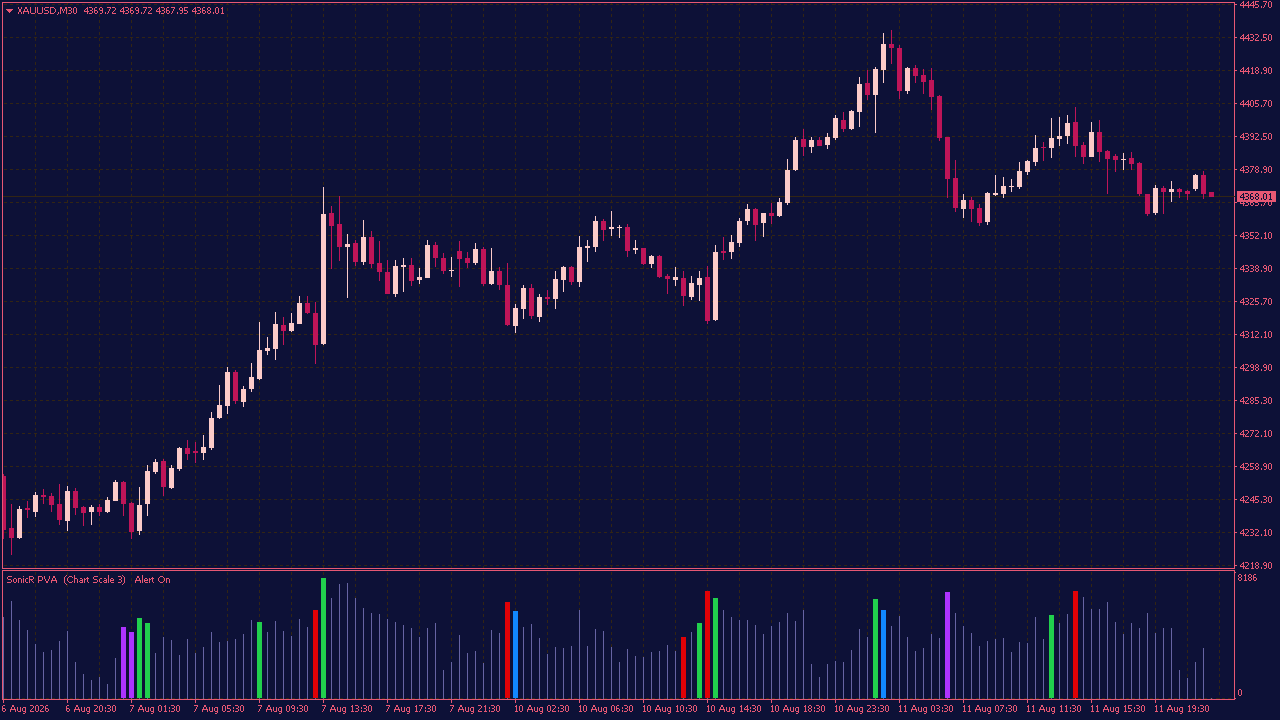
The SonicR PVA Volumes Indicator helps bring attention to those moments on the chart that are easy to overlook in real time. A sudden increase in activity, an unusually strong volume bar near a key level, or a breakout that attracts far more participation than the candles around it can all reveal that something in the market is changing. Rather than showing volume as a simple histogram, the indicator compares current activity with recent volume conditions and highlights the bars that stand out. Rising volume becomes easier to recognize, while stronger price-and-volume combinations can point to potential climax activity. This makes the indicator particularly useful around breakouts, reversals, support and resistance, and periods when momentum suddenly changes. The highlighted bar, however, is only the starting point. What price does next often matters more. Does the move continue cleanly, stall, reject the level, or reverse completely? The SonicR PVA Volumes Indicator helps make unusual activity easier to spot so traders can focus on the part that really matters: how price reacts once that activity appears.