Yesterday Fibo Dashboard Indicator with Button
The Yesterday Fibonacci Dashboard is designed to help traders quickly assess market behavior based on the previous day’s range. When enabled, the Yesterday Fibonacci Dashboard monitors price action relative to yesterday’s high and low levels:
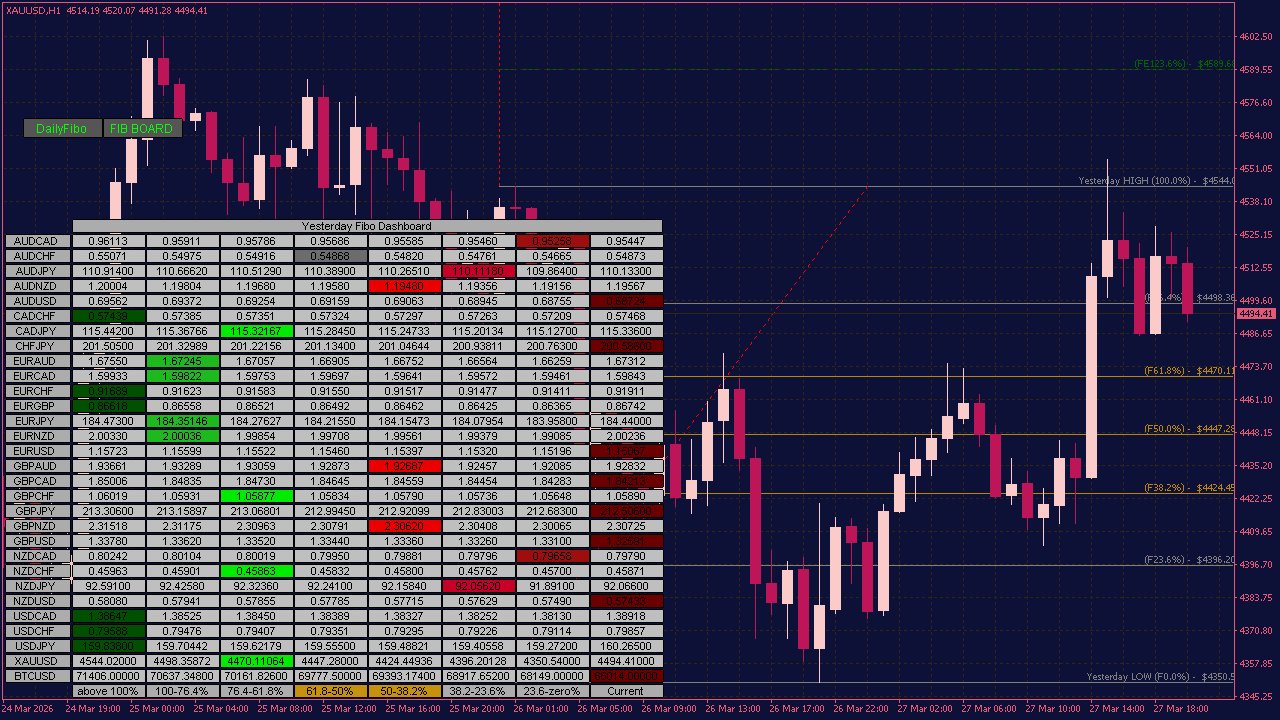
- If price breaks above yesterday’s high, the Yesterday Fibonacci Dashboard highlights it in dark green, signaling a bullish breakout.
- If price drops below yesterday’s low, it is marked in maroon, indicating a bearish breakout.
- When price remains within yesterday’s range, the Yesterday Fibonacci Dashboard identifies the condition as a consolidation phase, helping traders avoid false breakout signals and recognize ranging market conditions.