All Heikin-Ashi Histogram Indicator
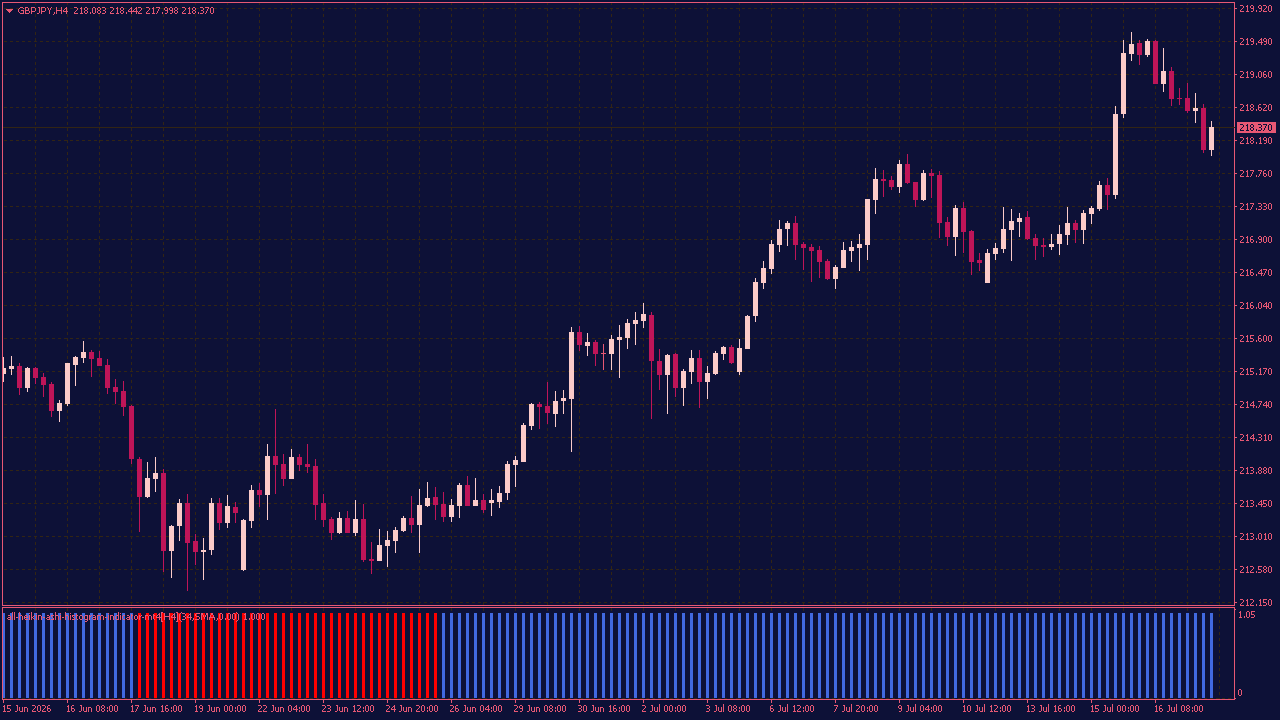
The All Heikin-Ashi Histogram Indicator gives you a cleaner way to follow market direction. It turns Heikin-Ashi price data into a simple histogram, so you can see whether buyers or sellers currently have the upper hand without adding more clutter to your chart. You can adjust the smoothing method, periods, timeframe and sensitivity to match the way you trade. This makes the indicator useful for different market conditions, whether you prefer following longer trends or watching for shorter changes in momentum. The interesting part often appears when the histogram stops confirming the current move. A new color after a long sequence may suggest that momentum is shifting, giving you a reason to take a closer look before the change becomes obvious on the price chart.