Parabolic SAR MTF Histogram with Alerts & Arrows
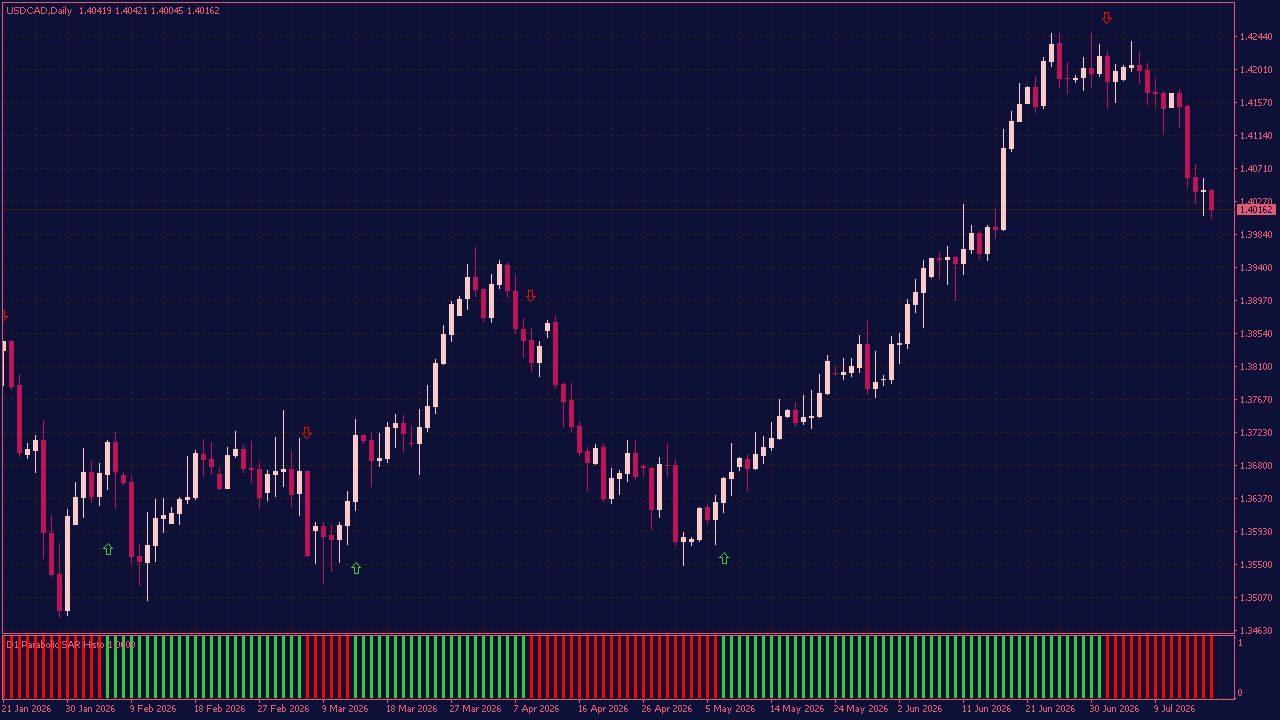
The Parabolic SAR MTF Histogram with Alerts and Arrows is made for traders who want to understand the broader direction without constantly switching between charts. It displays the Parabolic SAR trend from a selected timeframe as a simple green or red histogram. At first glance, it looks straightforward. Green shows an upward phase, red shows a downward phase. But the moment the histogram changes color is where things become interesting, especially when price is approaching an important level or the current trend already looks tired. Arrows can highlight each change directly on the price chart, while the alert options keep you informed when you are focused on something else. Sometimes one color change means very little. Sometimes it is the first clue that the market is about to behave differently.