Swami CCI Indicator
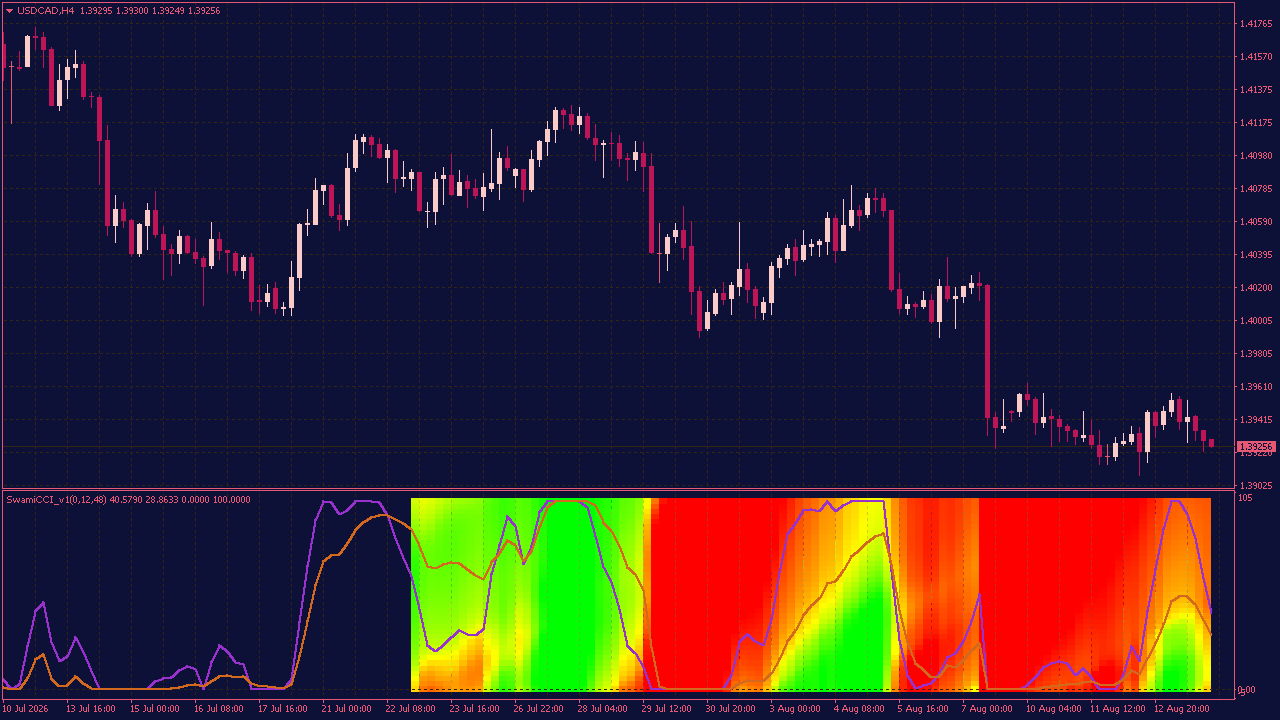
The Swami CCI Indicator takes a different approach to momentum. Instead of showing just one CCI line, it looks at several CCI periods at once and turns them into a visual map. This gives you a much better feel for what is actually happening behind the current price movement. What I find most useful is watching the colors change before everything lines up in the same direction. Sometimes the faster periods react first, while the slower ones are still holding their ground. That little disagreement can tell you more than a simple crossover ever could. It is not about finding a magic buy or sell signal. The interesting part is seeing momentum develop step by step — especially during those quiet moments when the chart itself does not seem to be saying much yet.