MACD Indicator on Chart
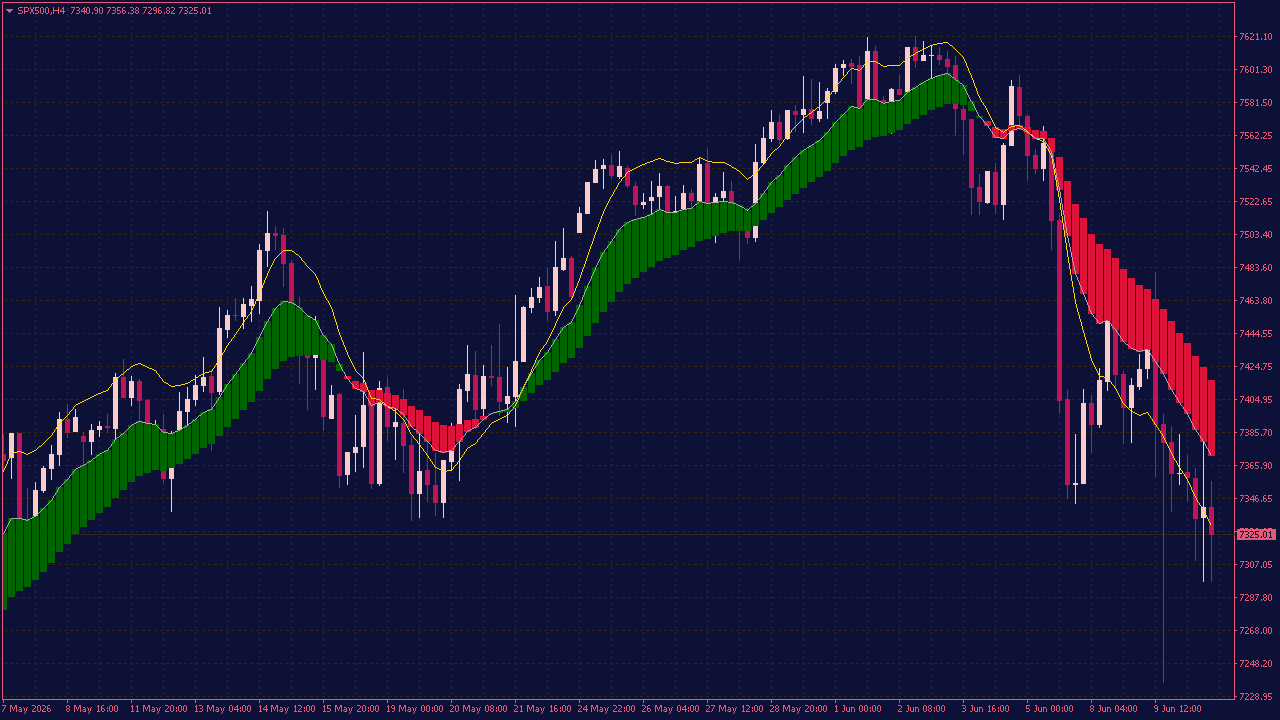
The MACD Indicator on Chart is a trend and momentum analysis tool that displays MACD signals directly on the price chart instead of a separate indicator window. Using color-coded histogram bars and moving average confirmation, it helps traders quickly identify bullish and bearish market conditions. Green bars indicate increasing bullish momentum, while red bars signal growing bearish pressure. By highlighting momentum shifts and trend changes in real time, the indicator assists traders in spotting potential entry and exit opportunities while staying aligned with the prevailing market direction.